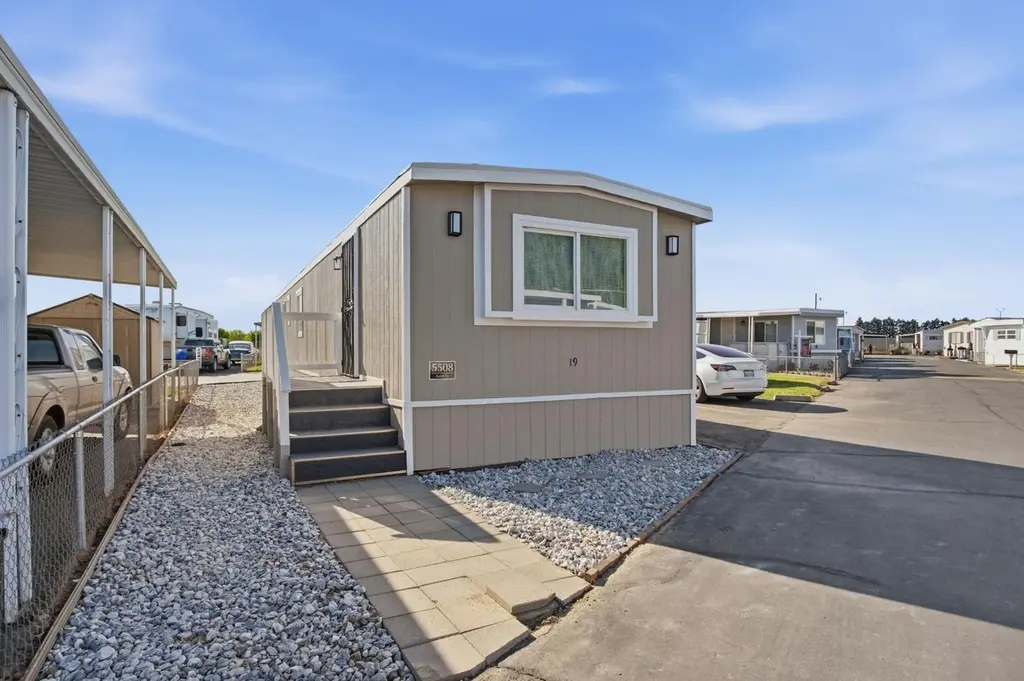
5508 Keith Ct #19 · Sacramento, CA
Flood risk 7/10 · Major
- FEMA flood zone
- X (unshaded)
- Chance of flooding over 30 yrs
- 0.96%
- Est. flood insurance / yr
- $507 – $1,088
Fire risk 6/10 · Moderate
- Est. fire insurance / yr
- $659 – $1,223
Heat risk 7/10 · Major
- Hot days now (above 102°F)
- 7 days/yr
- Hot days in 30 yrs
- 16 days/yr
Wind risk 1/10 · Minimal
- Chance of severe wind over 30 yrs
- —
Air-quality risk 10/10 · Severe
- Unhealthy air days now
- 33 days/yr
- Unhealthy air days in 30 yrs
- 35 days/yr
Risk factors via First Street. Map © Google.
Why this score? — see what drove the B grade
The composite is a weighted blend of 9 inputs, each scored 0–100. Each bar is that input's sub-score; the figure is the points it added to the 100-point composite (weight × sub-score).
- Cash flow +30.0/30.0
- 1% rule +10.0/10.0
- DSCR +10.0/10.0
- ARV discount +9.3/15.0
- Schools +5.0/10.0
- Condition / age +4.0/5.0
- Livability +3.6/5.0
- Rent growth +2.5/5.0
- Appreciation +0.0/10.0
$62,500
🖨 Deal sheet (PDF) 📄 Offer letter ✓ Due diligence
Listing remarks
Welcome to this fully remodeled 2-bedroom, 1-bath mobile home located in the desirable Countryside Mobile Home Estates, a 55+ senior community. This home features modern finishes, updated fixtures, and a bright, open layout. Conveniently situated near Highway 99 and less than 10 minutes from shopping, dining, and everyday amenities. Move in ready and ideal for low-maintenance living.
Key facts
- Fully remodeled
- Bright open layout
- Modern finishes
Tags
Property features AI
Finance
- Financial info: Land lease indicates No (note: a land lease amount of $700 is listed separately)
- HOA & community: No homeowners association; Senior community
Exterior
- Utilities: Public water; 220 volts in laundry; Other sewer; Other electric/utilities
- Home design: Manufactured home in park; Single wide; Knollwood make; Wood skirting; Built in 1989
- Construction: Other roof type
- Exterior features: No notable lot features listed; Other utilities listed
Interior
- Kitchen: Hood over range; Dishwasher
- Bedrooms: 2 bedrooms
- Flooring: Carpet; Vinyl
- Bathrooms: 1 full bathroom with tub/shower combo
- Heating & cooling: Central heating; Central air; Ceiling fans
- Interior features: Great room living area; Dining and living room combined; Pantry closet
- Laundry & utility: Indoor laundry hookups; 220V outlet in laundry area
Neighborhood map
What this means for you Summary
Snapshot
- This is a 2-bed/1.0-bath manufactured listed at $62k. Condition is rated good.
Deal economics
- At list price, monthly cash flow is $1k ($17k/yr) — positive.
- The deal already cash-flows at list — no discount required.
- Meets the 1% rule at list price ($2k rent vs $62k).
- Recommended offer: $61k (3.0% below list) — sets the bar for market timing.
- Cap rate 34.6% vs local median 3.0% in Sacramento — top-decile yield for the area; either an underpriced asset or a hidden risk that comps aren't pricing in. Stress-test before assuming the spread holds.
Location & tenants
- Location reads 71/100 on livability (#218 in CA) — a middle-class / working-renter tenant base. Strengths: amenities A+, commute A+, housing A; Watch: crime F, cost of living F.
- Zoned schools: Keyes Elementary (math 20% / reading 29%, grade F, #973 of 1,571 statewide, top 73%, 473 students, 85% FRL); Barbara Spratling Middle (math 16% / reading 31%, grade F, #370 of 498 statewide, top 75%, 229 students, 89% FRL).
- Market conditions: 105 active listings in the ZIP; 1 comparable units currently listed for rent nearby; solid renter incomes; 923 units permitted in Stanislaus County in 2024 (63 in 5+ unit buildings).
- This rent runs 35% of the median local income ($82k/yr) — at the standard rent-burdened threshold; future hikes will face affordability resistance.
Forward outlook
- Local home prices are declining (-3.0%/yr); year-one equity from $432 of loan paydown is wiped out by about $2k of value loss. Plan a longer hold.
- Stanislaus County population projected at +14% by 2050 — modest demand growth; plan on rents tracking national, not racing it.
- At projected returns (-3.0% appreciation + 3.0% rent growth), your $18k cash investment doubles in ~2 years — after that, you're playing with house money.
Negotiation context
- It's been on market 60 days — a 3% lower offer ($61k) is reasonable based on typical stale-listing flexibility.
Risks & watch-outs
- Watch-outs: flood insurance adds $66/mo.
- Climate carrying-cost: major flood risk; major wildfire risk; extreme-heat days projected 7→16/yr by 2055 (HVAC capex compounding) — expect insurance premiums to compound above CPI over the hold.
Questions for the listing agent
- It's been on market 60 days. Have you received any prior offers? Is the seller open to a 3% concession, seller financing, or rate buy-down credit?
- What's the actual annual flood-insurance premium (NFIP or private), and is the property in a SFHA with mandatory coverage?
- Is there a deadline driving the sale (1031 exchange, divorce, estate, relocation)? That informs how much negotiation room exists.
- Schools are D-rated, which usually means shorter tenancies and higher turnover. Who's the typical renter profile here, and what's been the actual vacancy rate?
- Crime grade is F in this area — have there been break-ins, vandalism, or insurance claims at this property in the last 3 years? What carrier currently insures it and at what premium?
- What's the average days-on-market for RENTAL listings here right now (not sales)? A rising rental-DOM trend means longer vacancies and softer asking-rent achievability than the comps imply.
- What's the recent tenant-quality profile in this submarket — average credit score on applications, eviction rate, late-payment / NSF rate, and stable-employment percentage? A property-management company in the area should have these aggregated.
- How much new for-sale + rental construction is in the pipeline within 1–3 miles? Heavy new supply typically softens prices + rents 12–24 months out; constrained supply supports both.
Investment metrics
- 1% rule
- 3.86% ✓
- Cap rate
- 34.57%
- Cash-on-cash
- 100.98%
- DSCR
- 5.49
- GRM
- 2.2
CMA / ARV
- ARV (on-the-fly)
- $65,072
- Comps found
- 3
Show comp detail 3 sales within ~0.75 mi
| Address | Dist | Beds/Ba | Sqft | Sold | Price | $/sf | Match |
|---|---|---|---|---|---|---|---|
| 5538 Keith Ct | 0.09mi | 2/1.0 | 720 (-8%) | 14mo | $40,000 | $56 | 71 |
| 5526 Keith Ct | 0.09mi | 2/1.0 | 696 (-11%) | 10mo | $57,500 | $83 | 69 |
| 5061 Nunes Rd #39 | 0.67mi | 2/1.0 | 800 (+2%) | 12mo | $74,500 | $93 | 56 |
Match score weights: distance 35% · size 25% · config 20% · recency 20%. Top-matched comps best support the ARV.
Projected returns pro-forma
-3.0% appreciation · 3.0% rent growth · sell at horizon
- IRR
- 97.4%
- Equity multiple
- 5.54×
- Total profit
- $79,509
- Equity at exit
- $9,319
- IRR
- —
- Equity multiple
- 11.56×
- Total profit
- $184,871
- Equity at exit
- $5,404
Cash invested: $17,500 (down + closing). Projections, not guarantees.
Landlord ↔ Tenant lean methodology
- Overall (STATE)
- 18 Strongly Tenant-Friendly
- State California
- 18 Strongly Tenant-Friendly · D+13
- County
- — inherits STATE
- City
- — inherits STATE
ZIP-level market 95832
- Active inventory
- 105
- Price-to-rent
- 2.2×
Monthly cashflow live
- Estimated rent
- $2,411 medium interval (Pro) →
- Mortgage (P&I)
- −$328
- Tax est. 1.5%
- −$78 /mo · $938/yr
- Insurance
- −$26
- Flood insurance flood zone
- −$66 /mo · $798/yr
- HOA
- −$0
- Vacancy / Maint / Mgmt
- −$506
- Net cashflow
- $1,406
Break-even live
Sensitivity live
| Price | -10% $1,449 | -5% $1,428 | +0% $1,406 | +5% $1,385 | +10% $1,363 |
|---|---|---|---|---|---|
| Rent | -10% $1,216 | -5% $1,311 | +0% $1,406 | +5% $1,501 | +10% $1,597 |
| Rate | -1.0pp $1,438 | -0.5pp $1,422 | base $1,406 | +0.5pp $1,390 | +1.0pp $1,373 |
UW: 25.0% down · 7.5% · 30yr · 1.5% tax · 5.0% vac · 8.0% maint · 8.0% mgmt
Financing live
Cash to close
- Down payment
- $15,625
- Closing costs
- $1,875
- Reserves months
- —
- Total cash needed
- —
Loan-product check · same deal, 3 products live
Conventional
25% down · 7.5% · 30yr
- Down + closing
- —
- Monthly P&I
- —
- Monthly cashflow
- —
- DSCR
- —
- Eligible?
- —
Personal DTI + credit; lowest rate.
DSCR
20% down · 8.5% · 30yr
- Down + closing
- —
- Monthly P&I
- —
- Monthly cashflow
- —
- DSCR
- —
- Eligible?
- —
No personal income docs; deal must DSCR.
Hard money
10% down · 12.0% · 12mo
- Down + closing
- —
- Monthly P&I
- —
- Monthly cashflow
- —
- DSCR
- —
- Eligible?
- —
Short-term bridge; refi at stabilization.
Rent comps 1 comps
| Address | Beds | Baths | Sqft | Rent | $/sqft | DOM | Units | Dist |
|---|---|---|---|---|---|---|---|---|
| 3025 W Christoffersen Pkwy Turlock, CA | 2.0 | 1.0–2.0 | 971 | $2,217 | $2.28 | 15d | 15 | 1.12mi |
Listing history 16 events
-
2026-06-21days on market $62,500 Active 60 DOM
-
2026-06-18price $62,500 Active 57 DOM
-
2026-06-18days on market $65,900 Active 57 DOM
-
2026-06-17days on market $65,900 Active 56 DOM
-
2026-06-16days on market $65,900 Active 55 DOM
-
2026-06-15days on market $65,900 Active 54 DOM
-
2026-06-14days on market $65,900 Active 52 DOM
-
2026-06-10days on market $65,900 Active 49 DOM
-
2026-06-09days on market $65,900 Active 48 DOM
-
2026-06-08days on market $65,900 Active 47 DOM
-
2026-06-07days on market $65,900 Active 46 DOM
-
2026-06-03days on market $65,900 Active 42 DOM
-
2026-06-02days on market $65,900 Active 41 DOM
-
2026-06-01days on market $65,900 Active 40 DOM
-
2026-05-31days on market $65,900 Active 39 DOM
-
2026-05-30days on market $65,900 Active 38 DOM
ⓘ Source: listings_history table (triggers on properties + properties_extension) + one-shot
backfill from property_details.listing_events for pre-trigger history.
Climate risk First Street
- Flood 7/10 Severe FEMA zone X (unshaded) · 96% chance over 30 yrs
- Wildfire 6/10 Major
- Heat 7/10 Severe 7 d/yr ≥102°F today · 16 d/yr by 30 yrs out
- Wind 1/10 Low
- Air quality 10/10 Extreme 33 unhealthy d/yr today · 35 by 30 yrs out
Nearby sold comps map
Loading sold comps map…
Walkable amenities ~0.75 mi
Loading nearby amenities…
Taxation est. · year 1
- Rental income
- $28,930
- − Mortgage interest
- −$3,501
- − Property taxes
- −$938
- − Insurance
- −$1,110
- − Repairs & maintenance
- −$2,314
- − Management
- −$2,314
- − Depreciation
- −$1,818
- Taxable income
- $16,934
- Est. tax owed @ 24.0%
- −$4,064
- After-tax cash flow
- $12,810/yr
For passive investors: Depreciation is non-cash, so a rental often shows a tax loss while cash-flowing — sheltering income. Rental losses are passive: they offset passive income freely, and up to $25,000/yr can offset ordinary (W-2) income if you actively participate and your MAGI is under $100k (phasing out to $0 by $150k); unused losses carry forward. On sale, claimed depreciation is recaptured at up to 25%, and gains may owe capital-gains tax (a 1031 exchange can defer both). Figures are a year-1 estimate at your 24.0% rate — not tax advice; consult a CPA.
Condition & rehab AI · 12 photos
This fully remodeled 2-bedroom, 1-bath mobile home is move-in ready and ideal for low-maintenance living. It features modern finishes, updated fixtures, and a bright, open layout. Consider painting the exterior siding and adding landscaping and outdoor living space to further enhance its value.
Value-add opportunities
- Both Painting exterior siding — Enhances curb appeal and value.
- Both Landscaping improvements — Enhances curb appeal and value.
- Both Addition of a small patio or deck — Improves outdoor living space and value.
- Both Addition of a small storage shed — Provides additional storage and enhances curb appeal.
Renovation cost estimate screening
Value-add ROI direction
- Both Painting exterior siding — Enhances curb appeal and value. ↑
- Both Landscaping improvements — Enhances curb appeal and value. ↑
- Both Addition of a small patio or deck — Improves outdoor living space and value. ↑
- Both Addition of a small storage shed — Provides additional storage and enhances curb appeal. ↑
ⓘ Cost ranges are severity-bucket heuristics (US national rule-of-thumb). Get contractor quotes + a written scope before underwriting a rehab budget.
Schools (NCES district)
No district data.
Livability — Sacramento
- Score
- 71/100
- State rank
- #218
- US rank
- #6957
Category grades
Schools grade is shown separately in the Schools card above.
Census & demographics
- County
- Sacramento County · 1,539,646 people
- City population
- 761,410
- Metro
- Sacramento-Roseville-Folsom, CA
- Population (ZIP)
- 12,850
- Household income
- $82,318
- Rent vs Own
- Severe rent burden
- 509.0
Population outlook (Stanislaus County) Hauer SSP2
- Today (2025)
- 579,493 people
- By 2030
- 598,000 · +3.2%
- By 2040
- 630,930 · +8.9%
- By 2050
- 658,300 · +13.6%
- By 2075
- 712,363 · +22.9%
- By 2100
- 719,805 · +24.2%
Race, ethnicity, and origin ACS 2023
- Neighborhood character
- Highly diverse neighborhood (Simpson 0.74)
- Race & ethnicity
- Hispanic / Latino 36% Asian 33% Two or more races 16% White 12% Black 10% Pacific Islander 3% Native American 2%
- Hispanic origin (detail)
- Mexican 26% Puerto Rican 4%
- Common ancestry
- Lithuanian 1% Scotch-Irish 1% Subsaharan African 1%
- Foreign-born
- 30% · Canada, China, South Korea
- Languages at home
- 44% English-only · Spanish 21% Other Asian/Pacific 15% Other Indo-European 8%
Political lean MEDSL · Stanislaus
- 2024 margin
- R (+11.0) · D 43.2% · R 54.2% · Other 2.6%
- 2008→2024 swing
- -12.7pp toward R · 2008: 1.7pp · 2024: -11.0pp
- All cycles
- 2024: R+11.0 2020: D+0.8 2016: D+0.6 2012: D+0.7 2008: D+1.7
Not yet ingested
- Civics
- —
Market trends
- HPI YoY
- ▼ -199.16%
- Current HPI
- 362.481
- Rent YoY
- —
- Metro
- Sacramento-Roseville-Folsom, CA
- State GDP YoY
- ▲ 3.21%
- F500 in state
- 116
Industry mix (Fortune 500 HQ in CA)
| Industry | F500 HQs | Revenue |
|---|---|---|
| Technology | 27 | $1,492B |
|
||
| Financial Services | 3 | $174B |
|
||
| Retail | 3 | $44B |
|
||
| Insurance | 3 | $26B |
|
||
| Media / Entertainment | 2 | $115B |
|
||
| Pharmaceuticals / Biotech | 2 | $62B |
|
||
Cash-flow waterfall
monthlySold comps — $/sqft
last 12 mo · ≤1 miLoading sold comps…