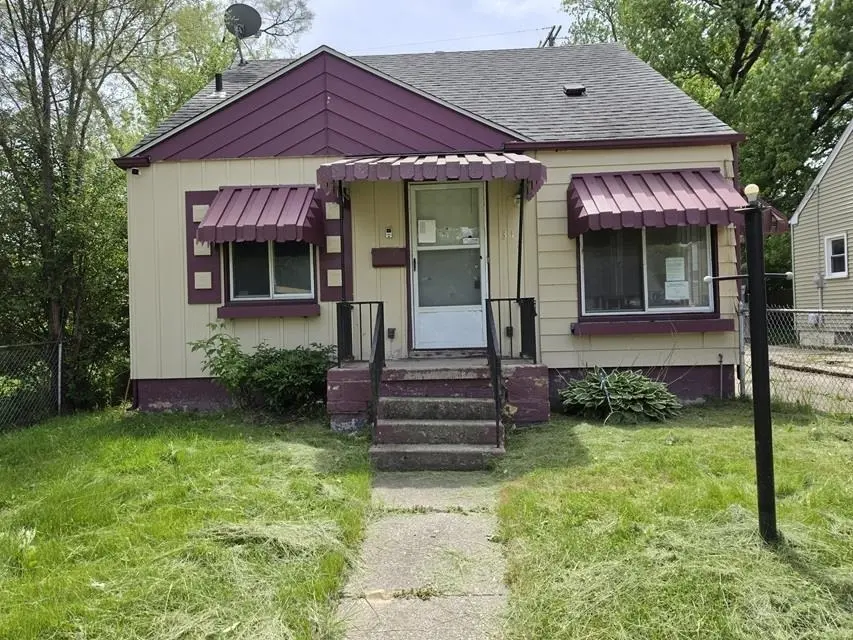
318 E Philadelphia Blvd · Flint, MI
Flood risk 4/10 · Minor
- FEMA flood zone
- X (unshaded)
- Chance of flooding over 30 yrs
- 0.22%
- Est. flood insurance / yr
- $507 – $1,088
Fire risk 1/10 · Minimal
- Est. fire insurance / yr
- $784 – $1,456
Heat risk 2/10 · Minimal
- Hot days now (above 96°F)
- 7 days/yr
- Hot days in 30 yrs
- 15 days/yr
Wind risk 2/10 · Minimal
- Chance of severe wind over 30 yrs
- —
Air-quality risk 2/10 · Minimal
- Unhealthy air days now
- 1 days/yr
- Unhealthy air days in 30 yrs
- 3 days/yr
Risk factors via First Street. Map © Google.
Why this score? — see what drove the A- grade
The composite is a weighted blend of 9 inputs, each scored 0–100. Each bar is that input's sub-score; the figure is the points it added to the 100-point composite (weight × sub-score).
- Cash flow +30.0/30.0
- ARV discount +15.0/15.0
- 1% rule +10.0/10.0
- DSCR +10.0/10.0
- Appreciation +6.3/10.0
- Livability +3.7/5.0
- Rent growth +2.5/5.0
- Condition / age +2.5/5.0
- Schools +1.1/10.0
$24,900
🖨 Deal sheet 📄 Offer letter ✓ Due diligence
Listing remarks MLS
Cute and cozy 3-bedroom, 1-bath home offering great potential! This inviting property features hardwood flooring throughout the main living areas and upper level, adding warmth and character to the home. Spacious living room with plenty of natural light, functional layout. The home has been maintained and offers a solid opportunity for an owner-occupant or investor alike. With convenient access to local amenities, shopping, schools, and expressways. While the property could still use a little TLC and cosmetic updating, it has great bones and plenty of potential to make it your own. A great value with charm and opportunity! As-Is seller will not make any repairs.
Key facts
- Hardwood flooring
- Convenient access
- Natural light
Tags
Property features AI
Finance
- Other: Subdivision: Boulevard Heights; Cross streets: E Pierson Rd and Martin Luther King
- HOA & community: Homeowners association present
Exterior
- Utilities: Public water; Public sewer
- Home design: Single-family residence; One and one-half stories
- Construction: Aluminum siding; Block foundation
- Exterior features: Front porch; Fenced yard; Paved road access
Interior
- Bedrooms: Total of 3 rooms (includes bedrooms and other living spaces)
- Bathrooms: 1 full bathroom
- Heating & cooling: Forced air heating (natural gas); No central cooling
- Interior features: Finished living area above grade of 870 square feet; Finished area below grade (basement) of 348 square feet; Block basement
Neighborhood map
What this means for you Summary
Snapshot
- This is a 3-bed/1.0-bath single-family listed at $25k.
Deal economics
- At list price, monthly cash flow is $583 ($7k/yr) — positive.
- The deal already cash-flows at list — no discount required.
- Meets the 1% rule at list price ($1k rent vs $25k).
- Cap rate 34.4% vs local median 11.5% in Flint — top-decile yield for the area; either an underpriced asset or a hidden risk that comps aren't pricing in. Stress-test before assuming the spread holds.
Location & tenants
- Location reads 74/100 on livability (#196 in MI, #4,946 nationally) — a middle-class / working-renter tenant base. Strengths: commute A+, cost of living A+, housing A+; Watch: schools F, crime F, employment F.
- Flint School District (urban): math 7% / reading 13% proficiency, ranked #714 of 760 in MI (top 94%) — low school quality limits family demand, transient renter base, plan for 1-2y turnover; 83% free/reduced lunch — lower-income household profile, screen leases tightly.
- Market conditions: 99 active listings in the ZIP; 10 comparable units currently listed for rent nearby; rentals leasing fast (median 13d on market — plan ~1-2 weeks tenant-placement turnaround); lower-income renter base — watch delinquency; 419 units permitted in Genesee County in 2024 (68 in 5+ unit buildings).
- This rent runs 36% of the median local income ($33k/yr) — at the standard rent-burdened threshold; future hikes will face affordability resistance.
Forward outlook
- In year one you build about $838 of equity ($172 loan paydown + $666 appreciation (2.7% local appreciation)).
- Genesee County population projected at -27% by 2050 — secular population decline; favor cash flow + early exit over multi-decade hold.
- At projected returns (2.7% appreciation + 3.0% rent growth), your $7k cash investment doubles in ~1 year — after that, you're playing with house money.
Negotiation context
- Only 14 days on market — expect competitive offers; lowballing is unlikely to land.
- 2 sale attempts with the ask held roughly flat each time — persistent listings suggest the price (not the market) is what's stuck; bring a comps-based counter.
Risks & watch-outs
- Watch-outs: property tax is 3.5% of price; built in 1920 — expect roof / HVAC / electrical / plumbing capex.
Questions for the listing agent
- Built in 1920 — when were the roof, HVAC, electrical panel, plumbing, and water heater last replaced?
- Property tax is high relative to price — has the assessment been appealed recently, and will the sale trigger a re-assessment?
- Is there a deadline driving the sale (1031 exchange, divorce, estate, relocation)? That informs how much negotiation room exists.
- Schools are F-rated, which usually means shorter tenancies and higher turnover. Who's the typical renter profile here, and what's been the actual vacancy rate?
- Crime grade is F in this area — have there been break-ins, vandalism, or insurance claims at this property in the last 3 years? What carrier currently insures it and at what premium?
- What's the average days-on-market for RENTAL listings here right now (not sales)? A rising rental-DOM trend means longer vacancies and softer asking-rent achievability than the comps imply.
- What's the recent tenant-quality profile in this submarket — average credit score on applications, eviction rate, late-payment / NSF rate, and stable-employment percentage? A property-management company in the area should have these aggregated.
- How much new for-sale + rental construction is in the pipeline within 1–3 miles? Heavy new supply typically softens prices + rents 12–24 months out; constrained supply supports both.
Investment metrics
- 1% rule
- 4.04% ✓
- Cap rate
- 34.37%
- Cash-on-cash
- 100.28%
- DSCR
- 5.46
- GRM
- 2.1
CMA / ARV
- ARV (on-the-fly)
- $31,668
- Comps found
- 12
Show comp detail 12 sales within ~0.75 mi
| Address | Dist | Beds/Ba | Sqft | Sold | Price | $/sf | Match |
|---|---|---|---|---|---|---|---|
| 605 E Baltimore Blvd | 0.22mi | 3/2.0 | 1,257 (+3%) | 3mo | $50,000 | $40 | 78 |
| 614 E Marengo Ave | 0.23mi | 4/1.5 (+1) | 1,250 (+3%) | 1mo | $32,000 | $26 | 77 |
| 306 W Bishop Ave | 0.34mi | 4/1.5 (+1) | 1,217 (-0%) | 5mo | $50,000 | $41 | 73 |
| 114 W Stewart Ave | 0.36mi | 2/1.0 (-1) | 1,227 (+1%) | 7mo | $19,000 | $15 | 71 |
| 733 Black Ave | 0.48mi | 2/2.0 (-1) | 1,282 (+5%) | 7mo | $45,000 | $35 | 54 |
| 606 Damon St | 0.53mi | 4/1.5 (+1) | 1,122 (-8%) | 5mo | $7,900 | $7 | 52 |
| 746 Damon St | 0.65mi | 4/1.5 (+1) | 1,170 (-4%) | 8mo | $35,000 | $30 | 49 |
| 634 E Pulaski Ave | 0.29mi | 2/1.0 (-1) | 1,384 (+14%) | 12mo | $10,000 | $7 | 49 |
| 606 Stewart Ave | 0.61mi | 3/2.0 | 1,375 (+13%) | 3mo | $5,000 | $4 | 44 |
| 302 E Piper Ave | 0.64mi | 3/1.0 | 1,080 (-11%) | 14mo | $15,000 | $14 | 39 |
| 414 W Marengo Ave | 0.42mi | 3/1.0 | 1,041 (-14%) | 20mo | $22,500 | $22 | 39 |
| 618 W Mott Ave | 0.72mi | 3/1.0 | 1,090 (-10%) | 19mo | $46,000 | $42 | 33 |
Match score weights: distance 35% · size 25% · config 20% · recency 20%. Top-matched comps best support the ARV.
Projected returns pro-forma
2.67% appreciation · 3.0% rent growth · sell at horizon
- IRR
- —
- Equity multiple
- 6.70×
- Total profit
- $39,720
- Equity at exit
- $10,742
- IRR
- —
- Equity multiple
- 13.91×
- Total profit
- $89,992
- Equity at exit
- $16,210
Cash invested: $6,972 (down + closing). Projections, not guarantees.
Landlord ↔ Tenant lean methodology
- Overall (STATE)
- 62 Landlord-Friendly
- State Michigan
- 62 Landlord-Friendly · EVEN
- County
- — inherits STATE
- City
- — inherits STATE
ZIP-level market 48505
- Home prices YoY
- 1.3%
- Active inventory
- 99
- Price-to-rent
- 2.1×
Monthly cashflow live
- Estimated rent
- $1,007 high interval (Pro) →
- Mortgage (P&I)
- −$131
- Tax from tax record
- −$72 /mo · $864/yr
- Insurance
- −$10
- HOA
- −$0
- Vacancy / Maint / Mgmt
- −$211
- Net cashflow
- $583
Break-even live
UW: 25.0% down · 7.5% · 30yr · 1.5% tax · 5.0% vac · 8.0% maint · 8.0% mgmt
Financing live
Cash to close
- Down payment
- $6,225
- Closing costs
- $747
- Reserves months
- —
- Total cash needed
- —
Loan-product check · same deal, 3 products live
Conventional
25% down · 7.5% · 30yr
- Down + closing
- —
- Monthly P&I
- —
- Monthly cashflow
- —
- DSCR
- —
- Eligible?
- —
Personal DTI + credit; lowest rate.
DSCR
20% down · 8.5% · 30yr
- Down + closing
- —
- Monthly P&I
- —
- Monthly cashflow
- —
- DSCR
- —
- Eligible?
- —
No personal income docs; deal must DSCR.
Hard money
10% down · 12.0% · 12mo
- Down + closing
- —
- Monthly P&I
- —
- Monthly cashflow
- —
- DSCR
- —
- Eligible?
- —
Short-term bridge; refi at stabilization.
Rent comps 10 comps
| Address | Beds | Baths | Sqft | Rent | $/sqft | DOM | Units | Dist |
|---|---|---|---|---|---|---|---|---|
| 411 W Marengo Ave Flint, MI | 3.0 | 1.0 | 1350 | $1,072 | $0.79 | 13d | 1 | 0.42mi |
| 100 Rosewood Mnr Flint, MI | 2.0 | 1.5 | 1159 | $947 | $0.82 | 13d | 1 | 0.52mi |
| 5413 DuPont St Flint, MI | 4.0 | 1.5 | 1038 | $900 | $0.87 | 21d | 1 | 0.77mi |
| 5813 Edwards Ave Flint, MI | 3.0 | 1.0 | 1500 | $899 | $0.60 | 13d | 1 | 0.93mi |
| 246 E York Ave Flint, MI | 2.0 | 1.0 | 800 | $895 | $1.12 | 13d | 1 | 1.08mi |
| 711 W Dewey St Flint, MI | 3.0 | 1.0 | 1011 | $925 | $0.91 | 21d | 1 | 1.10mi |
| 514 W Alma Ave Flint, MI | 3.0 | 1.0 | 894 | $925 | $1.03 | 13d | 1 | 1.16mi |
| 6802 DuPont St Flint, MI | 3.0 | 1.0 | 1200 | $1,000 | $0.83 | 21d | 1 | 1.23mi |
| 3221 Burgess St Flint, MI | 2.0 | 1.0 | 755 | $875 | $1.16 | 21d | 1 | 1.40mi |
| 5905 Griggs Dr Flint, MI | 3.0 | 1.0 | 940 | $1,000 | $1.06 | 13d | 1 | 1.43mi |
Listing history 13 events
-
2026-06-13statusdays on market $24,900 Pending 14 DOM
-
2026-06-10days on market $24,900 Active 13 DOM
-
2026-06-09days on market $24,900 Active 12 DOM
-
2026-06-08days on market $24,900 Active 11 DOM
-
2026-06-07days on market $24,900 Active 10 DOM
-
2026-06-05days on market $24,900 Active 7 DOM
-
2026-06-03days on market $24,900 Active 6 DOM
-
2026-06-02days on market $24,900 Active 5 DOM
-
2026-06-01days on market $24,900 Active 4 DOM
-
2026-05-31days on market $24,900 Active 3 DOM
-
2026-05-30days on market $24,900 Active 2 DOM
-
2026-05-28$24,900 Active 670-char remark
Show marketing remark (670 chars)
Cute and cozy 3-bedroom, 1-bath home offering great potential! This inviting property features hardwood flooring throughout the main living areas and upper level, adding warmth and character to the home. Spacious living room with plenty of natural light, functional layout. The home has been maintained and offers a solid opportunity for an owner-occupant or investor alike. With convenient access to local amenities, shopping, schools, and expressways. While the property could still use a little TLC and cosmetic updating, it has great bones and plenty of potential to make it your own. A great value with charm and opportunity! As-Is seller will not make any repairs.
-
2026-05-28$24,900 Active
Show marketing remark (670 chars)
Cute and cozy 3-bedroom, 1-bath home offering great potential! This inviting property features hardwood flooring throughout the main living areas and upper level, adding warmth and character to the home. Spacious living room with plenty of natural light, functional layout. The home has been maintained and offers a solid opportunity for an owner-occupant or investor alike. With convenient access to local amenities, shopping, schools, and expressways. While the property could still use a little TLC and cosmetic updating, it has great bones and plenty of potential to make it your own. A great value with charm and opportunity! As-Is seller will not make any repairs.
ⓘ Source: listings_history table (triggers on properties + properties_extension) + one-shot
backfill from property_details.listing_events for pre-trigger history.
Tax reassessment forecast MI · Partial reset (capped growth)
- Current annual tax
- $864 · $72/mo
- Projected year-2 tax
- $864 · $72/mo
- Expected delta
- $0/yr ($0/mo · 0.0%)
ⓘ Screening estimate from a state-policy table — verify with the county assessor before closing.
Climate risk First Street
- Flood 4/10 Moderate FEMA zone X (unshaded) · 22% chance over 30 yrs
- Wildfire 1/10 Low
- Heat 2/10 Low 7 d/yr ≥96°F today · 15 d/yr by 30 yrs out
- Wind 2/10 Low
- Air quality 2/10 Low 1 unhealthy d/yr today · 3 by 30 yrs out
Nearby sold comps map
Loading sold comps map…
Walkable amenities ~0.75 mi
Loading nearby amenities…
Taxation est. · year 1
- Rental income
- $12,084
- − Mortgage interest
- −$1,395
- − Property taxes
- −$864
- − Insurance
- −$124
- − Repairs & maintenance
- −$967
- − Management
- −$967
- − Depreciation
- −$724
- Taxable income
- $7,043
- Est. tax owed @ 24.0%
- −$1,690
- After-tax cash flow
- $5,301/yr
For passive investors: Depreciation is non-cash, so a rental often shows a tax loss while cash-flowing — sheltering income. Rental losses are passive: they offset passive income freely, and up to $25,000/yr can offset ordinary (W-2) income if you actively participate and your MAGI is under $100k (phasing out to $0 by $150k); unused losses carry forward. On sale, claimed depreciation is recaptured at up to 25%, and gains may owe capital-gains tax (a 1031 exchange can defer both). Figures are a year-1 estimate at your 24.0% rate — not tax advice; consult a CPA.
Schools (NCES district)
- District
- Flint School District
- NCES district ID
- 2614520
- Math proficiency
- 7% ▬ 0.00%
- Reading proficiency
- 13% ▲ 3.00%
- Median HH income
- $25,954
- Composite
- 10.97/100
- National rank
- #14642
- State rank
- #714 of 760 in MI
Livability — Flint
- Score
- 74/100
- State rank
- #196
- US rank
- #4946
Category grades
Schools grade is shown separately in the Schools card above.
Census & demographics
- Census place
- Flint, MI
- County
- Genesee County · 221,329 people
- City population
- 93,814
- Metro
- Flint, MI
- Population (ZIP)
- 18,032
- Household income
- $33,283
- Rent vs Own
- Severe rent burden
- 960.0
Population outlook (Genesee County) Hauer SSP2
- Today (2025)
- 381,312 people
- By 2030
- 362,731 · -4.9%
- By 2040
- 321,550 · -15.7%
- By 2050
- 279,212 · -26.8%
- By 2075
- 193,336 · -49.3%
- By 2100
- 128,118 · -66.4%
Race, ethnicity, and origin ACS 2023
- Neighborhood character
- Predominantly Black (79%)
- Race & ethnicity
- Black 79% White 11% Two or more races 6% Hispanic / Latino 3%
- Common ancestry
- Romanian 1% Iranian 1% Lithuanian 1%
- Foreign-born
- 1% · Canada
- Languages at home
- 98% English-only · Spanish 1%
Political lean MEDSL · Genesee
- 2024 margin
- Toss-up / Even · D 51.4% · R 47.2% · Other 1.4%
- 2008→2024 swing
- -28.3pp toward R · 2008: 32.5pp · 2024: 4.2pp
- All cycles
- 2024: D+4.2 2020: D+9.3 2016: D+9.5 2012: D+28.2 2008: D+32.5
Not yet ingested
- Civics
- —
Market trends
- HPI YoY
- ▲ 2.67%
- Current HPI
- 202.4878
- Rent YoY
- —
- Metro
- Flint, MI
- State GDP YoY
- ▲ 1.37%
- F500 in state
- 28
Industry mix (Fortune 500 HQ in MI)
| Industry | F500 HQs | Revenue |
|---|---|---|
| Automotive Parts | 3 | $48B |
|
||
| Automotive | 2 | $372B |
|
||
| Chemicals | 1 | $45B |
|
||
| Automotive Retail | 1 | $29B |
|
||
| Healthcare / Medical Devices | 1 | $23B |
|
||
| Automotive Technology | 1 | $20B |
|
||
Price history
+0.0% since first listed2 events — show timeline
- 2026-05-28 Listed $24,900 REALCOMP
- 2026-05-28 Listed $24,900 MiRealSource-MiMLS
Property tax history
+2.9%/yrLatest (2025): $864 · +23.1% YoY. Source: county tax records.
Cash-flow waterfall
monthlySold comps — $/sqft
last 12 mo · ≤1 miLoading sold comps…