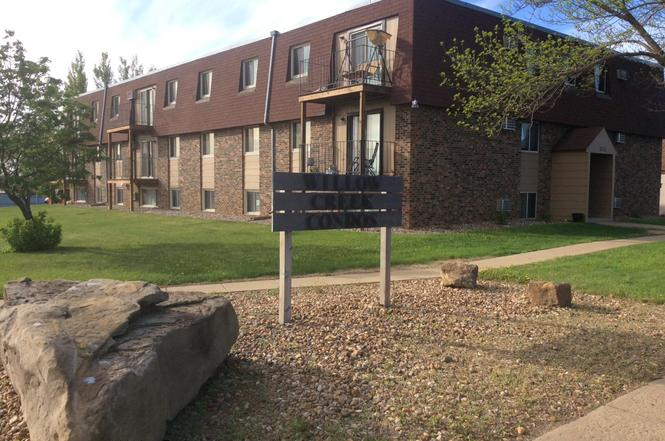
1814 Prairie Ave · Dickinson, ND
Flood risk No data
- FEMA flood zone
- —
- Chance of flooding over 30 yrs
- —
- Est. flood insurance / yr
- —
Fire risk No data
- Est. fire insurance / yr
- —
Heat risk No data
- Hot days now (above threshold)
- —
- Hot days in 30 yrs
- —
Wind risk No data
- Chance of severe wind over 30 yrs
- —
Air-quality risk No data
- Unhealthy air days now
- —
- Unhealthy air days in 30 yrs
- —
Risk factors via First Street. Map © Google.
Why this score? — see what drove the B grade
The composite is a weighted blend of 9 inputs, each scored 0–100. Each bar is that input's sub-score; the figure is the points it added to the 100-point composite (weight × sub-score).
- Cash flow +30.0/30.0
- 1% rule +10.0/10.0
- DSCR +10.0/10.0
- ARV discount +7.5/15.0
- Livability +3.8/5.0
- Schools +3.5/10.0
- Rent growth +3.0/5.0
- Condition / age +2.5/5.0
- Appreciation +0.0/10.0
$62,900
🖨 Deal sheet 📄 Offer letter ✓ Due diligence
Listing remarks MLS
Great first time home buyer opportunity or add to a rental portfolio. This is a top floor unit with a balcony facing north.
Key facts
- Garage
- Built 1977
- Listed 239 days
Neighborhood map
What this means for you Summary
Snapshot
- This is a 1-bed/1.0-bath single-family listed at $63k.
Deal economics
- At list price, monthly cash flow is $425 ($5k/yr) — positive.
- The deal already cash-flows at list — no discount required.
- Meets the 1% rule at list price ($1k rent vs $63k).
- Recommended offer: $55k (12.0% below list) — sets the bar for market timing.
- Cap rate 14.4% vs local median 2.9% in Dickinson — top-decile yield for the area; either an underpriced asset or a hidden risk that comps aren't pricing in. Stress-test before assuming the spread holds.
Location & tenants
- Location reads 76/100 on livability (#12 in ND, #3,334 nationally) — a middle-class / working-renter tenant base. Strengths: cost of living A+, housing A+, health & safety A+; Watch: amenities F, commute F.
- Dickinson 1 (town): math 35% / reading 43% proficiency, ranked #29 of 53 in ND (top 55%) — families likely to look elsewhere, expect single-tenant / working-renter base with shorter leases.
- Market conditions: Rents rising (+1.9%/yr); 235 active listings in the ZIP; solid renter incomes; 20 units permitted in Stark County in 2024 (0 in 5+ unit buildings).
- This rent is only 15% of the median local income ($86k/yr) — well below the 30% rent-burden line; pricing power to push rent on renewal without tenant pushback.
Forward outlook
- Local home prices are declining (-3.0%/yr); year-one equity from $435 of loan paydown is wiped out by about $2k of value loss. Plan a longer hold.
- Stark County population projected at +120% by 2050 — long-run rental-demand tailwind backs the buy-and-hold thesis.
- At projected returns (-3.0% appreciation + 1.9% rent growth), your $18k cash investment doubles in ~5 years — after that, you're playing with house money.
Negotiation context
- It's been on market 239 days — a 12% lower offer ($55k) is reasonable based on typical stale-listing flexibility.
- 18 sale attempts since 13y ago with the ask held roughly flat each time — persistent listings suggest the price (not the market) is what's stuck; bring a comps-based counter.
Questions for the listing agent
- It's been on market 239 days. Have you received any prior offers? Is the seller open to a 12% concession, seller financing, or rate buy-down credit?
- Built in 1977 — when were the roof, HVAC, electrical panel, plumbing, and water heater last replaced?
- Why hasn't it sold? Are there any deal-killer items the seller is aware of (foundation, flood, title, zoning, code violations)?
- Is there a deadline driving the sale (1031 exchange, divorce, estate, relocation)? That informs how much negotiation room exists.
- Schools are B-rated — typically a magnet for longer-tenancy family renters. What's the average tenant stay here, and is there a school-zone premium baked into asking?
- What's the average days-on-market for RENTAL listings here right now (not sales)? A rising rental-DOM trend means longer vacancies and softer asking-rent achievability than the comps imply.
- What's the recent tenant-quality profile in this submarket — average credit score on applications, eviction rate, late-payment / NSF rate, and stable-employment percentage? A property-management company in the area should have these aggregated.
- How much new for-sale + rental construction is in the pipeline within 1–3 miles? Heavy new supply typically softens prices + rents 12–24 months out; constrained supply supports both.
Investment metrics
- 1% rule
- 1.73% ✓
- Cap rate
- 14.40%
- Cash-on-cash
- 28.95%
- DSCR
- 2.29
- GRM
- 4.8
CMA / ARV
No comps found within radius.
Projected returns pro-forma
-3.0% appreciation · 1.95% rent growth · sell at horizon
- IRR
- 22.1%
- Equity multiple
- 1.89×
- Total profit
- $15,747
- Equity at exit
- $9,379
- IRR
- 29.5%
- Equity multiple
- 3.50×
- Total profit
- $44,053
- Equity at exit
- $5,438
Cash invested: $17,612 (down + closing). Projections, not guarantees.
Landlord ↔ Tenant lean methodology
- Overall (STATE)
- 82 Strongly Landlord-Friendly
- State North Dakota
- 82 Strongly Landlord-Friendly · R+20
- County
- — inherits STATE
- City
- — inherits STATE
ZIP-level market 58601
- Rents YoY
- 1.9%
- Active inventory
- 235
- Price-to-rent
- 4.8×
Monthly cashflow live
- Estimated rent
- $1,088 medium interval (Pro) →
- Mortgage (P&I)
- −$330
- Tax est. 1.5%
- −$79 /mo · $944/yr
- Insurance
- −$26
- HOA
- −$0
- Vacancy / Maint / Mgmt
- −$228
- Net cashflow
- $425
Break-even live
UW: 25.0% down · 7.5% · 30yr · 1.5% tax · 5.0% vac · 8.0% maint · 8.0% mgmt
Financing live
Cash to close
- Down payment
- $15,725
- Closing costs
- $1,887
- Reserves months
- —
- Total cash needed
- —
Loan-product check · same deal, 3 products live
Conventional
25% down · 7.5% · 30yr
- Down + closing
- —
- Monthly P&I
- —
- Monthly cashflow
- —
- DSCR
- —
- Eligible?
- —
Personal DTI + credit; lowest rate.
DSCR
20% down · 8.5% · 30yr
- Down + closing
- —
- Monthly P&I
- —
- Monthly cashflow
- —
- DSCR
- —
- Eligible?
- —
No personal income docs; deal must DSCR.
Hard money
10% down · 12.0% · 12mo
- Down + closing
- —
- Monthly P&I
- —
- Monthly cashflow
- —
- DSCR
- —
- Eligible?
- —
Short-term bridge; refi at stabilization.
Listing history 41 events
-
2026-04-22status Pending
-
2025-08-25$62,900 Active
-
2025-06-30soldstatus Closed 123-char remark
Show marketing remark (171 chars)
Investment opportunity to own a rental! Start your portfolio with this well maintained unit. Condo fees are $175 per month. This is a ground floor unit with minimal steps.
-
2025-06-30soldstatus Closed 171-char remark
Show marketing remark (171 chars)
Investment opportunity to own a rental! Start your portfolio with this well maintained unit. Condo fees are $175 per month. This is a ground floor unit with minimal steps.
-
2025-06-30soldstatus Closed
Show marketing remark (171 chars)
Investment opportunity to own a rental! Start your portfolio with this well maintained unit. Condo fees are $175 per month. This is a ground floor unit with minimal steps.
-
2025-06-30soldstatus Closed
Show marketing remark (171 chars)
Investment opportunity to own a rental! Start your portfolio with this well maintained unit. Condo fees are $175 per month. This is a ground floor unit with minimal steps.
-
2025-04-07historical Active Under Contract 171-char remark
Show marketing remark (171 chars)
Investment opportunity to own a rental! Start your portfolio with this well maintained unit. Condo fees are $175 per month. This is a ground floor unit with minimal steps.
-
2024-11-14historical $750
-
2024-10-18price $750
-
2024-10-01soldstatus Closed
-
2024-08-28price $850
-
2024-08-15$74,500 Active 123-char remark
Show marketing remark (171 chars)
Investment opportunity to own a rental! Start your portfolio with this well maintained unit. Condo fees are $175 per month. This is a ground floor unit with minimal steps.
-
2024-08-15$72,500 Active 171-char remark
Show marketing remark (171 chars)
Investment opportunity to own a rental! Start your portfolio with this well maintained unit. Condo fees are $175 per month. This is a ground floor unit with minimal steps.
-
2024-08-08$950
-
2024-07-19$74,500 Active
-
2024-07-19$74,500 Active
-
2024-07-16soldstatus Closed
-
2024-07-15soldstatus Closed
-
2024-07-12status Active
-
2024-06-12$72,500 Active
-
2024-06-11$72,500 Active
-
2024-06-11$72,500 Active
-
2024-05-27soldstatus Closed
-
2024-04-29historical Active Under Contract
-
2024-04-24$74,900 Active
-
2024-01-25soldstatus Closed
-
2023-12-27price $66,000
-
2023-11-14soldstatus Closed
-
2023-10-13historical Active Under Contract
-
2023-09-06historical
-
2023-09-06historical
-
2023-09-06historical
-
2023-09-06historical
-
2023-09-06historical
-
2023-05-02$69,900 Active
-
2023-01-26$65,000 Active
-
2021-12-13$44,000
-
2020-06-02$40,000
-
2019-10-09$50,500
-
2019-10-09$50,500
-
2013-09-26$94,000
ⓘ Source: listings_history table (triggers on properties + properties_extension) + one-shot
backfill from property_details.listing_events for pre-trigger history.
Nearby sold comps map
Loading sold comps map…
Walkable amenities ~0.75 mi
Loading nearby amenities…
Taxation est. · year 1
- Rental income
- $13,057
- − Mortgage interest
- −$3,523
- − Property taxes
- −$944
- − Insurance
- −$314
- − Repairs & maintenance
- −$1,045
- − Management
- −$1,045
- − Depreciation
- −$1,830
- Taxable income
- $4,356
- Est. tax owed @ 24.0%
- −$1,046
- After-tax cash flow
- $4,053/yr
For passive investors: Depreciation is non-cash, so a rental often shows a tax loss while cash-flowing — sheltering income. Rental losses are passive: they offset passive income freely, and up to $25,000/yr can offset ordinary (W-2) income if you actively participate and your MAGI is under $100k (phasing out to $0 by $150k); unused losses carry forward. On sale, claimed depreciation is recaptured at up to 25%, and gains may owe capital-gains tax (a 1031 exchange can defer both). Figures are a year-1 estimate at your 24.0% rate — not tax advice; consult a CPA.
Schools (NCES district)
- District
- Dickinson 1
- NCES district ID
- 3800038
- Math proficiency
- 35% ▼ -12.00%
- Reading proficiency
- 43% ▼ -7.00%
- Median HH income
- $63,270
- Composite
- 34.9/100
- National rank
- #5080
- State rank
- #29 of 53 in ND
Livability — Dickinson
- Score
- 76/100
- State rank
- #12
- US rank
- #3334
Category grades
Schools grade is shown separately in the Schools card above.
Census & demographics
- Census place
- Dickinson, ND
- County
- Stark County · 29,916 people
- City population
- 29,916
- Metro
- Dickinson, ND
- Population (ZIP)
- 29,916
- Household income
- $85,821
- Rent vs Own
- Severe rent burden
- 813.0
Population outlook (Stark County) Hauer SSP2
- Today (2025)
- 50,426 people
- By 2030
- 60,812 · +20.6%
- By 2040
- 84,155 · +66.9%
- By 2050
- 110,718 · +119.6%
- By 2075
- 186,710 · +270.3%
- By 2100
- 264,902 · +425.3%
Race, ethnicity, and origin ACS 2023
- Neighborhood character
- Predominantly White (85%)
- Race & ethnicity
- White 85% Hispanic / Latino 7% Two or more races 5% Black 3% Asian 1%
- Hispanic origin (detail)
- Mexican 5%
- Common ancestry
- Portuguese 9% Scotch-Irish 2% Lithuanian 2%
- Foreign-born
- 4% · Canada, China
- Languages at home
- 92% English-only · Spanish 4% German/W. Germanic 1% Arabic 1%
Political lean MEDSL · Stark
- 2024 margin
- Solid R (+65.6) · D 16.5% · R 82.1% · Other 1.5%
- 2008→2024 swing
- -36.5pp toward R · 2008: -29.1pp · 2024: -65.6pp
- All cycles
- 2024: R+65.6 2020: R+63.9 2016: R+65.8 2012: R+49.4 2008: R+29.1
Not yet ingested
- Civics
- —
Market trends
- HPI YoY
- ▼ -133.57%
- Current HPI
- 188.1029
- Rent YoY
- ▲ 1.95%
- Metro
- Dickinson, ND
- State GDP YoY
- ▲ 2.09%
- F500 in state
- 2
Industry mix (Fortune 500 HQ in ND)
| Industry | F500 HQs | Revenue |
|---|---|---|
| Utilities / Construction | 1 | $6B |
|
||
Price history
-33.1% since first listed41 events — show timeline
- 2026-04-22 Pending — Badlands BOR MLS
- 2025-08-25 Listed $62,900 Badlands BOR MLS
- 2025-06-30 Sold (MLS) — Badlands BOR MLS
- 2025-06-30 Sold (MLS) — Badlands BOR MLS
- 2025-06-30 Sold (MLS) — Badlands BOR MLS
- 2025-06-30 Sold (MLS) — Badlands BOR MLS
- 2025-04-07 Contingent — Badlands BOR MLS
- 2024-11-14 Rental Removed $750 APPFOLIO
- 2024-10-18 Price Changed $750 APPFOLIO
- 2024-10-01 Sold (MLS) — Badlands BOR MLS
- 2024-08-28 Price Changed $850 APPFOLIO
- 2024-08-15 Listed $72,500 Badlands BOR MLS
- 2024-08-15 Listed $74,500 Badlands BOR MLS
- 2024-08-08 Listed for Rent $950 APPFOLIO
- 2024-07-19 Listed $74,500 Badlands BOR MLS
- 2024-07-19 Listed $74,500 Badlands BOR MLS
- 2024-07-16 Sold (MLS) — Badlands BOR MLS
- 2024-07-15 Sold (MLS) — Badlands BOR MLS
- 2024-07-12 Relisted — Badlands BOR MLS
- 2024-06-12 Listed $72,500 Badlands BOR MLS
- 2024-06-11 Listed $72,500 Badlands BOR MLS
- 2024-06-11 Listed $72,500 Badlands BOR MLS
- 2024-05-27 Sold (MLS) — Badlands BOR MLS
- 2024-04-29 Contingent — Badlands BOR MLS
- 2024-04-24 Listed $74,900 Badlands BOR MLS
- 2024-01-25 Sold (MLS) — Badlands BOR MLS
- 2023-12-27 Price Changed $66,000 Badlands BOR MLS
- 2023-11-14 Sold (MLS) — Badlands BOR MLS
- 2023-10-13 Contingent — Badlands BOR MLS
- 2023-09-06 Delisted — Badlands BOR MLS
- 2023-09-06 Delisted — Badlands BOR MLS
- 2023-09-06 Delisted — Badlands BOR MLS
- 2023-09-06 Delisted — Badlands BOR MLS
- 2023-09-06 Delisted — Badlands BOR MLS
- 2023-05-02 Listed $69,900 Badlands BOR MLS
- 2023-01-26 Listed $65,000 Badlands BOR MLS
- 2021-12-13 Listed $44,000 Badlands BOR MLS
- 2020-06-02 Listed $40,000 Badlands BOR MLS
- 2019-10-09 Listed $50,500 Badlands BOR MLS
- 2019-10-09 Listed $50,500 Badlands BOR MLS
- 2013-09-26 Listed $94,000 Badlands BOR MLS
Cash-flow waterfall
monthlySold comps — $/sqft
last 12 mo · ≤1 miLoading sold comps…