 Triplex
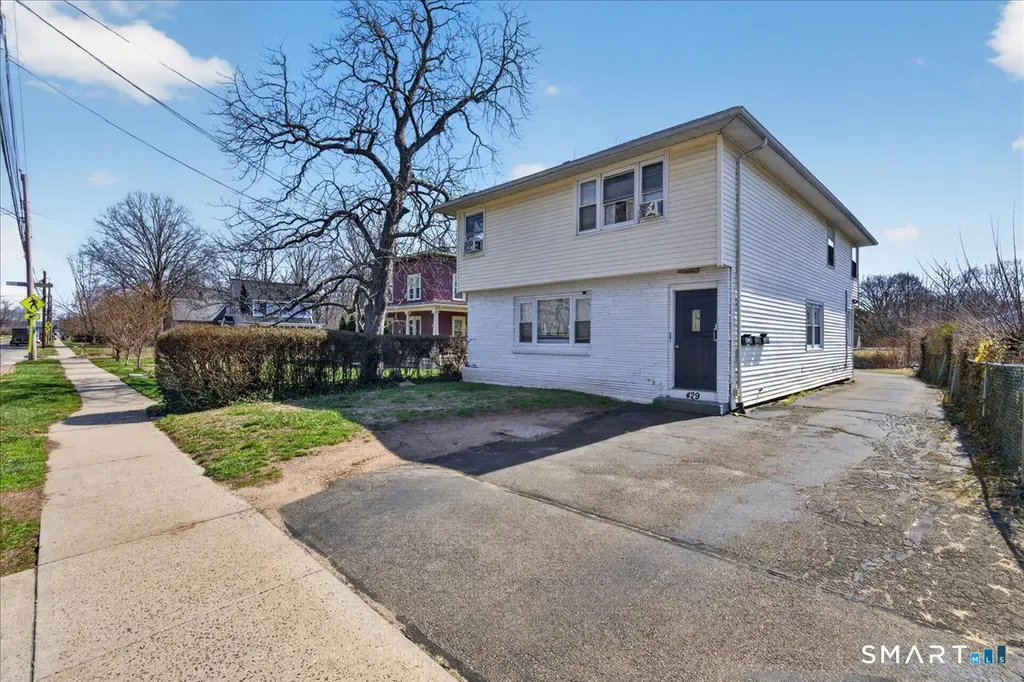
429 Thompson Ave · East Haven, CT
Flood risk 1/10 · Minimal
- FEMA flood zone
- X (unshaded)
- Chance of flooding over 30 yrs
- 0.0%
- Est. flood insurance / yr
- $473 – $860
Fire risk 1/10 · Minimal
- Est. fire insurance / yr
- $829 – $1,539
Heat risk 7/10 · Major
- Hot days now (above 95°F)
- 7 days/yr
- Hot days in 30 yrs
- 16 days/yr
Wind risk 6/10 · Moderate
- Chance of severe wind over 30 yrs
- 62.0%
Air-quality risk 5/10 · Moderate
- Unhealthy air days now
- 6 days/yr
- Unhealthy air days in 30 yrs
- 8 days/yr
Risk factors via First Street. Map © Google.
Why this score? — see what drove the B- grade
The composite is a weighted blend of 9 inputs, each scored 0–100. Each bar is that input's sub-score; the figure is the points it added to the 100-point composite (weight × sub-score).
- Cash flow +30.0/30.0
- 1% rule +10.0/10.0
- DSCR +10.0/10.0
- ARV discount +5.0/15.0
- Livability +3.5/5.0
- Schools +2.9/10.0
- Rent growth +2.7/5.0
- Condition / age +2.5/5.0
- Appreciation +0.0/10.0
$489,000
🖨 Deal sheet (PDF) 📄 Offer letter ✓ Due diligence
Multi-family units
County records classify this as Multi-Family (2-4 Unit). Listing-text estimate: 3 units. confirmed
Listing remarks
Welcome to 429 Thompson Avenue, an exceptional investment opportunity or owner-occupant residence perfectly situated just steps from the vibrant Town Green and Main Street. This well maintained three-family property offers a prime central location and high-end mechanical upgrades. The building has premium Viessmann heating and new Navien instant hot water systems, ensuring maximum efficiency and comfort for all tenants. Additionally, the roof is approximately only eight years old, providing long-term peace of mind and reducing future capital expenditures. The property features a versatile layout consisting of one expansive unit on the first floor and two efficient units on the second floor.
Key facts
- Versatile layout
- Large level backyard
- Private outdoor area
Tags
Property features AI
Finance
- Other: Living area recorded as 2004 (per public record); Property listed for sale as multi-family
Exterior
- Parking: Parking for 6 vehicles; Driveway parking
- Utilities: Public water connected; Public sewer connected; Natural gas hot water (tankless); Natural gas service for heating
- Home design: Multi-family property (3-family); Multi-story; Yellow exterior
- Construction: Built with frame, brick and concrete; Concrete foundation; Asphalt shingle roof; Vinyl siding
- Exterior features: Level lot; Private paved driveway; Paved surfaces
Interior
- Bedrooms: 4 bedrooms
- Bathrooms: 3 full bathrooms
- Heating & cooling: Hot water heat system; Natural gas fuel
- Interior features: 8 total rooms; Partial, unfinished basement with hatchway access and concrete floor; Attic accessible via hatch
- Laundry & utility: Tankless natural gas hot water
Neighborhood map
What this means for you Summary
Snapshot
- This is a 3 × 4-bed/3.0-bath units multifamily listed at $489k.
Deal economics
- At list price, monthly cash flow is $3k ($36k/yr) — positive. Per door: $1k/mo.
- The deal already cash-flows at list — no discount required.
- Meets the 1% rule at list price ($8k rent vs $489k).
- Recommended offer: $482k (1.5% below list) — sets the bar for market timing.
- Cap rate 13.7% vs local median 3.9% in East Haven — top-decile yield for the area; either an underpriced asset or a hidden risk that comps aren't pricing in. Stress-test before assuming the spread holds.
Location & tenants
- Location reads 70/100 on livability (#99 in CT) — a middle-class / working-renter tenant base. Strengths: housing A+, crime A-, health & safety B+; Watch: amenities F, commute F.
- East Haven School District (suburban): math 25% / reading 40% proficiency, ranked #118 of 153 in CT (top 77%) — families likely to look elsewhere, expect single-tenant / working-renter base with shorter leases.
- Zoned schools: Carbone School/East Haven Academy (math 30% / reading 53%, grade F, #294 of 553 statewide, top 53%, 333 students, 38% FRL); Joseph Melillo Middle School (math 23% / reading 36%, grade F, #140 of 175 statewide, top 81%, 516 students, 59% FRL); East Haven High School (math 17% / reading 42%, grade F, #139 of 194 statewide, top 74%, 849 students, 47% FRL).
- Market conditions: Rents flat; 104 active listings in the ZIP; 9 comparable units currently listed for rent nearby; rentals at typical pace (median 23d on market — plan ~3-4 weeks tenant-placement turnaround); 44% of comp listings sitting > 30 days — soft ceiling on asking rent; solid renter incomes; 1,059 units permitted in South Central Connecticut Planning Region in 2024 (779 in 5+ unit buildings).
- At $7,855/mo this rent would consume 98% of the median local household income ($96k/yr) (locally 770% of renters already pay >50% of income on rent) — very limited rent-growth headroom before tenants either downsize or default.
Forward outlook
- Local home prices are declining (-3.0%/yr); year-one equity from $3k of loan paydown is wiped out by about $15k of value loss. Plan a longer hold.
- At projected returns (-3.0% appreciation + 0.8% rent growth), your $137k cash investment doubles in ~6 years — after that, you're playing with house money.
Negotiation context
- It's been on market 24 days — a 2% lower offer ($482k) is reasonable based on typical stale-listing flexibility.
- Current owner paid $140k; list at $489k implies a 249% gain — meaningful room to come down on a strong offer.
Risks & watch-outs
- Watch-outs: built in 1910 — expect roof / HVAC / electrical / plumbing capex.
- Climate carrying-cost: major wind risk, 62% chance of damaging wind over 30y; extreme-heat days projected 7→16/yr by 2055 (HVAC capex compounding) — expect insurance premiums to compound above CPI over the hold.
Questions for the listing agent
- Can we see the unit-by-unit rent roll, current vacancy, and any below-market leases? What's the average tenancy length?
- What capital expenditures (roof, boiler, parking lot, exteriors) have been made in the last 5 years, and what's planned in the next 2?
- Built in 1910 — when were the roof, HVAC, electrical panel, plumbing, and water heater last replaced?
- Is there a deadline driving the sale (1031 exchange, divorce, estate, relocation)? That informs how much negotiation room exists.
- Schools are D-rated, which usually means shorter tenancies and higher turnover. Who's the typical renter profile here, and what's been the actual vacancy rate?
- What's the average days-on-market for RENTAL listings here right now (not sales)? A rising rental-DOM trend means longer vacancies and softer asking-rent achievability than the comps imply.
- What's the recent tenant-quality profile in this submarket — average credit score on applications, eviction rate, late-payment / NSF rate, and stable-employment percentage? A property-management company in the area should have these aggregated.
- How much new apartment / multifamily construction is in the pipeline within 1–3 miles? Heavy new supply (>2% of stock underway) typically softens rents 12–24 months out; light construction supports rent growth.
Investment metrics
- 1% rule
- 1.61% ✓
- Cap rate
- 13.72%
- Cash-on-cash
- 26.54%
- DSCR
- 2.18
- GRM
- 5.2
CMA / ARV
- ARV (on-the-fly)
- $462,924
- Comps found
- 3
Show comp detail 3 sales within ~0.75 mi
| Address | Dist | Beds/Ba | Sqft | Sold | Price | $/sf | Match |
|---|---|---|---|---|---|---|---|
| 429 Thompson Ave | 0.00mi | 4/3.0 | 2,004 (0%) | 1mo | $480,000 | $240 | 99 |
| 60 Dodge Ave | 0.22mi | 3/2.0 (-1) | 1,990 (-1%) | 3mo | $405,000 | $204 | 77 |
| 73 Burr St | 0.59mi | 5/2.0 (+1) | 1,710 (-15%) | 15mo | $395,000 | $231 | 27 |
Match score weights: distance 35% · size 25% · config 20% · recency 20%. Top-matched comps best support the ARV.
Projected returns pro-forma
-3.0% appreciation · 0.79% rent growth · sell at horizon
- IRR
- 17.9%
- Equity multiple
- 1.70×
- Total profit
- $96,520
- Equity at exit
- $72,911
- IRR
- 24.8%
- Equity multiple
- 2.94×
- Total profit
- $265,268
- Equity at exit
- $42,280
Cash invested: $136,920 (down + closing). Projections, not guarantees.
Landlord ↔ Tenant lean methodology
- Overall (STATE)
- 27 Tenant-Leaning
- State Connecticut
- 27 Tenant-Leaning · D+7
- County
- — inherits STATE
- City
- — inherits STATE
ZIP-level market 06512
- Rents YoY
- 0.8%
- Active inventory
- 104
- Price-to-rent
- 15.6×
Monthly cashflow live
- Estimated rent
- $7,855 medium interval (Pro) →
- Mortgage (P&I)
- −$2,564
- Tax from tax record
- −$409 /mo · $4,912/yr
- Insurance
- −$204
- HOA
- −$0
- Vacancy / Maint / Mgmt
- −$1,650
- Net cashflow
- $3,028
Break-even live
Sensitivity live
| Price | -10% $3,305 | -5% $3,166 | +0% $3,028 | +5% $2,890 | +10% $2,751 |
|---|---|---|---|---|---|
| Rent | -10% $2,407 | -5% $2,718 | +0% $3,028 | +5% $3,338 | +10% $3,649 |
| Rate | -1.0pp $3,274 | -0.5pp $3,152 | base $3,028 | +0.5pp $2,901 | +1.0pp $2,772 |
3-unit breakdown (identical units grouped — click to expand)
| Units | Beds | Baths | Est. rent |
|---|---|---|---|
| 3× units | 4 | 3 | $7,854 |
| #1 | 4 | 3 | $2,618 |
| #2 | 4 | 3 | $2,618 |
| #3 | 4 | 3 | $2,618 |
| Total (3 units) | $7,855 | ||
UW: 25.0% down · 7.5% · 30yr · 1.5% tax · 5.0% vac · 8.0% maint · 8.0% mgmt
Financing live
Cash to close
- Down payment
- $122,250
- Closing costs
- $14,670
- Reserves months
- —
- Total cash needed
- —
Loan-product check · same deal, 3 products live
Conventional
25% down · 7.5% · 30yr
- Down + closing
- —
- Monthly P&I
- —
- Monthly cashflow
- —
- DSCR
- —
- Eligible?
- —
Personal DTI + credit; lowest rate.
DSCR
20% down · 8.5% · 30yr
- Down + closing
- —
- Monthly P&I
- —
- Monthly cashflow
- —
- DSCR
- —
- Eligible?
- —
No personal income docs; deal must DSCR.
Hard money
10% down · 12.0% · 12mo
- Down + closing
- —
- Monthly P&I
- —
- Monthly cashflow
- —
- DSCR
- —
- Eligible?
- —
Short-term bridge; refi at stabilization.
Rent comps 9 comps
| Address | Beds | Baths | Sqft | Rent | $/sqft | DOM | Units | Dist |
|---|---|---|---|---|---|---|---|---|
| 154 Hemingway Ave East Haven, CT | 3.0 | 2.0 | 1541 | $2,800 | $1.82 | 16d | 1 | 0.25mi |
| 420 Short Beach Rd East Haven, CT | 3.0 | 2.0 | 1500 | $2,200 | $1.47 | 45d | 1 | 0.63mi |
| 101 High St Unit 2 East Haven, CT | 4.0 | 1.0 | 1568 | $2,900 | $1.85 | 16d | 1 | 0.71mi |
| 25 Beecher Pl New Haven, CT | 3.0 | 1.5 | 1414 | $2,700 | $1.91 | 45d | 1 | 1.12mi |
| 356 Townsend Ave New Haven, CT | 3.0 | 2.0 | 1572 | $3,000 | $1.91 | 5d | 1 | 1.15mi |
| 114 Kneeland Rd New Haven, CT | 3.0 | 1.0 | 1800 | $2,900 | $1.61 | 45d | 1 | 1.19mi |
| 38 Hervey St New Haven, CT | 3.0 | 1.5 | 1450 | $3,400 | $2.34 | 23d | 1 | 1.19mi |
| 105 Hillside Ave New Haven, CT | 4.0 | 2.0 | 2080 | $3,500 | $1.68 | 12d | 1 | 1.21mi |
| 116 Townsend Ave New Haven, CT | 3.0 | 1.5 | 1932 | $3,500 | $1.81 | 45d | 1 | 1.21mi |
Listing history 4 events
-
2026-05-05status Under Contract
-
2026-04-16historical Under Contract - Continue to Show
-
2026-04-11$489,000 Active
-
1997-10-23soldstatus $140,000
ⓘ Source: listings_history table (triggers on properties + properties_extension) + one-shot
backfill from property_details.listing_events for pre-trigger history.
Tax reassessment forecast CT · Partial reset (capped growth)
- Current annual tax
- $4,912 · $409/mo
- Projected year-2 tax
- $7,688 · $641/mo
- Expected delta
- +$2,776/yr (+$231/mo · 56.5%)
ⓘ Screening estimate from a state-policy table — verify with the county assessor before closing.
Climate risk First Street
- Flood 1/10 Low FEMA zone X (unshaded) · 0% chance over 30 yrs
- Wildfire 1/10 Low
- Heat 7/10 Severe 7 d/yr ≥95°F today · 16 d/yr by 30 yrs out
- Wind 6/10 Major 62% chance of damaging wind over 30 yrs
- Air quality 5/10 Major 6 unhealthy d/yr today · 8 by 30 yrs out
Nearby sold comps map
Loading sold comps map…
Walkable amenities ~0.75 mi
Loading nearby amenities…
Taxation est. · year 1
- Rental income
- $94,260
- − Mortgage interest
- −$27,392
- − Property taxes
- −$4,912
- − Insurance
- −$2,445
- − Repairs & maintenance
- −$7,541
- − Management
- −$7,541
- − Depreciation
- −$14,225
- Taxable income
- $30,204
- Est. tax owed @ 24.0%
- −$7,249
- After-tax cash flow
- $29,087/yr
For passive investors: Depreciation is non-cash, so a rental often shows a tax loss while cash-flowing — sheltering income. Rental losses are passive: they offset passive income freely, and up to $25,000/yr can offset ordinary (W-2) income if you actively participate and your MAGI is under $100k (phasing out to $0 by $150k); unused losses carry forward. On sale, claimed depreciation is recaptured at up to 25%, and gains may owe capital-gains tax (a 1031 exchange can defer both). Figures are a year-1 estimate at your 24.0% rate — not tax advice; consult a CPA.
Schools (NCES district)
- District
- East Haven School District
- NCES district ID
- 0901290
- Math proficiency
- 25% ▼ -7.00%
- Reading proficiency
- 40% ▼ -7.00%
- Median HH income
- $61,869
- Composite
- 29.35/100
- National rank
- #6534
- State rank
- #118 of 153 in CT
Livability — East Haven
- Score
- 70/100
- State rank
- #99
- US rank
- #7805
Category grades
Schools grade is shown separately in the Schools card above.
Census & demographics
- Census place
- East Haven, CT
- County
- New Haven County · 688,236 people
- City population
- 28,830
- Metro
- New Haven-Milford, CT
- Population (ZIP)
- 28,830
- Household income
- $96,146
- Rent vs Own
- Severe rent burden
- 770.0
Population outlook (South Central Connecticut County) Hauer SSP2
- By 2040
- 608,362
Race, ethnicity, and origin ACS 2023
- Neighborhood character
- Predominantly White (68%)
- Race & ethnicity
- White 68% Hispanic / Latino 19% Two or more races 9% Black 6% Asian 3%
- Hispanic origin (detail)
- Mexican 1% Puerto Rican 8%
- Common ancestry
- Romanian 5% Lithuanian 2% Russian 1%
- Foreign-born
- 12% · Canada, China, Jamaica
- Languages at home
- 81% English-only · Spanish 12% Other Indo-European 3% Other Asian/Pacific 1%
Political lean MEDSL · South Central Connecticut
- 2024 margin
- Strong D (+20.1) · D 59.0% · R 38.9% · Other 2.1%
- All cycles
- 2024: D+20.1
Not yet ingested
- Civics
- —
Market trends
- HPI YoY
- ▼ -302.63%
- Current HPI
- 302.2679
- Rent YoY
- ▲ 0.79%
- Metro
- New Haven-Milford, CT
- State GDP YoY
- ▲ 1.06%
- F500 in state
- 38
Industry mix (Fortune 500 HQ in CT)
| Industry | F500 HQs | Revenue |
|---|---|---|
| Industrial Machinery | 4 | $38B |
|
||
| Insurance | 3 | $71B |
|
||
| Financial Services | 2 | $25B |
|
||
| Transportation / Logistics | 2 | $18B |
|
||
| Healthcare | 1 | $247B |
|
||
| Telecommunications | 1 | $55B |
|
||
Price history
+249.3% since first listed4 events — show timeline
- 2026-05-05 Pending — Smart MLS
- 2026-04-16 Contingent — Smart MLS
- 2026-04-11 Listed $489,000 Smart MLS
- 1997-10-23 Sold (Public Records) $140,000 Public Records
Property tax history
+0.7%/yrLatest (2023): $4,912 · +0.0% YoY. Source: county tax records.
Cash-flow waterfall
monthlySold comps — $/sqft
last 12 mo · ≤1 miLoading sold comps…