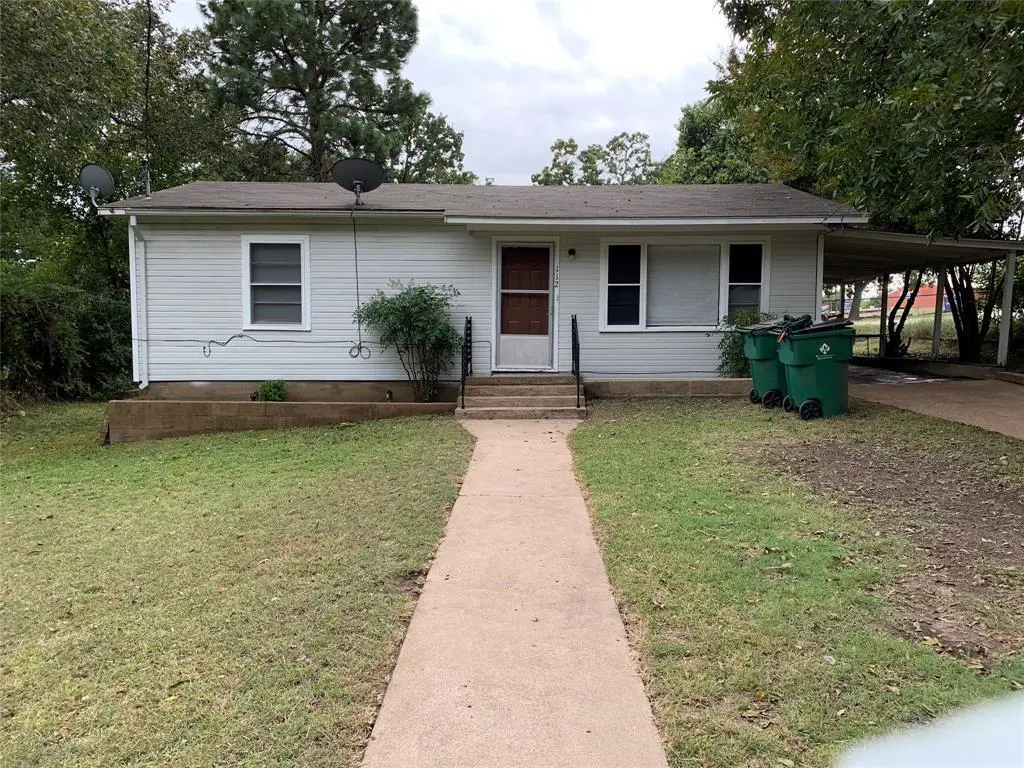
112 E Hill St · Hamilton, TX
Flood risk 1/10 · Minimal
- FEMA flood zone
- —
- Chance of flooding over 30 yrs
- 0.0%
- Est. flood insurance / yr
- —
Fire risk 7/10 · Major
- Est. fire insurance / yr
- $1,222 – $2,270
Heat risk 6/10 · Moderate
- Hot days now (above threshold)
- 7 days/yr
- Hot days in 30 yrs
- 22 days/yr
Wind risk No data
- Chance of severe wind over 30 yrs
- —
Air-quality risk 1/10 · Minimal
- Unhealthy air days now
- 0 days/yr
- Unhealthy air days in 30 yrs
- 0 days/yr
Risk factors via First Street. Map © Google.
Why this score? — see what drove the A grade
The composite is a weighted blend of 9 inputs, each scored 0–100. Each bar is that input's sub-score; the figure is the points it added to the 100-point composite (weight × sub-score).
- Cash flow +30.0/30.0
- ARV discount +15.0/15.0
- DSCR +10.0/10.0
- Appreciation +10.0/10.0
- 1% rule +9.2/10.0
- Schools +4.2/10.0
- Livability +3.7/5.0
- Rent growth +2.5/5.0
- Condition / age +2.5/5.0
$75,000
🖨 Deal sheet 📄 Offer letter ✓ Due diligence
Listing remarks
Charming 2 bed 1 bath home. Located in the heart of Hamilton and conveniently close to schools and a park. This home features an eating bar, overlooking the kitchen with an open concept design opening up into the living room, which makes each space easily accessible. Other features include, custom tile shower, utility room, carport and fencing around the perimeter of the home. MOTIVATED SELLER
Key facts
- Utility room
- Carport
- Open concept design
Tags
Property features AI
Finance
- Other: Exclusions: personal items, washer/dryer
- Financial info: Listing accepts Cash and Conventional offers; Second mortgage: none
- HOA & community: No HOA / association
Exterior
- Parking: Carport (1 covered space); Driveway; On-street parking
- Utilities: City water; City sewer; Electricity available; Natural gas available; Not in a municipal utility district
- Home design: Single family residence; One story; Residential property
- Construction: Built in 1960
- Exterior features: Lot under 0.5 acre (approximately 0.17 acre)
Interior
- Kitchen: Dishwasher; Gas range; Refrigerator; Electric water heater
- Bedrooms: 2 bedrooms (primary bedroom on main level)
- Bathrooms: 1 full bathroom
- Interior features: Eat-in kitchen; One living area; One dining area; Room count: 2
- Laundry & utility: Washer and dryer excluded from sale (seller's personal items)
Neighborhood map
What this means for you Summary
Snapshot
- This is a 2-bed/1.0-bath single-family listed at $75k.
Deal economics
- At list price, monthly cash flow is $323 ($4k/yr) — positive.
- The deal already cash-flows at list — no discount required.
- Meets the 1% rule at list price ($1k rent vs $75k).
- Recommended offer: $73k (3.0% below list) — sets the bar for market timing.
- Cap rate 11.5% vs local median 2.9% in Hamilton — top-decile yield for the area; either an underpriced asset or a hidden risk that comps aren't pricing in. Stress-test before assuming the spread holds.
Location & tenants
- Location reads 73/100 on livability (#210 in TX) — a middle-class / working-renter tenant base. Strengths: cost of living A+, housing A+, health & safety A+; Watch: employment D, amenities F, commute F.
- Hamilton ISD (town): math 50% / reading 50% proficiency, ranked #192 of 826 in TX (top 23%) — acceptable for families but not a draw, mixed tenant base, ~2y average lease.
- Zoned schools: Ann Whitney El (math 42% / reading 42%, grade F, #1,335 of 4,322 statewide, top 33%, 397 students, 60% FRL).
- Market conditions: 117 active listings in the ZIP; 24 units permitted in Hamilton County in 2024 (0 in 5+ unit buildings).
Forward outlook
- In year one you build about $8k of equity ($519 loan paydown + $8k appreciation (10.0% local appreciation)).
- Hamilton County population projected at -21% by 2050 — secular population decline; favor cash flow + early exit over multi-decade hold.
- At projected returns (10.0% appreciation + 3.0% rent growth), your $21k cash investment doubles in ~2 years — after that, you're playing with house money.
- By year 5, paydown + projected appreciation supports a ~$37k cash-out refi (75% LTV) — recoverable capital for the next deal without selling this one.
Negotiation context
- It's been on market 43 days — a 3% lower offer ($73k) is reasonable based on typical stale-listing flexibility.
Risks & watch-outs
- Climate carrying-cost: major wildfire risk; extreme-heat days projected 7→22/yr by 2055 (HVAC capex compounding) — expect insurance premiums to compound above CPI over the hold.
Questions for the listing agent
- It's been on market 43 days. Have you received any prior offers? Is the seller open to a 3% concession, seller financing, or rate buy-down credit?
- Built in 1960 — when were the roof, HVAC, electrical panel, plumbing, and water heater last replaced?
- Is there a deadline driving the sale (1031 exchange, divorce, estate, relocation)? That informs how much negotiation room exists.
- What's the average days-on-market for RENTAL listings here right now (not sales)? A rising rental-DOM trend means longer vacancies and softer asking-rent achievability than the comps imply.
- What's the recent tenant-quality profile in this submarket — average credit score on applications, eviction rate, late-payment / NSF rate, and stable-employment percentage? A property-management company in the area should have these aggregated.
- How much new for-sale + rental construction is in the pipeline within 1–3 miles? Heavy new supply typically softens prices + rents 12–24 months out; constrained supply supports both.
Investment metrics
- 1% rule
- 1.42% ✓
- Cap rate
- 11.46%
- Cash-on-cash
- 18.47%
- DSCR
- 1.82
- GRM
- 5.9
CMA / ARV
- ARV (median comp)
- $90,789
- List price
- $75,000
- Delta
- -17.39%
- Verdict
- UNDERPRICED
- Comps
- 8 within 1.0 mi
Show comp detail 2 sales within ~0.75 mi
| Address | Dist | Beds/Ba | Sqft | Sold | Price | $/sf | Match |
|---|---|---|---|---|---|---|---|
| 400 S Pecan St | 0.27mi | 2/1.0 | 768 (+2%) | 3mo | $70,000 | $91 | 82 |
| 409 E Standifer St Unit Q | 0.24mi | 1/1.0 (-1) | 720 (-5%) | 16mo | $95,000 | $132 | 62 |
Match score weights: distance 35% · size 25% · config 20% · recency 20%. Top-matched comps best support the ARV.
Projected returns pro-forma
10.0% appreciation · 3.0% rent growth · sell at horizon
- IRR
- 38.0%
- Equity multiple
- 3.93×
- Total profit
- $61,450
- Equity at exit
- $67,566
- IRR
- 32.7%
- Equity multiple
- 8.85×
- Total profit
- $164,807
- Equity at exit
- $145,709
Cash invested: $21,000 (down + closing). Projections, not guarantees.
Landlord ↔ Tenant lean methodology
- Overall (STATE)
- 87 Strongly Landlord-Friendly
- State Texas
- 87 Strongly Landlord-Friendly · R+5
- County
- — inherits STATE
- City
- — inherits STATE
ZIP-level market 76531
- Home prices YoY
- 17.5%
- Active inventory
- 117
- Price-to-rent
- 5.9×
Monthly cashflow live
- Estimated rent
- $1,067 medium interval (Pro) →
- Mortgage (P&I)
- −$393
- Tax from tax record
- −$95 /mo · $1,145/yr
- Insurance
- −$31
- HOA
- −$0
- Vacancy / Maint / Mgmt
- −$224
- Net cashflow
- $323
Break-even live
UW: 25.0% down · 7.5% · 30yr · 1.5% tax · 5.0% vac · 8.0% maint · 8.0% mgmt
Financing live
Cash to close
- Down payment
- $18,750
- Closing costs
- $2,250
- Reserves months
- —
- Total cash needed
- —
Loan-product check · same deal, 3 products live
Conventional
25% down · 7.5% · 30yr
- Down + closing
- —
- Monthly P&I
- —
- Monthly cashflow
- —
- DSCR
- —
- Eligible?
- —
Personal DTI + credit; lowest rate.
DSCR
20% down · 8.5% · 30yr
- Down + closing
- —
- Monthly P&I
- —
- Monthly cashflow
- —
- DSCR
- —
- Eligible?
- —
No personal income docs; deal must DSCR.
Hard money
10% down · 12.0% · 12mo
- Down + closing
- —
- Monthly P&I
- —
- Monthly cashflow
- —
- DSCR
- —
- Eligible?
- —
Short-term bridge; refi at stabilization.
Listing history 10 events
-
2026-06-08status $75,000 Pending 43 DOM
-
2026-06-05days on market $75,000 Active 43 DOM
-
2026-06-03days on market $75,000 Active 41 DOM
-
2026-06-02days on market $75,000 Active 40 DOM
-
2026-06-01days on market $75,000 Active 39 DOM
-
2026-05-31pricedays on market $75,000 Active 38 DOM
-
2026-05-09price $100,000 396-char remark
-
2026-04-22$110,000 Active 396-char remark
-
2017-04-12soldstatus
-
1998-11-20soldstatus
ⓘ Source: listings_history table (triggers on properties + properties_extension) + one-shot
backfill from property_details.listing_events for pre-trigger history.
Tax reassessment forecast TX · Resets to sale price
- Current annual tax
- $1,145 · $95/mo
- Projected year-2 tax
- $1,372 · $114/mo
- Expected delta
- +$228/yr (+$19/mo · 19.9%)
ⓘ Screening estimate from a state-policy table — verify with the county assessor before closing.
Climate risk First Street
- Flood 1/10 Low 0% chance over 30 yrs
- Wildfire 7/10 Severe
- Heat 6/10 Major
- Air quality 1/10 Low 0 unhealthy d/yr today · 0 by 30 yrs out
Nearby sold comps map
Loading sold comps map…
Walkable amenities ~0.75 mi
Loading nearby amenities…
Taxation est. · year 1
- Rental income
- $12,808
- − Mortgage interest
- −$4,201
- − Property taxes
- −$1,145
- − Insurance
- −$375
- − Repairs & maintenance
- −$1,025
- − Management
- −$1,025
- − Depreciation
- −$2,182
- Taxable income
- $2,856
- Est. tax owed @ 24.0%
- −$685
- After-tax cash flow
- $3,193/yr
For passive investors: Depreciation is non-cash, so a rental often shows a tax loss while cash-flowing — sheltering income. Rental losses are passive: they offset passive income freely, and up to $25,000/yr can offset ordinary (W-2) income if you actively participate and your MAGI is under $100k (phasing out to $0 by $150k); unused losses carry forward. On sale, claimed depreciation is recaptured at up to 25%, and gains may owe capital-gains tax (a 1031 exchange can defer both). Figures are a year-1 estimate at your 24.0% rate — not tax advice; consult a CPA.
Schools (NCES district)
- District
- Hamilton ISD
- NCES district ID
- 4822230
- Math proficiency
- 50% ▲ 1.00%
- Reading proficiency
- 50% ▼ -1.00%
- Median HH income
- $43,597
- Composite
- 42.18/100
- National rank
- #3293
- State rank
- #192 of 826 in TX
Livability — Hamilton
- Score
- 73/100
- State rank
- #210
- US rank
- #5259
Category grades
Schools grade is shown separately in the Schools card above.
Census & demographics
- Census place
- Hamilton, TX
- Population (ZIP)
- 4,673
Population outlook (Hamilton County) Hauer SSP2
- Today (2025)
- 7,553 people
- By 2030
- 7,212 · -4.5%
- By 2040
- 6,566 · -13.1%
- By 2050
- 5,976 · -20.9%
- By 2075
- 5,077 · -32.8%
- By 2100
- 4,196 · -44.4%
Race, ethnicity, and origin ACS 2023
- Neighborhood character
- Predominantly White (84%)
- Race & ethnicity
- White 84% Hispanic / Latino 13% Two or more races 11% Black 1%
- Hispanic origin (detail)
- Mexican 12%
- Common ancestry
- Italian 9% Lithuanian 3% Slovak 2%
- Foreign-born
- 5% · Canada
- Languages at home
- 90% English-only · Spanish 9% Russian/Polish/Slavic 1%
Political lean MEDSL · Hamilton
- 2024 margin
- Solid R (+71.3) · D 14.0% · R 85.3%
- 2008→2024 swing
- -18.0pp toward R · 2008: -53.3pp · 2024: -71.3pp
- All cycles
- 2024: R+71.3 2020: R+68.4 2016: R+71.4 2012: R+65.5 2008: R+53.3
Not yet ingested
- Civics
- —
Market trends
- HPI YoY
- ▲ 33.83%
- Current HPI
- 226.8273
- Rent YoY
- —
- Metro
- —
- State GDP YoY
- ▲ 3.95%
- F500 in state
- 110
Industry mix (Fortune 500 HQ in TX)
| Industry | F500 HQs | Revenue |
|---|---|---|
| Energy | 16 | $1,198B |
|
||
| Technology | 5 | $198B |
|
||
| Engineering / Construction | 4 | $72B |
|
||
| Energy Services | 3 | $60B |
|
||
| Utilities | 3 | $41B |
|
||
| Healthcare | 2 | $330B |
|
||
Price history
-31.8% since first listed6 events — show timeline
- 2026-06-05 Pending — NTREIS
- 2026-05-31 Price Changed $75,000 NTREIS
- 2026-05-09 Price Changed $100,000 NTREIS
- 2026-04-22 Listed $110,000 NTREIS
- 2017-04-12 Sold (Public Records) — Public Records
- 1998-11-20 Sold (Public Records) — Public Records
Property tax history
+4.2%/yrLatest (2025): $1,145 · +12.8% YoY. Source: county tax records.
Cash-flow waterfall
monthlySold comps — $/sqft
last 12 mo · ≤1 miLoading sold comps…