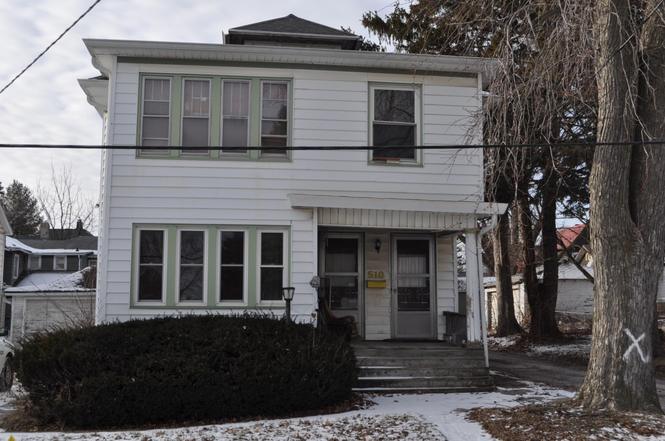
510-512 N Brick Ave · Freeport, IL
Flood risk 1/10 · Minimal
- FEMA flood zone
- X (unshaded)
- Chance of flooding over 30 yrs
- 0.0%
- Est. flood insurance / yr
- $507 – $1,088
Fire risk 1/10 · Minimal
- Est. fire insurance / yr
- $804 – $1,492
Heat risk 3/10 · Minor
- Hot days now (above 101°F)
- 7 days/yr
- Hot days in 30 yrs
- 15 days/yr
Wind risk 2/10 · Minimal
- Chance of severe wind over 30 yrs
- —
Air-quality risk 2/10 · Minimal
- Unhealthy air days now
- 1 days/yr
- Unhealthy air days in 30 yrs
- 2 days/yr
Risk factors via First Street. Map © Google.
Why this score? — see what drove the B grade
The composite is a weighted blend of 9 inputs, each scored 0–100. Each bar is that input's sub-score; the figure is the points it added to the 100-point composite (weight × sub-score).
- Cash flow +30.0/30.0
- ARV discount +15.0/15.0
- 1% rule +10.0/10.0
- DSCR +10.0/10.0
- Livability +3.6/5.0
- Rent growth +2.5/5.0
- Condition / age +2.5/5.0
- Schools +1.0/10.0
- Appreciation +0.0/10.0
$61,900
🖨 Deal sheet (PDF) 📄 Offer letter ✓ Due diligence
Listing remarks MLS
This 2 Story house with 4 bedrooms, 2 Full baths. Large Living room, Dining Room, Kitchen and main floor laundry. Full bath up stairs. 2 stall garage with storage shed. Extra 1 stall garage shared with the neighbor. Shared drive way. Plenty of storage.
Key facts
- 5,227 sq ft lot
- 3 garage spots
- Built 1900
Neighborhood map
What this means for you Summary
Snapshot
- This is a 4-bed/2.0-bath single-family listed at $62k.
Deal economics
- At list price, monthly cash flow is $710 ($9k/yr) — positive.
- The deal already cash-flows at list — no discount required.
- Meets the 1% rule at list price ($1k rent vs $62k).
- Recommended offer: $58k (6.0% below list) — sets the bar for market timing.
- Cap rate 20.1% vs local median 5.8% in Freeport — top-decile yield for the area; either an underpriced asset or a hidden risk that comps aren't pricing in. Stress-test before assuming the spread holds.
Location & tenants
- Location reads 72/100 on livability (#302 in IL) — a middle-class / working-renter tenant base. Strengths: cost of living A+, health & safety A+, housing A-; Watch: schools F, commute F, employment F.
- Freeport SD 145 (town): math 11% / reading 12% proficiency, ranked #565 of 620 in IL (top 91%) — low school quality limits family demand, transient renter base, plan for 1-2y turnover; 65% free/reduced lunch — lower-income household profile, screen leases tightly.
- Market conditions: 206 active listings in the ZIP; 5 comparable units currently listed for rent nearby; rentals lingering (median 45d on market — plan ~5-8 weeks vacancy on turnover, expect pricing pressure); 80% of comp listings sitting > 30 days — soft ceiling on asking rent; 7 units permitted in Stephenson County in 2024 (0 in 5+ unit buildings).
Forward outlook
- Local home prices are declining (-3.0%/yr); year-one equity from $428 of loan paydown is wiped out by about $2k of value loss. Plan a longer hold.
- Stephenson County population projected at -29% by 2050 — secular population decline; favor cash flow + early exit over multi-decade hold.
- At projected returns (-3.0% appreciation + 3.0% rent growth), your $17k cash investment doubles in ~3 years — after that, you're playing with house money.
Negotiation context
- It's been on market 81 days — a 6% lower offer ($58k) is reasonable based on typical stale-listing flexibility.
- 3 sale attempts since 3y ago with the ask held roughly flat each time — persistent listings suggest the price (not the market) is what's stuck; bring a comps-based counter.
Risks & watch-outs
- Watch-outs: built in 1900 — expect roof / HVAC / electrical / plumbing capex.
Questions for the listing agent
- It's been on market 81 days. Have you received any prior offers? Is the seller open to a 6% concession, seller financing, or rate buy-down credit?
- Built in 1900 — when were the roof, HVAC, electrical panel, plumbing, and water heater last replaced?
- Why hasn't it sold? Are there any deal-killer items the seller is aware of (foundation, flood, title, zoning, code violations)?
- Is there a deadline driving the sale (1031 exchange, divorce, estate, relocation)? That informs how much negotiation room exists.
- Schools are F-rated, which usually means shorter tenancies and higher turnover. Who's the typical renter profile here, and what's been the actual vacancy rate?
- What's the average days-on-market for RENTAL listings here right now (not sales)? A rising rental-DOM trend means longer vacancies and softer asking-rent achievability than the comps imply.
- What's the recent tenant-quality profile in this submarket — average credit score on applications, eviction rate, late-payment / NSF rate, and stable-employment percentage? A property-management company in the area should have these aggregated.
- How much new for-sale + rental construction is in the pipeline within 1–3 miles? Heavy new supply typically softens prices + rents 12–24 months out; constrained supply supports both.
Investment metrics
- 1% rule
- 2.33% ✓
- Cap rate
- 20.05%
- Cash-on-cash
- 49.14%
- DSCR
- 3.19
- GRM
- 3.6
CMA / ARV
- ARV (on-the-fly)
- $111,418
- Comps found
- 12
Show comp detail 12 sales within ~0.75 mi
| Address | Dist | Beds/Ba | Sqft | Sold | Price | $/sf | Match |
|---|---|---|---|---|---|---|---|
| 510-512 N Brick Ave | 0.00mi | 4/2.0 | 1,921 (0%) | 0mo | $25,000 | $13 | 100 |
| 427 N Nursery Ave | 0.09mi | 5/2.0 (+1) | 1,885 (-2%) | 12mo | $43,000 | $23 | 77 |
| 445 N Nursery Ave | 0.06mi | 4/1.5 | 1,712 (-11%) | 11mo | $91,500 | $53 | 68 |
| 503 W Cottonwood St | 0.16mi | 4/1.5 | 1,764 (-8%) | 12mo | $85,000 | $48 | 67 |
| 933 W Stephenson St | 0.59mi | 3/2.0 (-1) | 1,994 (+4%) | 5mo | $165,000 | $83 | 57 |
| 834 W Lincoln Blvd | 0.54mi | 4/2.0 | 2,058 (+7%) | 11mo | $138,000 | $67 | 53 |
| 239 N Fairview Ave | 0.54mi | 3/2.0 (-1) | 1,836 (-4%) | 12mo | $155,000 | $84 | 52 |
| 639 W Elk St | 0.60mi | 4/2.0 | 2,064 (+7%) | 9mo | $120,000 | $58 | 52 |
| 815 W Douglas St | 0.37mi | 3/1.5 (-1) | 1,704 (-11%) | 8mo | $110,000 | $65 | 50 |
| 603 S Galena Ave | 0.74mi | 4/1.0 | 2,075 (+8%) | 5mo | $27,000 | $13 | 44 |
| 9 W Washington St | 0.67mi | 5/2.0 (+1) | 2,120 (+10%) | 9mo | $40,000 | $19 | 39 |
| 840 W Homer St | 0.73mi | 3/1.5 (-1) | 1,640 (-15%) | 8mo | $115,000 | $70 | 28 |
Match score weights: distance 35% · size 25% · config 20% · recency 20%. Top-matched comps best support the ARV.
Projected returns pro-forma
-3.0% appreciation · 3.0% rent growth · sell at horizon
- IRR
- 46.8%
- Equity multiple
- 3.03×
- Total profit
- $35,200
- Equity at exit
- $9,229
- IRR
- 52.5%
- Equity multiple
- 6.13×
- Total profit
- $88,953
- Equity at exit
- $5,352
Cash invested: $17,332 (down + closing). Projections, not guarantees.
Landlord ↔ Tenant lean methodology
- Overall (STATE)
- 43 Moderately Tenant-Leaning
- State Illinois
- 43 Moderately Tenant-Leaning · D+7
- County
- — inherits STATE
- City
- — inherits STATE
ZIP-level market 61032
- Home prices YoY
- -19.5%
- Active inventory
- 206
- Price-to-rent
- 3.6×
Monthly cashflow live
- Estimated rent
- $1,440 high interval (Pro) →
- Mortgage (P&I)
- −$325
- Tax est. 1.5%
- −$77 /mo · $928/yr
- Insurance
- −$26
- HOA
- −$0
- Vacancy / Maint / Mgmt
- −$302
- Net cashflow
- $710
Break-even live
Sensitivity live
| Price | -10% $753 | -5% $731 | +0% $710 | +5% $688 | +10% $667 |
|---|---|---|---|---|---|
| Rent | -10% $596 | -5% $653 | +0% $710 | +5% $767 | +10% $824 |
| Rate | -1.0pp $741 | -0.5pp $726 | base $710 | +0.5pp $694 | +1.0pp $677 |
UW: 25.0% down · 7.5% · 30yr · 1.5% tax · 5.0% vac · 8.0% maint · 8.0% mgmt
Financing live
Cash to close
- Down payment
- $15,475
- Closing costs
- $1,857
- Reserves months
- —
- Total cash needed
- —
Loan-product check · same deal, 3 products live
Conventional
25% down · 7.5% · 30yr
- Down + closing
- —
- Monthly P&I
- —
- Monthly cashflow
- —
- DSCR
- —
- Eligible?
- —
Personal DTI + credit; lowest rate.
DSCR
20% down · 8.5% · 30yr
- Down + closing
- —
- Monthly P&I
- —
- Monthly cashflow
- —
- DSCR
- —
- Eligible?
- —
No personal income docs; deal must DSCR.
Hard money
10% down · 12.0% · 12mo
- Down + closing
- —
- Monthly P&I
- —
- Monthly cashflow
- —
- DSCR
- —
- Eligible?
- —
Short-term bridge; refi at stabilization.
Rent comps 5 comps
| Address | Beds | Baths | Sqft | Rent | $/sqft | DOM | Units | Dist |
|---|---|---|---|---|---|---|---|---|
| 435 N Apple Ave Freeport, IL | 4.0 | 2.0 | 1500 | $1,450 | $0.97 | 45d | 1 | 0.12mi |
| 320 W Clark St Freeport, IL | 4.0 | 1.0 | 1509 | $1,395 | $0.92 | 45d | 1 | 0.24mi |
| 742 W Homer St Freeport, IL | 3.0 | 1.0 | 1434 | $1,325 | $0.92 | 45d | 1 | 0.71mi |
| 434 1/2 S State Ave Freeport, IL | 3.0 | 2.0 | 2544 | $1,595 | $0.63 | 45d | 1 | 0.80mi |
| 404 E Prospect Ter Freeport, IL | 4.0 | 2.0 | 2560 | $1,525 | $0.60 | 22d | 1 | 1.14mi |
Listing history 8 events
-
2026-04-23status Pending
-
2026-02-25price $61,900
-
2026-02-25status Active
-
2026-02-17historical
-
2026-01-23$64,900 Active
-
2024-05-03soldstatus $59,000 Closed 252-char remark
Show marketing remark (252 chars)
This 2 Story house with 4 bedrooms, 2 Full baths. Large Living room, Dining Room, Kitchen and main floor laundry. Full bath up stairs. 2 stall garage with storage shed. Extra 1 stall garage shared with the neighbor. Shared drive way. Plenty of storage.
-
2024-04-13status Pending 252-char remark
Show marketing remark (252 chars)
This 2 Story house with 4 bedrooms, 2 Full baths. Large Living room, Dining Room, Kitchen and main floor laundry. Full bath up stairs. 2 stall garage with storage shed. Extra 1 stall garage shared with the neighbor. Shared drive way. Plenty of storage.
-
2023-12-06$64,900 Active 252-char remark
Show marketing remark (252 chars)
This 2 Story house with 4 bedrooms, 2 Full baths. Large Living room, Dining Room, Kitchen and main floor laundry. Full bath up stairs. 2 stall garage with storage shed. Extra 1 stall garage shared with the neighbor. Shared drive way. Plenty of storage.
ⓘ Source: listings_history table (triggers on properties + properties_extension) + one-shot
backfill from property_details.listing_events for pre-trigger history.
Climate risk First Street
- Flood 1/10 Low FEMA zone X (unshaded) · 0% chance over 30 yrs
- Wildfire 1/10 Low
- Heat 3/10 Moderate 7 d/yr ≥101°F today · 15 d/yr by 30 yrs out
- Wind 2/10 Low
- Air quality 2/10 Low 1 unhealthy d/yr today · 2 by 30 yrs out
Nearby sold comps map
Loading sold comps map…
Walkable amenities ~0.75 mi
Loading nearby amenities…
Taxation est. · year 1
- Rental income
- $17,280
- − Mortgage interest
- −$3,467
- − Property taxes
- −$928
- − Insurance
- −$310
- − Repairs & maintenance
- −$1,382
- − Management
- −$1,382
- − Depreciation
- −$1,801
- Taxable income
- $8,009
- Est. tax owed @ 24.0%
- −$1,922
- After-tax cash flow
- $6,596/yr
For passive investors: Depreciation is non-cash, so a rental often shows a tax loss while cash-flowing — sheltering income. Rental losses are passive: they offset passive income freely, and up to $25,000/yr can offset ordinary (W-2) income if you actively participate and your MAGI is under $100k (phasing out to $0 by $150k); unused losses carry forward. On sale, claimed depreciation is recaptured at up to 25%, and gains may owe capital-gains tax (a 1031 exchange can defer both). Figures are a year-1 estimate at your 24.0% rate — not tax advice; consult a CPA.
Schools (NCES district)
- District
- Freeport SD 145
- NCES district ID
- 1715900
- Math proficiency
- 11% ▼ -3.00%
- Reading proficiency
- 12% ▼ -5.00%
- Median HH income
- $39,803
- Composite
- 9.89/100
- National rank
- #9821
- State rank
- #565 of 620 in IL
Livability — Freeport
- Score
- 72/100
- State rank
- #302
- US rank
- #5927
Category grades
Schools grade is shown separately in the Schools card above.
Census & demographics
- Census place
- Freeport, IL
- Population (ZIP)
- 29,072
Population outlook (Stephenson County) Hauer SSP2
- Today (2025)
- 41,802 people
- By 2030
- 39,487 · -5.5%
- By 2040
- 34,534 · -17.4%
- By 2050
- 29,693 · -29.0%
- By 2075
- 21,196 · -49.3%
- By 2100
- 14,596 · -65.1%
Race, ethnicity, and origin ACS 2023
- Neighborhood character
- Predominantly White (73%)
- Race & ethnicity
- White 73% Black 12% Two or more races 10% Hispanic / Latino 6% Asian 1%
- Hispanic origin (detail)
- Mexican 4% Puerto Rican 1%
- Common ancestry
- Iranian 3% Romanian 2% Lithuanian 2%
- Foreign-born
- 3% · Canada
- Languages at home
- 96% English-only · Spanish 3% Other Indo-European 1%
Political lean MEDSL · Stephenson
- 2024 margin
- R (+19.4) · D 39.5% · R 58.9% · Other 1.6%
- 2008→2024 swing
- -26.1pp toward R · 2008: 6.7pp · 2024: -19.4pp
- All cycles
- 2024: R+19.4 2020: R+15.7 2016: R+17.0 2012: R+4.6 2008: D+6.7
Not yet ingested
- Civics
- —
Market trends
- HPI YoY
- ▼ -39.75%
- Current HPI
- 163.677
- Rent YoY
- —
- Metro
- —
- State GDP YoY
- ▲ 1.59%
- F500 in state
- 60
Industry mix (Fortune 500 HQ in IL)
| Industry | F500 HQs | Revenue |
|---|---|---|
| Insurance | 4 | $201B |
|
||
| Consumer Goods | 4 | $87B |
|
||
| Industrial Machinery | 3 | $64B |
|
||
| Healthcare | 2 | $55B |
|
||
| Retail / Pharmacy | 1 | $148B |
|
||
| Agriculture / Food | 1 | $86B |
|
||
Price history
-4.6% since first listed8 events — show timeline
- 2026-04-23 Pending — NWIAR
- 2026-02-25 Price Changed $61,900 NWIAR
- 2026-02-25 Relisted — NWIAR
- 2026-02-17 Delisted — NWIAR
- 2026-01-23 Listed $64,900 NWIAR
- 2024-05-03 Sold (MLS) $59,000 NWIAR
- 2024-04-13 Pending — NWIAR
- 2023-12-06 Listed $64,900 NWIAR
Cash-flow waterfall
monthlySold comps — $/sqft
last 12 mo · ≤1 miLoading sold comps…