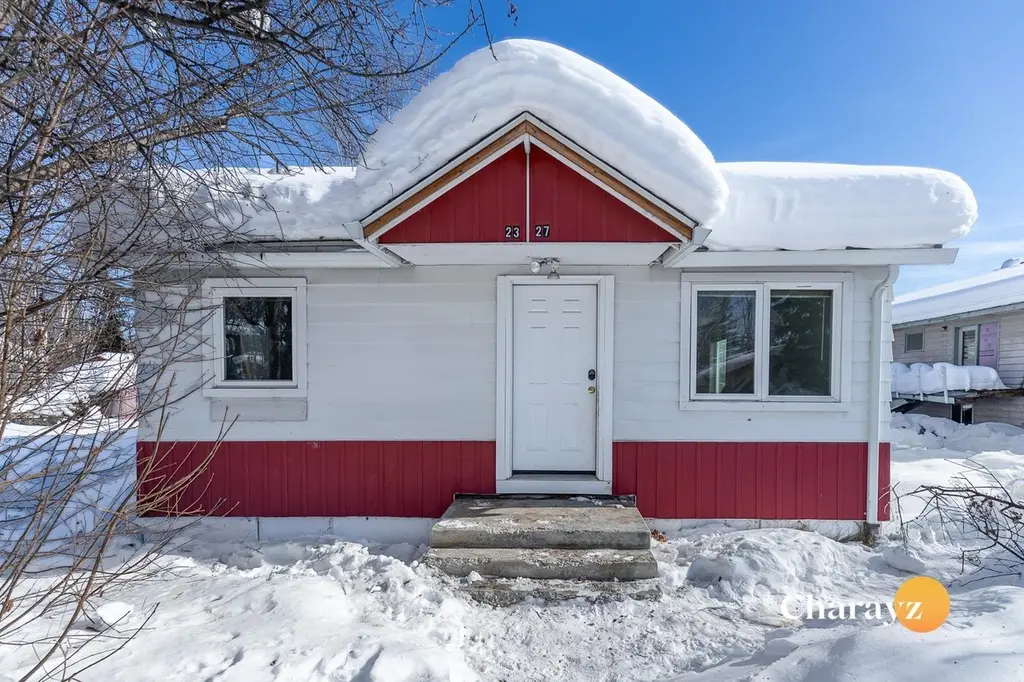
2327 Gillam Way · Fairbanks, AK
Flood risk 5/10 · Moderate
- FEMA flood zone
- X
- Chance of flooding over 30 yrs
- 0.24%
- Est. flood insurance / yr
- $473 – $860
Fire risk No data
- Est. fire insurance / yr
- —
Heat risk No data
- Hot days now (above threshold)
- —
- Hot days in 30 yrs
- —
Wind risk No data
- Chance of severe wind over 30 yrs
- —
Air-quality risk 1/10 · Minimal
- Unhealthy air days now
- —
- Unhealthy air days in 30 yrs
- —
Risk factors via First Street. Map © Google.
Why this score? — see what drove the D grade
The composite is a weighted blend of 9 inputs, each scored 0–100. Each bar is that input's sub-score; the figure is the points it added to the 100-point composite (weight × sub-score).
- Cash flow +15.9/30.0
- ARV discount +5.3/15.0
- DSCR +4.9/10.0
- 1% rule +3.8/10.0
- Schools +3.6/10.0
- Rent growth +2.9/5.0
- Livability +2.9/5.0
- Condition / age +2.5/5.0
- Appreciation +0.0/10.0
$235,000
🖨 Deal sheet 📄 Offer letter ✓ Due diligence
Listing remarks MLS
Well cared for home. Upgrades have been windows, boiler, lighting, flooring, bathroom and kitchen. Great starter home. Room to grow. The basement could be upgraded into a 3rd bedroom. Lot of value for the money.
Key facts
- 7,699 sq ft lot
- Built 1958
- Listed 5 days
Neighborhood map
What this means for you Summary
Snapshot
- This is a 2-bed/1.0-bath single-family listed at $235k.
Deal economics
- At list price, monthly cash flow is $113 ($1k/yr) — positive.
- The deal already cash-flows at list — no discount required.
- To meet the 1% rule (rent ≥ 1% of price), the offer needs to be $207k (12.1% below list).
- Recommended offer: $207k (12.1% below list) — sets the bar for 1% rule.
- Cap rate 6.9% vs local median 4.9% in Fairbanks — top-decile yield for the area; either an underpriced asset or a hidden risk that comps aren't pricing in. Stress-test before assuming the spread holds.
Location & tenants
- Location reads 57/100 on livability (#95 in AK) — a working-class tenant base; expect higher turnover. Strengths: housing A+; Watch: crime F, amenities F, commute F.
- Fairbanks North Star Borough School District (urban): math 33% / reading 45% proficiency, ranked #10 of 21 in AK (top 48%) — families likely to look elsewhere, expect single-tenant / working-renter base with shorter leases.
- Zoned schools: Hunter Elementary (math 24% / reading 24%, grade F, #122 of 156 statewide, top 81%, 363 students, 70% FRL); Ryan Middle School (math 25% / reading 33%, grade F, #28 of 36 statewide, top 77%, 543 students, 47% FRL); Lathrop High School (math 32% / reading 42%, grade F, #24 of 61 statewide, top 42%, 886 students, 36% FRL) — zoned schools average 51% FRL vs 27% district-wide (24 pts higher); higher-poverty schools than district average — tighter screening recommended.
- Market conditions: Rents rising (+1.6%/yr); 64 active listings in the ZIP; 2 comparable units currently listed for rent nearby; solid renter incomes; 1 units permitted in Fairbanks North Star Borough in 2024 (0 in 5+ unit buildings).
- This rent runs 33% of the median local income ($76k/yr) — at the standard rent-burdened threshold; future hikes will face affordability resistance.
Forward outlook
- Local home prices are declining (-3.0%/yr); year-one equity from $2k of loan paydown is wiped out by about $7k of value loss. Plan a longer hold.
- Fairbanks North Star County population projected at +6% by 2050 — modest demand growth; plan on rents tracking national, not racing it.
Negotiation context
- Only 5 days on market — expect competitive offers; lowballing is unlikely to land.
- 2 sale attempts since 5y ago with the ask held roughly flat each time — persistent listings suggest the price (not the market) is what's stuck; bring a comps-based counter.
Risks & watch-outs
- Watch-outs: built in 1958 — expect roof / HVAC / electrical / plumbing capex.
- Climate carrying-cost: moderate flood risk — expect insurance premiums to compound above CPI over the hold.
Questions for the listing agent
- Built in 1958 — when were the roof, HVAC, electrical panel, plumbing, and water heater last replaced?
- Is there a deadline driving the sale (1031 exchange, divorce, estate, relocation)? That informs how much negotiation room exists.
- Schools are D-rated, which usually means shorter tenancies and higher turnover. Who's the typical renter profile here, and what's been the actual vacancy rate?
- Crime grade is F in this area — have there been break-ins, vandalism, or insurance claims at this property in the last 3 years? What carrier currently insures it and at what premium?
- The area grade is low — what's the realistic commute time and amenity access for the typical tenant pool here? Any planned neighborhood developments (good or bad) we should know about?
- What's the average days-on-market for RENTAL listings here right now (not sales)? A rising rental-DOM trend means longer vacancies and softer asking-rent achievability than the comps imply.
- What's the recent tenant-quality profile in this submarket — average credit score on applications, eviction rate, late-payment / NSF rate, and stable-employment percentage? A property-management company in the area should have these aggregated.
- How much new for-sale + rental construction is in the pipeline within 1–3 miles? Heavy new supply typically softens prices + rents 12–24 months out; constrained supply supports both.
Investment metrics
- 1% rule
- 0.88% ✗
- Cap rate
- 6.87%
- Cash-on-cash
- 2.06%
- DSCR
- 1.09
- GRM
- 9.5
CMA / ARV
- ARV (on-the-fly)
- $223,925
- Comps found
- 12
Show comp detail 12 sales within ~0.75 mi
| Address | Dist | Beds/Ba | Sqft | Sold | Price | $/sf | Match |
|---|---|---|---|---|---|---|---|
| 802 23rd Ave | 0.23mi | 2/1.0 | 1,440 (+9%) | 1mo | $195,000 | $135 | 74 |
| 2227 Turner St | 0.13mi | 2/2.0 | 1,188 (-10%) | 3mo | $180,000 | $152 | 70 |
| 917 24th Ave | 0.14mi | 3/1.0 (+1) | 1,176 (-11%) | 4mo | $245,000 | $208 | 66 |
| 2022 Blueberry St | 0.25mi | 2/1.0 | 1,232 (-7%) | 16mo | $229,900 | $187 | 63 |
| 1222 27th Ave | 0.26mi | 3/1.5 (+1) | 1,366 (+3%) | 18mo | $239,000 | $175 | 61 |
| 1222 26th Ave | 0.20mi | 3/1.5 (+1) | 1,192 (-10%) | 8mo | $225,000 | $189 | 60 |
| 1033 27th Ave | 0.23mi | 2/1.5 | 1,196 (-10%) | 15mo | $134,600 | $113 | 59 |
| 1207 26th Ave | 0.20mi | 3/2.5 (+1) | 1,374 (+4%) | 19mo | $170,000 | $124 | 58 |
| 724 Twenty-first Ave | 0.28mi | 2/1.0 | 1,184 (-11%) | 14mo | $165,000 | $139 | 58 |
| 1556 Noble St | 0.61mi | 2/1.0 | 1,338 (+1%) | 15mo | $129,000 | $96 | 58 |
| 1202 26th Ave | 0.17mi | 3/2.5 (+1) | 1,184 (-11%) | 8mo | $199,900 | $169 | 57 |
| 1565 Gillam Way Unit 207 | 0.57mi | 3/1.5 (+1) | 1,272 (-4%) | 10mo | $225,000 | $177 | 52 |
Match score weights: distance 35% · size 25% · config 20% · recency 20%. Top-matched comps best support the ARV.
Projected returns pro-forma
-3.0% appreciation · 1.62% rent growth · sell at horizon
- IRR
- -14.5%
- Equity multiple
- 0.49×
- Total profit
- $-33,756
- Equity at exit
- $35,039
- IRR
- -8.1%
- Equity multiple
- 0.52×
- Total profit
- $-31,568
- Equity at exit
- $20,319
Cash invested: $65,800 (down + closing). Projections, not guarantees.
Landlord ↔ Tenant lean methodology
- Overall (STATE)
- 80 Strongly Landlord-Friendly
- State Alaska
- 80 Strongly Landlord-Friendly · R+8
- County
- — inherits STATE
- City
- — inherits STATE
ZIP-level market 99701
- Home prices YoY
- -19.4%
- Rents YoY
- 1.6%
- Active inventory
- 64
- Price-to-rent
- 9.5×
Monthly cashflow live
- Estimated rent
- $2,065 medium interval (Pro) →
- Mortgage (P&I)
- −$1,232
- Tax from tax record
- −$189 /mo · $2,263/yr
- Insurance
- −$98
- HOA
- −$0
- Vacancy / Maint / Mgmt
- −$434
- Net cashflow
- $113
Break-even live
UW: 25.0% down · 7.5% · 30yr · 1.5% tax · 5.0% vac · 8.0% maint · 8.0% mgmt
Financing live
Cash to close
- Down payment
- $58,750
- Closing costs
- $7,050
- Reserves months
- —
- Total cash needed
- —
Loan-product check · same deal, 3 products live
Conventional
25% down · 7.5% · 30yr
- Down + closing
- —
- Monthly P&I
- —
- Monthly cashflow
- —
- DSCR
- —
- Eligible?
- —
Personal DTI + credit; lowest rate.
DSCR
20% down · 8.5% · 30yr
- Down + closing
- —
- Monthly P&I
- —
- Monthly cashflow
- —
- DSCR
- —
- Eligible?
- —
No personal income docs; deal must DSCR.
Hard money
10% down · 12.0% · 12mo
- Down + closing
- —
- Monthly P&I
- —
- Monthly cashflow
- —
- DSCR
- —
- Eligible?
- —
Short-term bridge; refi at stabilization.
Rent comps 2 comps
| Address | Beds | Baths | Sqft | Rent | $/sqft | DOM | Units | Dist |
|---|---|---|---|---|---|---|---|---|
| 2803 Wilson St Apt 4 Fairbanks, AK | 3.0 | 1.0 | 1000 | $2,450 | $2.45 | 43d | 1 | 0.37mi |
| 910 4th Ave Fairbanks, AK | 2.0 | 1.0 | 1048 | $1,700 | $1.62 | 43d | 1 | 1.24mi |
Listing history 5 events
-
2026-04-08status Pending
-
2026-04-03$235,000 Active
-
2022-03-31soldstatus 211-char remark
Show marketing remark (211 chars)
Well cared for home. Upgrades have been windows, boiler, lighting, flooring, bathroom and kitchen. Great starter home. Room to grow. The basement could be upgraded into a 3rd bedroom. Lot of value for the money.
-
2022-03-29soldstatus
-
2021-11-11$179,900 211-char remark
Show marketing remark (211 chars)
Well cared for home. Upgrades have been windows, boiler, lighting, flooring, bathroom and kitchen. Great starter home. Room to grow. The basement could be upgraded into a 3rd bedroom. Lot of value for the money.
ⓘ Source: listings_history table (triggers on properties + properties_extension) + one-shot
backfill from property_details.listing_events for pre-trigger history.
Tax reassessment forecast AK · Partial reset (capped growth)
- Current annual tax
- $2,263 · $189/mo
- Projected year-2 tax
- $2,530 · $211/mo
- Expected delta
- +$267/yr (+$22/mo · 11.8%)
ⓘ Screening estimate from a state-policy table — verify with the county assessor before closing.
Climate risk First Street
- Flood 5/10 Major FEMA zone X · 24% chance over 30 yrs
- Air quality 1/10 Low
Nearby sold comps map
Loading sold comps map…
Walkable amenities ~0.75 mi
Loading nearby amenities…
Taxation est. · year 1
- Rental income
- $24,785
- − Mortgage interest
- −$13,164
- − Property taxes
- −$2,263
- − Insurance
- −$1,175
- − Repairs & maintenance
- −$1,983
- − Management
- −$1,983
- − Depreciation
- −$6,836
- Taxable loss
- −$2,618
- Est. tax savings @ 24.0%
- +$628
- After-tax cash flow
- $1,982/yr
For passive investors: Depreciation is non-cash, so a rental often shows a tax loss while cash-flowing — sheltering income. Rental losses are passive: they offset passive income freely, and up to $25,000/yr can offset ordinary (W-2) income if you actively participate and your MAGI is under $100k (phasing out to $0 by $150k); unused losses carry forward. On sale, claimed depreciation is recaptured at up to 25%, and gains may owe capital-gains tax (a 1031 exchange can defer both). Figures are a year-1 estimate at your 24.0% rate — not tax advice; consult a CPA.
Schools (NCES district)
- District
- Fairbanks North Star Borough School District
- NCES district ID
- 0200600
- Math proficiency
- 33% ▼ -6.00%
- Reading proficiency
- 45% ▲ 3.00%
- Median HH income
- $69,697
- Composite
- 35.5/100
- National rank
- #4915
- State rank
- #10 of 21 in AK
Livability — Fairbanks
- Score
- 57/100
- State rank
- #95
- US rank
- #21394
Category grades
Schools grade is shown separately in the Schools card above.
Census & demographics
- Census place
- Fairbanks, AK
- County
- Fairbanks North Star Borough · 69,381 people
- City population
- 47,612
- Metro
- Fairbanks, AK
- Population (ZIP)
- 18,061
- Household income
- $75,668
- Rent vs Own
- Severe rent burden
- 652.0
Population outlook (Fairbanks North Star County) Hauer SSP2
- Today (2025)
- 101,607 people
- By 2030
- 102,796 · +1.2%
- By 2040
- 104,748 · +3.1%
- By 2050
- 107,598 · +5.9%
- By 2075
- 118,829 · +16.9%
- By 2100
- 127,151 · +25.1%
Race, ethnicity, and origin ACS 2023
- Neighborhood character
- Diverse neighborhood (Simpson 0.64)
- Race & ethnicity
- White 59% Two or more races 14% Native American 12% Hispanic / Latino 7% Asian 6% Black 5%
- Hispanic origin (detail)
- Mexican 4% Puerto Rican 1%
- Common ancestry
- Italian 4% Slovak 3% Portuguese 3%
- Foreign-born
- 7% · South Korea, Canada, China
- Languages at home
- 86% English-only · Spanish 4% Korean 2% Tagalog/Filipino 2%
Political lean MEDSL · Fairbanks North Star
- 2016 margin
- R (+15.2) · D 37.7% · R 52.9% · Other 9.4%
- All cycles
- 2016: R+15.2
Not yet ingested
- Civics
- —
Market trends
- HPI YoY
- ▼ -37.70%
- Current HPI
- 156.1921
- Rent YoY
- ▲ 1.62%
- Metro
- Fairbanks, AK
- State GDP YoY
- —
- F500 in state
- 0
Price history
+30.6% since first listed5 events — show timeline
- 2026-04-08 Pending — AKMLS
- 2026-04-03 Listed $235,000 AKMLS
- 2022-03-31 Sold (MLS) — GFBR
- 2022-03-29 Sold (Public Records) — Public Records
- 2021-11-11 Listed $179,900 GFBR
Property tax history
+4.6%/yrLatest (2025): $2,263 · -10.6% YoY. Source: county tax records.
Cash-flow waterfall
monthlySold comps — $/sqft
last 12 mo · ≤1 miLoading sold comps…