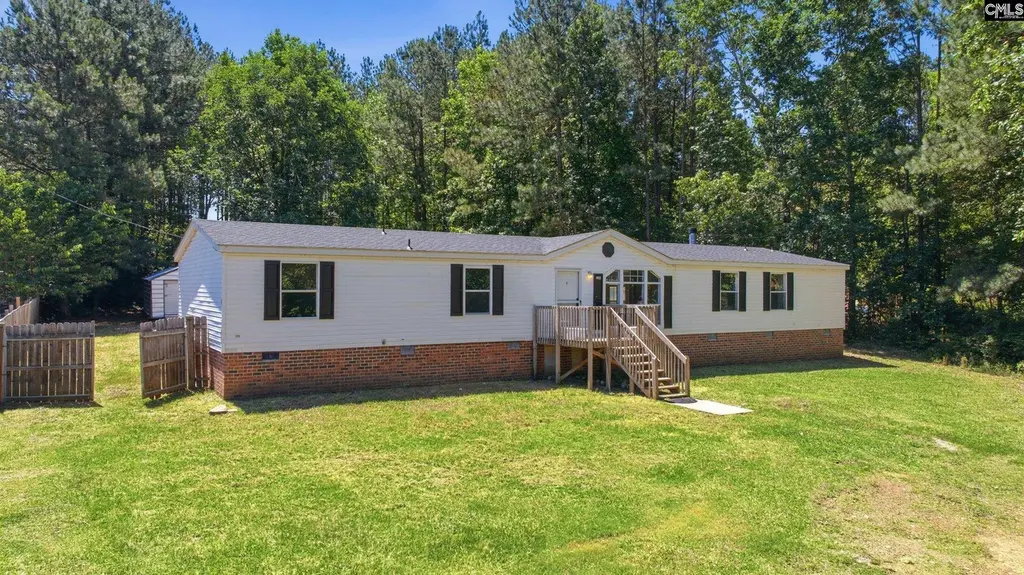
1308 Bear Creek Rd · Blythewood, SC
Flood risk 1/10 · Minimal
- FEMA flood zone
- X
- Chance of flooding over 30 yrs
- 0.0%
- Est. flood insurance / yr
- $435 – $905
Fire risk 2/10 · Minimal
- Est. fire insurance / yr
- $783 – $1,453
Heat risk 6/10 · Moderate
- Hot days now (above threshold)
- 7 days/yr
- Hot days in 30 yrs
- 16 days/yr
Wind risk No data
- Chance of severe wind over 30 yrs
- —
Air-quality risk No data
- Unhealthy air days now
- —
- Unhealthy air days in 30 yrs
- —
Risk factors via First Street. Map © Google.
Why this score? — see what drove the C grade
The composite is a weighted blend of 9 inputs, each scored 0–100. Each bar is that input's sub-score; the figure is the points it added to the 100-point composite (weight × sub-score).
- Cash flow +23.8/30.0
- DSCR +7.7/10.0
- ARV discount +7.5/15.0
- 1% rule +5.0/10.0
- Schools +3.6/10.0
- Livability +3.5/5.0
- Rent growth +2.5/5.0
- Condition / age +2.5/5.0
- Appreciation +0.0/10.0
$225,000
🖨 Deal sheet (PDF) 📄 Offer letter ✓ Due diligence
Listing remarks
Don’t miss this beautifully updated 4-bedroom, 3-bath manufactured home in the desirable Richland 2 School District. Set on a spacious 1-acre lot, it offers privacy, outdoor potential, and modern comfort. The open-concept layout includes new LVP flooring throughout, a spacious kitchen with a large island and walk-in pantry, and two separate living areas—one filled with natural light from a large bay window, and the other featuring a cozy fireplace perfect for relaxing evenings. Master bedroom with large private bath. Additional bedrooms add flexibility for family, guests, or a home office. NEW ROOF installed Nov. 2025. Located just minutes from top-rated schools, shops, and din
Key facts
- Spacious 1 acre lot
- Large island
- Large bay window
Tags
Property features AI
Exterior
- Utilities: Well water; Septic sewer
- Home design: Single-story home; Crawlspace foundation
- Construction: Vinyl exterior; Crawlspace foundation
- Exterior features: Deck; Storage shed; Vinyl exterior finish; Rear wood privacy fence
Interior
- Kitchen: Island; Pantry; Formica countertops; Painted cabinets; Free-standing smooth-surface range; Dishwasher
- Bedrooms: Primary bedroom on main level with double vanity, garden tub, private bath and separate shower; luxury vinyl plank flooring; Bedrooms 2–4 on main level (Bedroom 2 and 3 share a Jack & Jill bath)
- Flooring: Luxury vinyl plank flooring in main living areas and primary bedroom
- Bathrooms: Three full bathrooms; Primary bathroom with double vanity, garden tub and separate shower; Jack & Jill bathroom serving two bedrooms
- Heating & cooling: Heat pump (serving first level); Central cooling
- Interior features: Ceiling fan(s); Fireplace (wood burning, 1); Sunken living area; Bay window; High ceilings (over 9 ft)
- Laundry & utility: Main-level laundry in a mud room
Neighborhood map
What this means for you Summary
Snapshot
- This is a 3-bed/2.0-bath manufactured listed at $225k.
Deal economics
- At list price, monthly cash flow is $433 ($5k/yr) — positive.
- The deal already cash-flows at list — no discount required.
- To meet the 1% rule (rent ≥ 1% of price), the offer needs to be $225k (0.2% below list).
- Recommended offer: $222k (1.5% below list) — sets the bar for market timing.
Location & tenants
- Location reads 70/100 on livability (#58 in SC) — a middle-class / working-renter tenant base. Strengths: crime A+, employment A+, housing A+; Watch: amenities F, commute F, health & safety F.
- Richland 02 (suburban): math 35% / reading 47% proficiency, ranked #29 of 80 in SC (top 36%) — families likely to look elsewhere, expect single-tenant / working-renter base with shorter leases.
- Zoned schools: Langford Elementary (math 39% / reading 43%, grade F, #276 of 597 statewide, top 48%, 609 students, 64% FRL); Blythewood High (math 72% / reading 92%, grade A, #19 of 196 statewide, top 10%, 2,094 students, 39% FRL).
- Zoned-school proficiency averages 62% at this address vs 41% district-wide (+20 pts) — the actual schools serving this property are materially stronger than the Richland 02 average implies; a family-tenant draw the district grade alone would hide.
- Market conditions: 657 active listings in the ZIP; solid renter incomes; 3,472 units permitted in Richland County in 2024 (1,096 in 5+ unit buildings).
Forward outlook
- Local home prices are declining (-3.0%/yr); year-one equity from $2k of loan paydown is wiped out by about $7k of value loss. Plan a longer hold.
- Richland County population projected at +30% by 2050 — long-run rental-demand tailwind backs the buy-and-hold thesis.
Negotiation context
- It's been on market 16 days — a 2% lower offer ($222k) is reasonable based on typical stale-listing flexibility.
- 2 sale attempts with the ask held roughly flat each time — persistent listings suggest the price (not the market) is what's stuck; bring a comps-based counter.
- Current owner paid $75k; list at $225k implies a 200% gain — meaningful room to come down on a strong offer.
Risks & watch-outs
- Climate carrying-cost: extreme-heat days projected 7→16/yr by 2055 (HVAC capex compounding) — expect insurance premiums to compound above CPI over the hold.
Questions for the listing agent
- Is there a deadline driving the sale (1031 exchange, divorce, estate, relocation)? That informs how much negotiation room exists.
- Schools are B-rated — typically a magnet for longer-tenancy family renters. What's the average tenant stay here, and is there a school-zone premium baked into asking?
- What's the average days-on-market for RENTAL listings here right now (not sales)? A rising rental-DOM trend means longer vacancies and softer asking-rent achievability than the comps imply.
- What's the recent tenant-quality profile in this submarket — average credit score on applications, eviction rate, late-payment / NSF rate, and stable-employment percentage? A property-management company in the area should have these aggregated.
- How much new for-sale + rental construction is in the pipeline within 1–3 miles? Heavy new supply typically softens prices + rents 12–24 months out; constrained supply supports both.
Investment metrics
- 1% rule
- 1.00% ✗
- Cap rate
- 8.60%
- Cash-on-cash
- 8.25%
- DSCR
- 1.37
- GRM
- 8.3
CMA / ARV
No comps found within radius.
Projected returns pro-forma
-3.0% appreciation · 3.0% rent growth · sell at horizon
- IRR
- -3.8%
- Equity multiple
- 0.86×
- Total profit
- $-8,982
- Equity at exit
- $33,548
- IRR
- 5.8%
- Equity multiple
- 1.43×
- Total profit
- $27,290
- Equity at exit
- $19,454
Cash invested: $63,000 (down + closing). Projections, not guarantees.
Landlord ↔ Tenant lean methodology
- Overall (STATE)
- 90 Strongly Landlord-Friendly
- State South Carolina
- 90 Strongly Landlord-Friendly · R+6
- County
- — inherits STATE
- City
- — inherits STATE
ZIP-level market 29016
- Home prices YoY
- -26.3%
- Active inventory
- 657
- Price-to-rent
- 8.3×
Monthly cashflow live
- Estimated rent
- $2,246 medium interval (Pro) →
- Mortgage (P&I)
- −$1,180
- Tax from tax record
- −$68 /mo · $813/yr
- Insurance
- −$94
- HOA
- −$0
- Vacancy / Maint / Mgmt
- −$472
- Net cashflow
- $433
Break-even live
Sensitivity live
| Price | -10% $560 | -5% $497 | +0% $433 | +5% $369 | +10% $306 |
|---|---|---|---|---|---|
| Rent | -10% $256 | -5% $344 | +0% $433 | +5% $522 | +10% $610 |
| Rate | -1.0pp $546 | -0.5pp $490 | base $433 | +0.5pp $375 | +1.0pp $315 |
UW: 25.0% down · 7.5% · 30yr · 1.5% tax · 5.0% vac · 8.0% maint · 8.0% mgmt
Financing live
Cash to close
- Down payment
- $56,250
- Closing costs
- $6,750
- Reserves months
- —
- Total cash needed
- —
Loan-product check · same deal, 3 products live
Conventional
25% down · 7.5% · 30yr
- Down + closing
- —
- Monthly P&I
- —
- Monthly cashflow
- —
- DSCR
- —
- Eligible?
- —
Personal DTI + credit; lowest rate.
DSCR
20% down · 8.5% · 30yr
- Down + closing
- —
- Monthly P&I
- —
- Monthly cashflow
- —
- DSCR
- —
- Eligible?
- —
No personal income docs; deal must DSCR.
Hard money
10% down · 12.0% · 12mo
- Down + closing
- —
- Monthly P&I
- —
- Monthly cashflow
- —
- DSCR
- —
- Eligible?
- —
Short-term bridge; refi at stabilization.
Listing history 12 events
-
2026-06-22days on market $225,000 Active 16 DOM
-
2026-06-18days on market $225,000 Active 13 DOM
-
2026-06-17days on market $225,000 Active 12 DOM
-
2026-06-16days on market $225,000 Active 11 DOM
-
2026-06-15days on market $225,000 Active 10 DOM
-
2026-06-14days on market $225,000 Active 8 DOM
-
2026-06-13days on market $225,000 Active 7 DOM
-
2026-06-10days on market $225,000 Active 5 DOM
-
2026-06-09days on market $225,000 Active 4 DOM
-
2026-06-08days on market $225,000 Active 3 DOM
-
2026-06-07remarks 687-char remark
-
2026-06-07$225,000 Active 2 DOM
ⓘ Source: listings_history table (triggers on properties + properties_extension) + one-shot
backfill from property_details.listing_events for pre-trigger history.
Tax reassessment forecast SC · Resets to sale price
- Current annual tax
- $813 · $68/mo
- Projected year-2 tax
- $1,282 · $107/mo
- Expected delta
- +$470/yr (+$39/mo · 57.8%)
ⓘ Screening estimate from a state-policy table — verify with the county assessor before closing.
Climate risk First Street
- Flood 1/10 Low FEMA zone X · 0% chance over 30 yrs
- Wildfire 2/10 Low
- Heat 6/10 Major
Nearby sold comps map
Loading sold comps map…
Walkable amenities ~0.75 mi
Loading nearby amenities…
Taxation est. · year 1
- Rental income
- $26,952
- − Mortgage interest
- −$12,603
- − Property taxes
- −$813
- − Insurance
- −$1,125
- − Repairs & maintenance
- −$2,156
- − Management
- −$2,156
- − Depreciation
- −$6,545
- Taxable income
- $1,553
- Est. tax owed @ 24.0%
- −$373
- After-tax cash flow
- $4,823/yr
For passive investors: Depreciation is non-cash, so a rental often shows a tax loss while cash-flowing — sheltering income. Rental losses are passive: they offset passive income freely, and up to $25,000/yr can offset ordinary (W-2) income if you actively participate and your MAGI is under $100k (phasing out to $0 by $150k); unused losses carry forward. On sale, claimed depreciation is recaptured at up to 25%, and gains may owe capital-gains tax (a 1031 exchange can defer both). Figures are a year-1 estimate at your 24.0% rate — not tax advice; consult a CPA.
Schools (NCES district)
- District
- Richland 02
- NCES district ID
- 4503390
- Math proficiency
- 35% ▼ -15.00%
- Reading proficiency
- 47% ▼ -5.00%
- Median HH income
- $59,684
- Composite
- 36.2/100
- National rank
- #4730
- State rank
- #29 of 80 in SC
Livability — Blythewood
- Score
- 70/100
- State rank
- #58
- US rank
- #7406
Category grades
Schools grade is shown separately in the Schools card above.
Census & demographics
- County
- Richland County · 389,530 people
- City population
- 30,454
- Metro
- Columbia, SC
- Population (ZIP)
- 30,454
- Household income
- $95,082
- Rent vs Own
- Severe rent burden
- 559.0
Population outlook (Richland County) Hauer SSP2
- Today (2025)
- 459,667 people
- By 2030
- 487,524 · +6.1%
- By 2040
- 542,035 · +17.9%
- By 2050
- 595,371 · +29.5%
- By 2075
- 732,998 · +59.5%
- By 2100
- 820,415 · +78.5%
Race, ethnicity, and origin ACS 2023
- Neighborhood character
- Diverse neighborhood (Simpson 0.64)
- Race & ethnicity
- Black 43% White 42% Two or more races 7% Hispanic / Latino 7% Asian 3%
- Hispanic origin (detail)
- Mexican 1% Puerto Rican 2%
- Common ancestry
- Lithuanian 2% Romanian 2% Slovak 2%
- Foreign-born
- 5% · Canada, China
- Languages at home
- 90% English-only · Spanish 5% Other Indo-European 1% German/W. Germanic 1%
Political lean MEDSL · Richland
- 2024 margin
- Solid D (+34.6) · D 66.4% · R 31.8% · Other 1.8%
- 2008→2024 swing
- +5.7pp toward D · 2008: 28.9pp · 2024: 34.6pp
- All cycles
- 2024: D+34.6 2020: D+38.3 2016: D+32.9 2012: D+33.3 2008: D+28.9
Not yet ingested
- Civics
- —
Market trends
- HPI YoY
- ▼ -65.48%
- Current HPI
- 183.5933
- Rent YoY
- —
- Metro
- Columbia, SC
- State GDP YoY
- ▲ 4.51%
- F500 in state
- 2
Industry mix (Fortune 500 HQ in SC)
| Industry | F500 HQs | Revenue |
|---|---|---|
| Packaging | 1 | $7B |
|
||
Price history
+200.0% since first listed4 events — show timeline
- 2026-06-04 Listed $225,000 Consolidated MLS
- 2025-10-13 Price Changed $230,000 Consolidated MLS
- 2025-08-06 Listed $235,000 Consolidated MLS
- 2011-07-15 Sold (Public Records) $75,000 Public Records
Property tax history
-0.1%/yrLatest (2025): $813 · +3.6% YoY. Source: county tax records.
Cash-flow waterfall
monthlySold comps — $/sqft
last 12 mo · ≤1 miLoading sold comps…