4859 Cedar Springs Rd #332 · Dallas, TX
Flood risk 1/10 · Minimal
- FEMA flood zone
- X (unshaded)
- Chance of flooding over 30 yrs
- 0.0%
- Est. flood insurance / yr
- $507 – $1,088
Fire risk 1/10 · Minimal
- Est. fire insurance / yr
- $1,222 – $2,270
Heat risk 7/10 · Major
- Hot days now (above 110°F)
- 7 days/yr
- Hot days in 30 yrs
- 23 days/yr
Wind risk 6/10 · Moderate
- Chance of severe wind over 30 yrs
- 27.0%
Air-quality risk 3/10 · Minor
- Unhealthy air days now
- 2 days/yr
- Unhealthy air days in 30 yrs
- 3 days/yr
Risk factors via First Street. Map © Google.
Why this score? — see what drove the C- grade
The composite is a weighted blend of 9 inputs, each scored 0–100. Each bar is that input's sub-score; the figure is the points it added to the 100-point composite (weight × sub-score).
- Cash flow +16.5/30.0
- 1% rule +10.0/10.0
- ARV discount +7.5/15.0
- DSCR +5.1/10.0
- Livability +4.0/5.0
- Schools +2.8/10.0
- Rent growth +2.6/5.0
- Condition / age +2.5/5.0
- Appreciation +0.0/10.0
$70,000
🖨 Deal sheet (PDF) 📄 Offer letter ✓ Due diligence
Listing remarks
Charming River Oaks Condo in Prime Oak Lawn Location Nestled in the sought-after Landmark River Oaks community, this one-bedroom condo offers the perfect blend of opportunity and convenience. Surrounded by beautifully maintained grounds, greenbelts, and a peaceful creek, the property provides a serene escape right in the heart of the city. A fantastic choice for first-time buyers or long-term investors, the unit is currently leased month-to-month, offering immediate rental income with potential for long-term tenancy. It’s also an ideal project for those looking to add personal updates and value over time. Big walk-in closet and a balcony that overlooks the parking lot. Residents en
Key facts
- Secure gated parking
- River oaks community
- Close to shopping
Tags
Property features AI
Finance
- Other: Property is part of River Oaks Condos subdivision; Possession negotiable; subject to lease; Property is for sale
- HOA & community: Mandatory association; Monthly association fee of $440; HOA management by Worth Ross; Association covers full use of facilities, insurance, and grounds maintenance
Exterior
- Parking: Gated parking
- Security: Gated community access
- Utilities: City water; City sewer; Electricity available; Not in a municipal utility district
- Home design: Residential condominium (attached); Built in 1970; One-story entry level
- Construction: Built in 1970
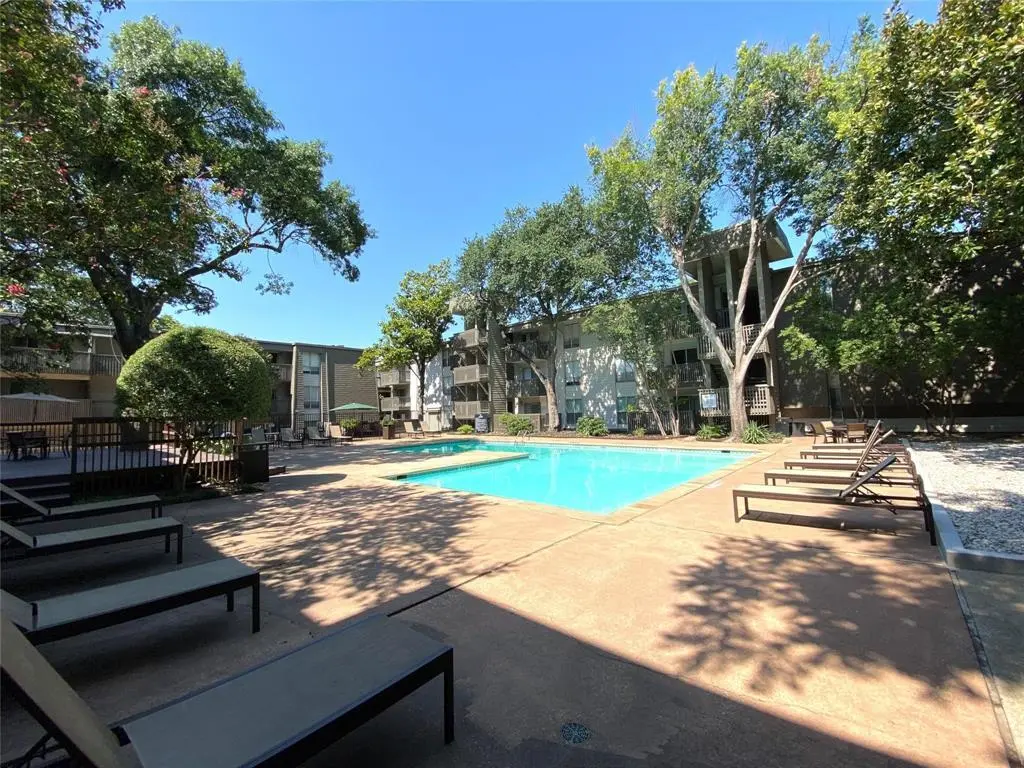
- Exterior features: Community pool (in-ground); Clubhouse; Common elevator; Gated community; Greenbelt
Interior
- Kitchen: Dishwasher; Disposal; Electric oven; Electric range
- Bedrooms: 1 bedroom (Primary bedroom on level 1 with walk-in closet)
- Flooring: Carpet; Concrete; Laminate
- Bathrooms: 1 full bathroom
- Heating & cooling: Central heating (electric); Central air conditioning (electric)
- Interior features: 3 total rooms; One-level layout; Walk-in closet(s); Other interior features
- Laundry & utility: On-site laundry
Neighborhood map
What this means for you Summary
Snapshot
- This is a 1-bed/1.0-bath condo listed at $70k.
Deal economics
- At list price, monthly cash flow is $41 ($496/yr) — positive.
- The deal already cash-flows at list — no discount required.
- Meets the 1% rule at list price ($1k rent vs $70k).
- Cap rate 7.0% vs local median 2.3% in Dallas — top-decile yield for the area; either an underpriced asset or a hidden risk that comps aren't pricing in. Stress-test before assuming the spread holds.
Location & tenants
- Location reads 81/100 on livability (#24 in TX, #1,380 nationally) — a professional / high-income tenant draw. Strengths: amenities A+, commute A+, housing A+; Watch: crime F.
- Dallas ISD (urban): math 31% / reading 36% proficiency, ranked #559 of 826 in TX (top 68%) — families likely to look elsewhere, expect single-tenant / working-renter base with shorter leases; 83% free/reduced lunch — lower-income household profile, screen leases tightly.
- Zoned schools: Maple Lawn El (math 28% / reading 29%, grade F, #2,706 of 4,322 statewide, top 63%, 502 students, 97% FRL); Thomas J Rusk Middle (math 20% / reading 21%, grade F, #1,407 of 1,662 statewide, top 86%, 443 students, 95% FRL); North Dallas H S (math 30% / reading 31%, grade F, #1,085 of 1,632 statewide, top 67%, 1,261 students, 82% FRL).
- Market conditions: Rents flat; 443 active listings in the ZIP; 40 comparable units currently listed for rent nearby; rentals at typical pace (median 24d on market — plan ~3-4 weeks tenant-placement turnaround); solid renter incomes; 12,577 units permitted in Dallas County in 2024 (6,829 in 5+ unit buildings).
- This rent is only 17% of the median local income ($102k/yr) — well below the 30% rent-burden line; pricing power to push rent on renewal without tenant pushback.
Forward outlook
- Local home prices are declining (-3.0%/yr); year-one equity from $484 of loan paydown is wiped out by about $2k of value loss. Plan a longer hold.
- Dallas County population projected at +35% by 2050 — long-run rental-demand tailwind backs the buy-and-hold thesis.
Negotiation context
- Only 13 days on market — expect competitive offers; lowballing is unlikely to land.
Risks & watch-outs
- Watch-outs: property tax is 4.0% of price; HOA is 31% of rent.
- Climate carrying-cost: major wind risk, 27% chance of damaging wind over 30y; extreme-heat days projected 7→23/yr by 2055 (HVAC capex compounding) — expect insurance premiums to compound above CPI over the hold.
Questions for the listing agent
- Built in 1970 — when were the roof, HVAC, electrical panel, plumbing, and water heater last replaced?
- Property tax is high relative to price — has the assessment been appealed recently, and will the sale trigger a re-assessment?
- What does the HOA fee cover, when was the last increase, and are there any pending special assessments or reserve-fund shortfalls?
- Any open or pending special assessments — roof, HVAC, plumbing, elevator, façade? What's the per-unit balance and payoff schedule, and is the seller paying it off at close or rolling it to the buyer?
- Is there a deadline driving the sale (1031 exchange, divorce, estate, relocation)? That informs how much negotiation room exists.
- Crime grade is F in this area — have there been break-ins, vandalism, or insurance claims at this property in the last 3 years? What carrier currently insures it and at what premium?
- What's the average days-on-market for RENTAL listings here right now (not sales)? A rising rental-DOM trend means longer vacancies and softer asking-rent achievability than the comps imply.
- What's the recent tenant-quality profile in this submarket — average credit score on applications, eviction rate, late-payment / NSF rate, and stable-employment percentage? A property-management company in the area should have these aggregated.
- How much new apartment / multifamily construction is in the pipeline within 1–3 miles? Heavy new supply (>2% of stock underway) typically softens rents 12–24 months out; light construction supports rent growth.
Investment metrics
- 1% rule
- 2.01% ✓
- Cap rate
- 7.00%
- Cash-on-cash
- 2.53%
- DSCR
- 1.11
- GRM
- 4.1
CMA / ARV
No comps found within radius.
Projected returns pro-forma
-3.0% appreciation · 0.56% rent growth · sell at horizon
- IRR
- -17.7%
- Equity multiple
- 0.40×
- Total profit
- $-11,700
- Equity at exit
- $10,437
- IRR
- -25.5%
- Equity multiple
- 0.06×
- Total profit
- $-18,428
- Equity at exit
- $6,052
Cash invested: $19,600 (down + closing). Projections, not guarantees.
Landlord ↔ Tenant lean methodology
- Overall (STATE)
- 87 Strongly Landlord-Friendly
- State Texas
- 87 Strongly Landlord-Friendly · R+5
- County
- — inherits STATE
- City
- — inherits STATE
ZIP-level market 75219
- Rents YoY
- 0.6%
- Active inventory
- 443
- Price-to-rent
- 4.1×
Monthly cashflow live
- Estimated rent
- $1,408 high interval (Pro) →
- Mortgage (P&I)
- −$367
- Tax from tax record
- −$235 /mo · $2,814/yr
- Insurance
- −$29
- HOA
- −$440
- Vacancy / Maint / Mgmt
- −$296
- Net cashflow
- $41
Break-even live
Sensitivity live
| Price | -10% $81 | -5% $61 | +0% $41 | +5% $22 | +10% $2 |
|---|---|---|---|---|---|
| Rent | -10% $-70 | -5% $-14 | +0% $41 | +5% $97 | +10% $153 |
| Rate | -1.0pp $77 | -0.5pp $59 | base $41 | +0.5pp $23 | +1.0pp $5 |
UW: 25.0% down · 7.5% · 30yr · 1.5% tax · 5.0% vac · 8.0% maint · 8.0% mgmt
Financing live
Cash to close
- Down payment
- $17,500
- Closing costs
- $2,100
- Reserves months
- —
- Total cash needed
- —
Loan-product check · same deal, 3 products live
Conventional
25% down · 7.5% · 30yr
- Down + closing
- —
- Monthly P&I
- —
- Monthly cashflow
- —
- DSCR
- —
- Eligible?
- —
Personal DTI + credit; lowest rate.
DSCR
20% down · 8.5% · 30yr
- Down + closing
- —
- Monthly P&I
- —
- Monthly cashflow
- —
- DSCR
- —
- Eligible?
- —
No personal income docs; deal must DSCR.
Hard money
10% down · 12.0% · 12mo
- Down + closing
- —
- Monthly P&I
- —
- Monthly cashflow
- —
- DSCR
- —
- Eligible?
- —
Short-term bridge; refi at stabilization.
Rent comps 40 comps
| Address | Beds | Baths | Sqft | Rent | $/sqft | DOM | Units | Dist |
|---|---|---|---|---|---|---|---|---|
| 4859 Cedar Springs Rd Dallas, TX | 1.0 | 1.0 | 665 | $1,250 | $1.88 | 45d | 2 | 0.04mi |
| 4837 Cedar Springs Rd Dallas, TX | 1.0 | 1.0 | 665 | $1,525 | $2.29 | 45d | 2 | 0.06mi |
| 4837 Cedar Springs Rd #110 Dallas, TX | 1.0 | 1.0 | 665 | $1,800 | $2.71 | 26d | 1 | 0.06mi |
| 2833 Kings Rd Dallas, TX | 1.0 | 1.0 | 750 | $1,260 | $1.68 | 16d | 1 | 0.10mi |
| 2833 Kings Rd Dallas, TX | 1.0 | 1.0 | 690 | $1,180 | $1.71 | 45d | 2 | 0.13mi |
| 3102 Kings Rd Dallas, TX | 1.0–2.0 | 1.0–2.0 | 806 | $1,390 | $1.72 | 5d | 4 | 0.15mi |
| 4612 Cedar Springs Rd Dallas, TX | 1.0 | 1.0 | 650 | $1,515 | $2.33 | 45d | 1 | 0.15mi |
| 4612 Cedar Springs Rd Dallas, TX | 1.0 | 1.0 | 650 | $1,515 | $2.33 | 21d | 1 | 0.15mi |
| 5051 Lahoma St Dallas, TX | 1.0 | 1.0 | 636 | $1,312 | $2.06 | 45d | 3 | 0.16mi |
| 4605 Cedar Springs Rd Apt 220 Dallas, TX | 1.0 | 1.0 | 749 | $1,550 | $2.07 | 45d | 1 | 0.17mi |
| 5011 Lahoma St Dallas, TX | 1.0 | 1.0 | 608 | $957 | $1.57 | 26d | 1 | 0.17mi |
| 4606 Cedar Springs Rd Dallas, TX | 1.0–3.0 | 1.0–2.0 | 1001 | $1,140 | $1.14 | 1d | 40 | 0.22mi |
| 5143 Vandelia St Dallas, TX | 1.0 | 1.0 | 642 | $1,300 | $2.02 | 9d | 1 | 0.23mi |
| 5143 Vandelia St Dallas, TX | 1.0 | 1.0 | 642 | $1,300 | $2.02 | 45d | 1 | 0.23mi |
| 5151 Vandelia St Dallas, TX | 2.0 | 1.0–2.0 | 655 | $1,150 | $1.75 | 8d | 6 | 0.24mi |
| 5151 Vandelia St Unit 211-2 Dallas, TX | — | 1.0 | 469 | $999 | $2.13 | 45d | 1 | 0.24mi |
| 5156 Vandelia St Dallas, TX | 1.0 | 1.0 | 652 | $1,275 | $1.96 | 1d | 1 | 0.26mi |
| 4505 Cedar Springs Rd Dallas, TX | 1.0 | 1.0 | 665 | $1,285 | $1.93 | 26d | 1 | 0.30mi |
| 4730 Fairmount St Dallas, TX | 1.0–2.0 | 1.0–2.5 | 971 | $1,309 | $1.35 | 0d | 37 | 0.31mi |
| 2909 Lucas Dr Apt 101 Dallas, TX | 1.0 | 1.0 | 520 | $1,395 | $2.68 | 45d | 1 | 0.31mi |
| 2909 Lucas Dr Unit 103 Dallas, TX | 1.0 | 1.0 | 520 | $1,395 | $2.68 | 26d | 1 | 0.31mi |
| 3280 Cedarplaza Ln Dallas, TX | 1.0–2.0 | 1.0–2.0 | 774 | $1,099 | $1.42 | 8d | 4 | 0.34mi |
| 3443 Mahanna St Dallas, TX | 1.0 | 1.0 | 612 | $1,340 | $2.19 | 9d | 9 | 0.35mi |
| 4633 Fairmount St Dallas, TX | 1.0 | 1.0 | 555 | $1,200 | $2.16 | 21d | 1 | 0.36mi |
| 3328 Cedarplaza Ln Dallas, TX | 1.0–2.0 | 1.0–2.5 | 842 | $1,224 | $1.45 | 6d | 15 | 0.38mi |
| 3136 Hudnall St Dallas, TX | 3.0 | 2.5 | 919 | $1,050 | $1.14 | 0d | 76 | 0.38mi |
| 3383 Cedarplaza Ln Dallas, TX | 2.0 | 1.0–2.0 | 876 | $1,937 | $2.21 | 3d | 13 | 0.39mi |
| 2924 Lucas Dr Dallas, TX | 2.0 | 1.0–2.0 | 894 | $1,670 | $1.87 | 0d | 25 | 0.39mi |
| 5001 Bowser Ave #103 Dallas, TX | 1.0 | 1.0 | 500 | $1,250 | $2.50 | 8d | 1 | 0.40mi |
| 5001 Bowser Ave #104 Dallas, TX | 1.0 | 1.0 | 500 | $1,095 | $2.19 | 9d | 1 | 0.40mi |
| 3152 Hudnall St Dallas, TX | 1.0 | 1.0 | 602 | $1,050 | $1.74 | 23d | 1 | 0.41mi |
| 5000 Bowser Ave Unit 213 Dallas, TX | 1.0 | 1.0 | 373 | $950 | $2.55 | 45d | 1 | 0.44mi |
| 5212 Fleetwood Oaks Ave #102 Dallas, TX | 1.0 | 1.0 | 698 | $1,250 | $1.79 | 22d | 1 | 0.44mi |
| 4335 Cedar Springs Rd Dallas, TX | 1.0–2.0 | 1.0–1.5 | 775 | $1,200 | $1.55 | 45d | 2 | 0.45mi |
| 5010 Bowser Ave Apt 106 Dallas, TX | — | 1.0 | 373 | $900 | $2.41 | 45d | 1 | 0.45mi |
| 2517 Amelia St Dallas, TX | 1.0 | 1.0 | 698 | $1,250 | $1.79 | 45d | 1 | 0.45mi |
| 5234 Fleetwood Oaks Ave #219 Dallas, TX | 1.0 | 1.0 | 698 | $1,500 | $2.15 | 45d | 1 | 0.49mi |
| 3301 Hudnall St Dallas, TX | 1.0 | 1.0 | 741 | $1,542 | $2.08 | 0d | 24 | 0.50mi |
| 2935 Wycliff Ave Dallas, TX | 1.0 | 1.0 | 621 | $1,660 | $2.67 | 45d | 1 | 0.50mi |
| 2935 Wycliff Ave Dallas, TX | 1.0 | 1.0 | 621 | $1,660 | $2.67 | 23d | 1 | 0.50mi |
HOA detail condo
- Monthly dues
- $440 · $5,280/yr
- Likely covers
- landscaping
- Assessments
- None detected in remarks — confirm with the listing agent.
Listing history 4 events
-
2026-04-30status Pending
-
2026-04-24historical Active Option Contract
-
2026-04-17$70,000 Active
-
1996-06-13soldstatus
ⓘ Source: listings_history table (triggers on properties + properties_extension) + one-shot
backfill from property_details.listing_events for pre-trigger history.
Tax reassessment forecast TX · Resets to sale price
- Current annual tax
- $2,814 · $235/mo
- Projected year-2 tax
- $2,814 · $235/mo
- Expected delta
- $0/yr ($0/mo · 0.0%)
ⓘ Screening estimate from a state-policy table — verify with the county assessor before closing.
Climate risk First Street
- Flood 1/10 Low FEMA zone X (unshaded) · 0% chance over 30 yrs
- Wildfire 1/10 Low
- Heat 7/10 Severe 7 d/yr ≥110°F today · 23 d/yr by 30 yrs out
- Wind 6/10 Major 27% chance of damaging wind over 30 yrs
- Air quality 3/10 Moderate 2 unhealthy d/yr today · 3 by 30 yrs out
Nearby sold comps map
Loading sold comps map…
Walkable amenities ~0.75 mi
Loading nearby amenities…
Taxation est. · year 1
- Rental income
- $16,893
- − Mortgage interest
- −$3,921
- − Property taxes
- −$2,814
- − Insurance
- −$350
- − Repairs & maintenance
- −$1,351
- − Management
- −$1,351
- − HOA
- −$5,280
- − Depreciation
- −$2,036
- Taxable loss
- −$211
- Est. tax savings @ 24.0%
- +$51
- After-tax cash flow
- $547/yr
For passive investors: Depreciation is non-cash, so a rental often shows a tax loss while cash-flowing — sheltering income. Rental losses are passive: they offset passive income freely, and up to $25,000/yr can offset ordinary (W-2) income if you actively participate and your MAGI is under $100k (phasing out to $0 by $150k); unused losses carry forward. On sale, claimed depreciation is recaptured at up to 25%, and gains may owe capital-gains tax (a 1031 exchange can defer both). Figures are a year-1 estimate at your 24.0% rate — not tax advice; consult a CPA.
Schools (NCES district)
- District
- Dallas ISD
- NCES district ID
- 4816230
- Math proficiency
- 31% ▼ -16.00%
- Reading proficiency
- 36% ▼ -4.00%
- Median HH income
- $42,881
- Composite
- 28.41/100
- National rank
- #6763
- State rank
- #559 of 826 in TX
Livability — Dallas
- Score
- 81/100
- State rank
- #24
- US rank
- #1380
Category grades
Schools grade is shown separately in the Schools card above.
Census & demographics
- Census place
- Dallas, TX
- County
- Dallas County · 2,612,404 people
- City population
- 1,168,437
- Metro
- Dallas-Fort Worth-Arlington, TX
- Population (ZIP)
- 23,934
- Household income
- $102,364
- Rent vs Own
- Severe rent burden
- 1475.0
Population outlook (Dallas County) Hauer SSP2
- Today (2025)
- 2,979,839 people
- By 2030
- 3,191,823 · +7.1%
- By 2040
- 3,619,611 · +21.5%
- By 2050
- 4,026,915 · +35.1%
- By 2075
- 4,957,073 · +66.4%
- By 2100
- 5,508,725 · +84.9%
Race, ethnicity, and origin ACS 2023
- Neighborhood character
- Diverse neighborhood (Simpson 0.65)
- Race & ethnicity
- White 53% Hispanic / Latino 21% Black 12% Two or more races 12% Asian 10%
- Hispanic origin (detail)
- Mexican 13% Puerto Rican 2%
- Common ancestry
- Lithuanian 4% Italian 3% Slovak 2%
- Foreign-born
- 18% · Canada, Vietnam, China
- Languages at home
- 70% English-only · Spanish 18% Other Indo-European 3% Chinese 2%
Political lean MEDSL · Dallas
- 2024 margin
- Strong D (+22.2) · D 60.2% · R 38.0% · Other 1.8%
- 2008→2024 swing
- +6.9pp toward D · 2008: 15.3pp · 2024: 22.2pp
- All cycles
- 2024: D+22.2 2020: D+31.6 2016: D+26.2 2012: D+15.4 2008: D+15.3
Not yet ingested
- Civics
- —
Market trends
- HPI YoY
- ▼ -124.82%
- Current HPI
- 214.4564
- Rent YoY
- ▲ 0.56%
- Metro
- Dallas-Fort Worth-Arlington, TX
- State GDP YoY
- ▲ 3.95%
- F500 in state
- 110
Industry mix (Fortune 500 HQ in TX)
| Industry | F500 HQs | Revenue |
|---|---|---|
| Energy | 16 | $1,198B |
|
||
| Technology | 5 | $198B |
|
||
| Engineering / Construction | 4 | $72B |
|
||
| Energy Services | 3 | $60B |
|
||
| Utilities | 3 | $41B |
|
||
| Healthcare | 2 | $330B |
|
||
Price history
4 events — show timeline
- 2026-04-30 Pending — NTREIS
- 2026-04-24 Contingent — NTREIS
- 2026-04-17 Listed $70,000 NTREIS
- 1996-06-13 Sold (Public Records) — Public Records
Property tax history
+5.7%/yrLatest (2025): $2,814 · -1.6% YoY. Source: county tax records.
Cash-flow waterfall
monthlySold comps — $/sqft
last 12 mo · ≤1 miLoading sold comps…