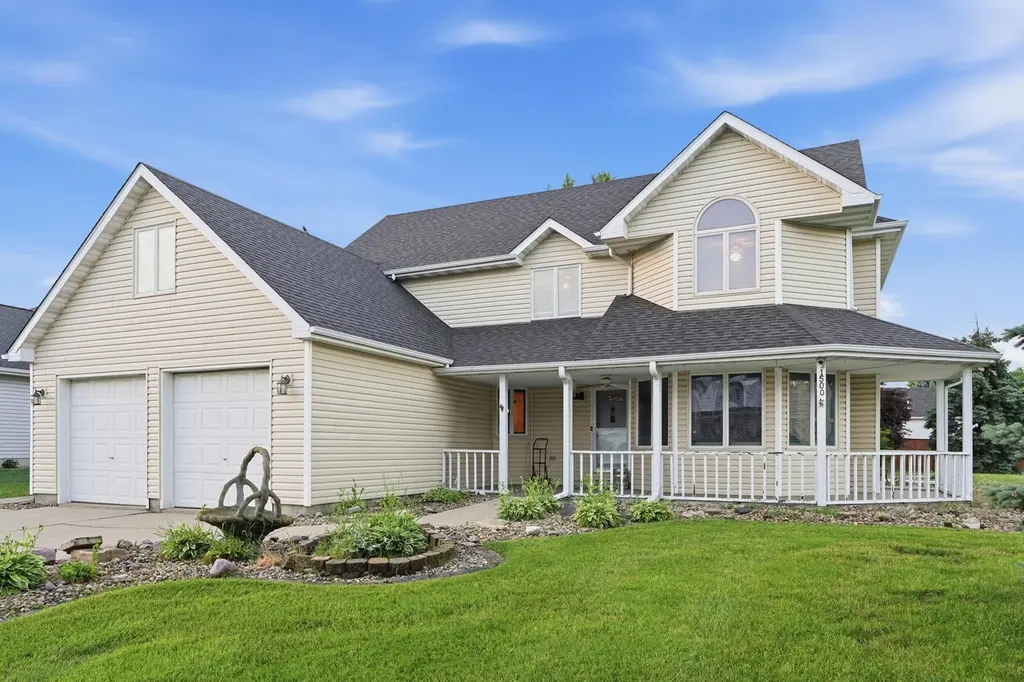
1500 W 96th Pl · Crown Point, IN
Flood risk 1/10 · Minimal
- FEMA flood zone
- X (unshaded)
- Chance of flooding over 30 yrs
- 0.0%
- Est. flood insurance / yr
- $473 – $860
Fire risk 1/10 · Minimal
- Est. fire insurance / yr
- $717 – $1,331
Heat risk 3/10 · Minor
- Hot days now (above 102°F)
- 7 days/yr
- Hot days in 30 yrs
- 16 days/yr
Wind risk 2/10 · Minimal
- Chance of severe wind over 30 yrs
- —
Air-quality risk 2/10 · Minimal
- Unhealthy air days now
- 1 days/yr
- Unhealthy air days in 30 yrs
- 3 days/yr
Risk factors via First Street. Map © Google.
Why this score? — see what drove the D+ grade
The composite is a weighted blend of 9 inputs, each scored 0–100. Each bar is that input's sub-score; the figure is the points it added to the 100-point composite (weight × sub-score).
- Cash flow +14.9/30.0
- ARV discount +13.1/15.0
- DSCR +4.5/10.0
- Livability +3.9/5.0
- 1% rule +3.4/10.0
- Rent growth +3.1/5.0
- Schools +2.6/10.0
- Condition / age +2.5/5.0
- Appreciation +0.0/10.0
$324,900
🖨 Deal sheet (PDF) 📄 Offer letter ✓ Due diligence
Listing remarks
This Spacious and Open Concept, 4 Bedroom, 3 Bath, 2,600'+ Above Grade Sq. ft. , 2 Story Home, with a Full Unfinished Basement and Attached 2.5 Car Garage is Located in Popular Stratford Estates. The Main Floor Great Room has a Gas Fireplace, Vaulted Ceiling, and 2 skylights. Kitchen has Loads of Oak Cabinets and is open to the Great Room and to the Patio with Large deck. Formal Living Room could be Formal Dining Room. Main Floor Primary Bedroom with Ensuite-Bath Features a Whirlpool Tub, Separate Shower, and Walk-in Closet. The Primary Bedroom also has Private Access to the Deck. The Upper Level Includes 3 Bedrooms, Loft Area, and a Bonus Room over the Garage. Additional Features Include:
Key facts
- Large deck
- Oak cabinets
- Open concept
Tags
Property features AI
Finance
- Other: Vacant occupant status
Exterior
- Parking: Garage with approximately 2.5 parking spaces
- Utilities: Public water; Public sewer
- Home design: Two-story home; Built in 1991
- Construction: Above-grade finished living area reported by assessor
- Exterior features: Neighborhood view; Full, unfinished basement
Interior
- Kitchen: Microwave; Refrigerator; Range
- Bedrooms: Primary bedroom; Bedroom 2; Bedroom 3; Bedroom 4; Bonus room (additional flexible space); Other room
- Bathrooms: Two full bathrooms; One half bathroom
- Heating & cooling: Forced air heating (natural gas); Ceiling fan(s)
- Interior features: Vaulted ceilings; Great Room fireplace
- Laundry & utility: Laundry room
Neighborhood map
What this means for you Summary
Snapshot
- This is a 4-bed/2.5-bath single-family listed at $325k.
Deal economics
- At list price, monthly cash flow is $92 ($1k/yr) — positive.
- The deal already cash-flows at list — no discount required.
- To meet the 1% rule (rent ≥ 1% of price), the offer needs to be $274k (15.5% below list).
- Recommended offer: $274k (15.5% below list) — sets the bar for 1% rule.
- Cap rate 6.6% vs local median 3.4% in Crown Point — top-decile yield for the area; either an underpriced asset or a hidden risk that comps aren't pricing in. Stress-test before assuming the spread holds.
Location & tenants
- Location reads 77/100 on livability (#45 in IN, #3,244 nationally) — a middle-class / working-renter tenant base. Strengths: crime A+, employment A+, cost of living A+; Watch: amenities F, commute F, health & safety D-.
- Merrillville Community School Corporation (suburban): math 22% / reading 36% proficiency, ranked #240 of 301 in IN (top 80%) — low school quality limits family demand, transient renter base, plan for 1-2y turnover.
- Zoned schools: Homer Iddings Elementary School (math 22% / reading 22%, grade F, #790 of 994 statewide, top 81%, 488 students, 69% FRL); Pierce Middle School (math 18% / reading 37%, grade F, #230 of 330 statewide, top 71%, 919 students, 70% FRL); Merrillville High School (math 19% / reading 55%, grade F, #247 of 369 statewide, top 70%, 2,042 students, 64% FRL) — zoned schools average 68% FRL vs 50% district-wide (18 pts higher); higher-poverty schools than district average — tighter screening recommended.
- Market conditions: Rents rising (+2.5%/yr); 753 active listings in the ZIP; 2 comparable units currently listed for rent nearby; solid renter incomes; 1,642 units permitted in Lake County in 2024 (14 in 5+ unit buildings).
- This rent runs 31% of the median local income ($108k/yr) — at the standard rent-burdened threshold; future hikes will face affordability resistance.
Forward outlook
- Local home prices are declining (-3.0%/yr); year-one equity from $2k of loan paydown is wiped out by about $10k of value loss. Plan a longer hold.
- Lake County population projected to shrink 7% by 2050 — rents likely to lag national; underwrite the cash flow, not the appreciation.
Negotiation context
- Only 3 days on market — expect competitive offers; lowballing is unlikely to land.
- 4 sale attempts since 21y ago with the ask held roughly flat each time — persistent listings suggest the price (not the market) is what's stuck; bring a comps-based counter.
Questions for the listing agent
- Is there a deadline driving the sale (1031 exchange, divorce, estate, relocation)? That informs how much negotiation room exists.
- Schools are B-rated — typically a magnet for longer-tenancy family renters. What's the average tenant stay here, and is there a school-zone premium baked into asking?
- The area grade is low — what's the realistic commute time and amenity access for the typical tenant pool here? Any planned neighborhood developments (good or bad) we should know about?
- What's the average days-on-market for RENTAL listings here right now (not sales)? A rising rental-DOM trend means longer vacancies and softer asking-rent achievability than the comps imply.
- What's the recent tenant-quality profile in this submarket — average credit score on applications, eviction rate, late-payment / NSF rate, and stable-employment percentage? A property-management company in the area should have these aggregated.
- How much new for-sale + rental construction is in the pipeline within 1–3 miles? Heavy new supply typically softens prices + rents 12–24 months out; constrained supply supports both.
Investment metrics
- 1% rule
- 0.84% ✗
- Cap rate
- 6.63%
- Cash-on-cash
- 1.22%
- DSCR
- 1.05
- GRM
- 9.9
CMA / ARV
- ARV (on-the-fly)
- $370,720
- Comps found
- 12
Show comp detail 12 sales within ~0.75 mi
| Address | Dist | Beds/Ba | Sqft | Sold | Price | $/sf | Match |
|---|---|---|---|---|---|---|---|
| 1518 W 96th Pl | 0.05mi | 4/2.5 | 2,978 (+12%) | 3mo | $392,000 | $132 | 74 |
| 1270 97th Pl | 0.31mi | 5/2.5 (+1) | 2,438 (-8%) | 4mo | $372,500 | $153 | 64 |
| 1403 Edgewater Rd | 0.58mi | 5/2.5 (+1) | 2,638 (-0%) | 17mo | $400,000 | $152 | 53 |
| 1810 W 95th Ct | 0.54mi | 3/2.0 (-1) | 2,420 (-9%) | 2mo | $232,500 | $96 | 52 |
| 10046 Polk Ct | 0.57mi | 4/3.0 | 2,850 (+8%) | 8mo | $399,999 | $140 | 52 |
| 1547 W 99th Ave | 0.41mi | 3/2.0 (-1) | 2,274 (-14%) | 0mo | $335,000 | $147 | 50 |
| 1522 W 99th Ave | 0.36mi | 4/2.0 | 2,254 (-15%) | 10mo | $350,000 | $155 | 48 |
| 2150 W 95th Ave | 0.66mi | 4/2.5 | 2,300 (-13%) | 2mo | $320,000 | $139 | 46 |
| 9339 Cleveland St | 0.66mi | 4/2.5 | 2,880 (+9%) | 14mo | $305,000 | $106 | 43 |
| 1243 Center Ross Rd | 0.67mi | 4/3.0 | 3,035 (+15%) | 3mo | $455,000 | $150 | 40 |
| 1342 Corning Dr | 0.69mi | 5/3.0 (+1) | 2,814 (+6%) | 14mo | $376,000 | $134 | 39 |
| 9540 Cleveland St | 0.63mi | 3/2.0 (-1) | 2,371 (-10%) | 10mo | $290,000 | $122 | 38 |
Match score weights: distance 35% · size 25% · config 20% · recency 20%. Top-matched comps best support the ARV.
Projected returns pro-forma
-3.0% appreciation · 2.53% rent growth · sell at horizon
- IRR
- -14.9%
- Equity multiple
- 0.47×
- Total profit
- $-48,112
- Equity at exit
- $48,444
- IRR
- -7.0%
- Equity multiple
- 0.56×
- Total profit
- $-39,817
- Equity at exit
- $28,091
Cash invested: $90,972 (down + closing). Projections, not guarantees.
Landlord ↔ Tenant lean methodology
- Overall (STATE)
- 90 Strongly Landlord-Friendly
- State Indiana
- 90 Strongly Landlord-Friendly · R+11
- County
- — inherits STATE
- City
- — inherits STATE
ZIP-level market 46307
- Rents YoY
- 2.5%
- Active inventory
- 753
- Price-to-rent
- 9.9×
Monthly cashflow live
- Estimated rent
- $2,745 medium interval (Pro) →
- Mortgage (P&I)
- −$1,704
- Tax from tax record
- −$237 /mo · $2,841/yr
- Insurance
- −$135
- HOA
- −$0
- Vacancy / Maint / Mgmt
- −$576
- Net cashflow
- $92
Break-even live
Sensitivity live
| Price | -10% $276 | -5% $184 | +0% $92 | +5% $1 | +10% $-91 |
|---|---|---|---|---|---|
| Rent | -10% $-124 | -5% $-16 | +0% $92 | +5% $201 | +10% $309 |
| Rate | -1.0pp $256 | -0.5pp $175 | base $92 | +0.5pp $8 | +1.0pp $-77 |
UW: 25.0% down · 7.5% · 30yr · 1.5% tax · 5.0% vac · 8.0% maint · 8.0% mgmt
Financing live
Cash to close
- Down payment
- $81,225
- Closing costs
- $9,747
- Reserves months
- —
- Total cash needed
- —
Loan-product check · same deal, 3 products live
Conventional
25% down · 7.5% · 30yr
- Down + closing
- —
- Monthly P&I
- —
- Monthly cashflow
- —
- DSCR
- —
- Eligible?
- —
Personal DTI + credit; lowest rate.
DSCR
20% down · 8.5% · 30yr
- Down + closing
- —
- Monthly P&I
- —
- Monthly cashflow
- —
- DSCR
- —
- Eligible?
- —
No personal income docs; deal must DSCR.
Hard money
10% down · 12.0% · 12mo
- Down + closing
- —
- Monthly P&I
- —
- Monthly cashflow
- —
- DSCR
- —
- Eligible?
- —
Short-term bridge; refi at stabilization.
Rent comps 2 comps
| Address | Beds | Baths | Sqft | Rent | $/sqft | DOM | Units | Dist |
|---|---|---|---|---|---|---|---|---|
| 1400 W 97th Ave Crown Point, IN | 3.0 | 3.0 | 1928 | $2,800 | $1.45 | 8d | 1 | 0.17mi |
| 925 W 89th Pl Merrillville, IN | 3.0 | 2.5 | 2292 | $2,850 | $1.24 | 9d | 1 | 0.89mi |
Listing history 3 events
-
2026-06-21days on market $324,900 Active 3 DOM
-
2026-06-18remarks 699-char remark
-
2026-06-18$324,900 Active 1 DOM
ⓘ Source: listings_history table (triggers on properties + properties_extension) + one-shot
backfill from property_details.listing_events for pre-trigger history.
Tax reassessment forecast IN · Partial reset (capped growth)
- Current annual tax
- $2,841 · $237/mo
- Projected year-2 tax
- $2,841 · $237/mo
- Expected delta
- $0/yr ($0/mo · 0.0%)
ⓘ Screening estimate from a state-policy table — verify with the county assessor before closing.
Climate risk First Street
- Flood 1/10 Low FEMA zone X (unshaded) · 0% chance over 30 yrs
- Wildfire 1/10 Low
- Heat 3/10 Moderate 7 d/yr ≥102°F today · 16 d/yr by 30 yrs out
- Wind 2/10 Low
- Air quality 2/10 Low 1 unhealthy d/yr today · 3 by 30 yrs out
Nearby sold comps map
Loading sold comps map…
Walkable amenities ~0.75 mi
Loading nearby amenities…
Taxation est. · year 1
- Rental income
- $32,938
- − Mortgage interest
- −$18,199
- − Property taxes
- −$2,841
- − Insurance
- −$1,624
- − Repairs & maintenance
- −$2,635
- − Management
- −$2,635
- − Depreciation
- −$9,452
- Taxable loss
- −$4,449
- Est. tax savings @ 24.0%
- +$1,068
- After-tax cash flow
- $2,177/yr
For passive investors: Depreciation is non-cash, so a rental often shows a tax loss while cash-flowing — sheltering income. Rental losses are passive: they offset passive income freely, and up to $25,000/yr can offset ordinary (W-2) income if you actively participate and your MAGI is under $100k (phasing out to $0 by $150k); unused losses carry forward. On sale, claimed depreciation is recaptured at up to 25%, and gains may owe capital-gains tax (a 1031 exchange can defer both). Figures are a year-1 estimate at your 24.0% rate — not tax advice; consult a CPA.
Schools (NCES district)
- District
- Merrillville Community School Corporation
- NCES district ID
- 1809690
- Math proficiency
- 22% ▼ -17.00%
- Reading proficiency
- 36% ▼ -8.00%
- Median HH income
- $54,401
- Composite
- 25.74/100
- National rank
- #7375
- State rank
- #240 of 301 in IN
Livability — Crown Point
- Score
- 77/100
- State rank
- #45
- US rank
- #3244
Category grades
Schools grade is shown separately in the Schools card above.
Census & demographics
- Census place
- Crown Point, IN
- County
- Lake County · 422,878 people
- City population
- 71,673
- Metro
- Chicago-Naperville-Elgin, IL-IN-WI
- Population (ZIP)
- 71,673
- Household income
- $107,800
- Rent vs Own
- Severe rent burden
- 705.0
Population outlook (Lake County) Hauer SSP2
- Today (2025)
- 484,026 people
- By 2030
- 478,091 · -1.2%
- By 2040
- 462,974 · -4.3%
- By 2050
- 449,894 · -7.1%
- By 2075
- 436,169 · -9.9%
- By 2100
- 426,607 · -11.9%
Race, ethnicity, and origin ACS 2023
- Neighborhood character
- Predominantly White (76%)
- Race & ethnicity
- White 76% Hispanic / Latino 12% Two or more races 10% Black 7% Asian 2%
- Hispanic origin (detail)
- Mexican 9% Puerto Rican 1%
- Common ancestry
- Romanian 12% Iranian 3% Lithuanian 2%
- Foreign-born
- 7% · Canada, Vietnam
- Languages at home
- 88% English-only · Spanish 5% Russian/Polish/Slavic 3% Other Indo-European 1%
Political lean MEDSL · Lake
- 2024 margin
- Lean D (+5.6) · D 52.1% · R 46.5% · Other 1.5%
- 2008→2024 swing
- -28.6pp toward R · 2008: 34.3pp · 2024: 5.6pp
- All cycles
- 2024: D+5.6 2020: D+15.1 2016: D+20.6 2012: D+31.0 2008: D+34.3
Not yet ingested
- Civics
- —
Market trends
- HPI YoY
- ▼ -164.91%
- Current HPI
- 226.0335
- Rent YoY
- ▲ 2.53%
- Metro
- Chicago-Naperville-Elgin, IL-IN-WI
- State GDP YoY
- ▲ 2.90%
- F500 in state
- 18
Industry mix (Fortune 500 HQ in IN)
| Industry | F500 HQs | Revenue |
|---|---|---|
| Industrial Machinery | 2 | $37B |
|
||
| Healthcare | 1 | $177B |
|
||
| Pharmaceuticals | 1 | $45B |
|
||
| Metals / Steel | 1 | $18B |
|
||
| Agriculture | 1 | $17B |
|
||
| Packaging | 1 | $12B |
|
||
Price history
+30.0% since first listed7 events — show timeline
- 2026-06-18 Listed $324,900 NIRA MLS as Distributed by MLS Grid
- 2008-07-16 Listing Removed — NIRA MLS as Distributed by MLS Grid
- 2007-04-04 Listed $225,000 NIRA MLS as Distributed by MLS Grid
- 2006-12-01 Listing Removed — NIRA MLS as Distributed by MLS Grid
- 2006-06-13 Listed $240,000 NIRA MLS as Distributed by MLS Grid
- 2005-11-17 Listing Removed — NIRA MLS as Distributed by MLS Grid
- 2005-05-16 Listed $249,900 NIRA MLS as Distributed by MLS Grid
Property tax history
+0.7%/yrLatest (2024): $2,841 · +3.7% YoY. Source: county tax records.
Cash-flow waterfall
monthlySold comps — $/sqft
last 12 mo · ≤1 miLoading sold comps…