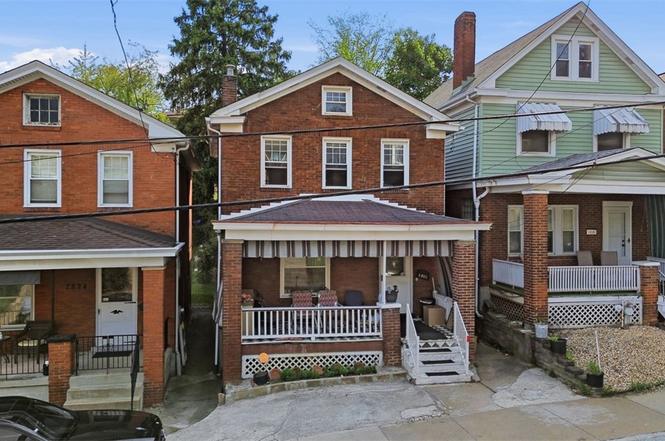
2822 Brentwood Ave · Brentwood, PA
Flood risk 5/10 · Moderate
- FEMA flood zone
- X (unshaded)
- Chance of flooding over 30 yrs
- 0.24%
- Est. flood insurance / yr
- $473 – $860
Fire risk 1/10 · Minimal
- Est. fire insurance / yr
- $511 – $949
Heat risk 4/10 · Minor
- Hot days now (above 96°F)
- 7 days/yr
- Hot days in 30 yrs
- 17 days/yr
Wind risk 2/10 · Minimal
- Chance of severe wind over 30 yrs
- —
Air-quality risk 3/10 · Minor
- Unhealthy air days now
- 3 days/yr
- Unhealthy air days in 30 yrs
- 5 days/yr
Risk factors via First Street. Map © Google.
Why this score? — see what drove the C grade
The composite is a weighted blend of 9 inputs, each scored 0–100. Each bar is that input's sub-score; the figure is the points it added to the 100-point composite (weight × sub-score).
- Cash flow +16.5/30.0
- ARV discount +15.0/15.0
- 1% rule +5.2/10.0
- DSCR +5.1/10.0
- Livability +4.0/5.0
- Rent growth +3.6/5.0
- Schools +3.4/10.0
- Condition / age +2.5/5.0
- Appreciation +0.0/10.0
$140,000
🖨 Deal sheet 📄 Offer letter ✓ Due diligence
Listing remarks
Great opportunity in the Brentwood Borough School District! This solid 3-bedroom brick home is conveniently located just minutes from Route 51 and the Liberty Tunnel. Enter through the inviting covered front porch into a spacious living room featuring beautiful hardwood floors and a cozy fireplace. The dining room is perfect for gatherings and opens seamlessly to the functional kitchen with an open island layout. The family room is truly the heart of the home, offering cathedral ceilings and easy access to the backyard—ideal for entertaining. The home also offers a permitted front concrete parking area, providing convenient off-street parking. Outside, the beautifully designed yard fe
Key facts
- 2,500 sq ft lot
- Parking
- Built 1926
Tags
Property features AI
Exterior
- Parking: Off-street parking (1 space)
- Home design: 2 stories; Resale property
- Construction: Brick construction; Asphalt roof
- Exterior features: Public transportation nearby
Interior
- Kitchen: Refrigerator; Stove
- Flooring: Laminate; Tile; Vinyl
- Bathrooms: 1 full bathroom; 1 half bathroom
- Heating & cooling: Forced air gas heating; Central air conditioning
- Interior features: Basement present; Laminate, tile, and vinyl flooring
- Laundry & utility: Washer; Dryer; Some gas appliances
Neighborhood map
What this means for you Summary
Snapshot
- This is a 3-bed/1.5-bath single-family listed at $140k.
Deal economics
- At list price, monthly cash flow is $82 ($978/yr) — positive.
- The deal already cash-flows at list — no discount required.
- Meets the 1% rule at list price ($1k rent vs $140k).
- Cap rate 7.0% vs local median 4.3% in Brentwood — top-decile yield for the area; either an underpriced asset or a hidden risk that comps aren't pricing in. Stress-test before assuming the spread holds.
Location & tenants
- Location reads 81/100 on livability (#178 in PA, #1,479 nationally) — a professional / high-income tenant draw. Strengths: schools A+, cost of living A+, housing A+; Watch: amenities C-.
- Brentwood Borough SD (suburban): math 29% / reading 50% proficiency, ranked #357 of 539 in PA (top 66%) — families likely to look elsewhere, expect single-tenant / working-renter base with shorter leases.
- Market conditions: Rents rising fast (+4.3%/yr); 117 active listings in the ZIP; 21 comparable units currently listed for rent nearby; rentals at typical pace (median 24d on market — plan ~3-4 weeks tenant-placement turnaround); solid renter incomes; 2,996 units permitted in Allegheny County in 2024 (1,588 in 5+ unit buildings).
Forward outlook
- Local home prices are declining (-3.0%/yr); year-one equity from $968 of loan paydown is wiped out by about $4k of value loss. Plan a longer hold.
Negotiation context
- Only 3 days on market — expect competitive offers; lowballing is unlikely to land.
- 9 sale attempts since 16y ago with the ask held roughly flat each time — persistent listings suggest the price (not the market) is what's stuck; bring a comps-based counter.
- Current owner paid $65k; list at $140k implies a 115% gain — meaningful room to come down on a strong offer.
Risks & watch-outs
- Watch-outs: built in 1926 — expect roof / HVAC / electrical / plumbing capex.
- Climate carrying-cost: moderate flood risk — expect insurance premiums to compound above CPI over the hold.
Questions for the listing agent
- Built in 1926 — when were the roof, HVAC, electrical panel, plumbing, and water heater last replaced?
- Is there a deadline driving the sale (1031 exchange, divorce, estate, relocation)? That informs how much negotiation room exists.
- Schools are A-rated — typically a magnet for longer-tenancy family renters. What's the average tenant stay here, and is there a school-zone premium baked into asking?
- What's the average days-on-market for RENTAL listings here right now (not sales)? A rising rental-DOM trend means longer vacancies and softer asking-rent achievability than the comps imply.
- What's the recent tenant-quality profile in this submarket — average credit score on applications, eviction rate, late-payment / NSF rate, and stable-employment percentage? A property-management company in the area should have these aggregated.
- How much new for-sale + rental construction is in the pipeline within 1–3 miles? Heavy new supply typically softens prices + rents 12–24 months out; constrained supply supports both.
Investment metrics
- 1% rule
- 1.02% ✓
- Cap rate
- 6.99%
- Cash-on-cash
- 2.50%
- DSCR
- 1.11
- GRM
- 8.2
CMA / ARV
- ARV (median comp)
- $182,486
- List price
- $140,000
- Delta
- -17.86%
- Verdict
- UNDERPRICED
- Comps
- 20 within 1.0 mi
Show comp detail 12 sales within ~0.75 mi
| Address | Dist | Beds/Ba | Sqft | Sold | Price | $/sf | Match |
|---|---|---|---|---|---|---|---|
| 3009 Brentwood Ave | 0.14mi | 3/1.0 | 1,344 (+5%) | 2mo | $213,000 | $158 | 82 |
| 51 Greenlee Rd | 0.27mi | 3/1.0 | 1,232 (-4%) | 0mo | $219,900 | $178 | 79 |
| 131 Stewart Ave | 0.30mi | 3/2.0 | 1,250 (-2%) | 4mo | $135,000 | $108 | 77 |
| 3223 Willett Rd | 0.55mi | 3/1.0 | 1,275 (-0%) | 4mo | $211,000 | $165 | 68 |
| 3215 Shadyway Dr | 0.50mi | 3/2.0 | 1,220 (-5%) | 0mo | $215,000 | $176 | 67 |
| 108 Bellanca Ave | 0.32mi | 3/1.0 | 1,162 (-9%) | 3mo | $168,000 | $145 | 65 |
| 3029 Churchview Ave | 0.36mi | 3/1.5 | 1,100 (-14%) | 1mo | $200,000 | $182 | 59 |
| 127 Duffland St | 0.72mi | 2/1.5 (-1) | 1,297 (+1%) | 1mo | $140,000 | $108 | 58 |
| 3210 Hazelhurst Ave | 0.58mi | 3/2.0 | 1,178 (-8%) | 3mo | $200,000 | $170 | 55 |
| 369 Maytide St | 0.59mi | 3/1.0 | 1,122 (-12%) | 1mo | $182,000 | $162 | 49 |
| 103 Munsey Ave | 0.70mi | 3/2.0 | 1,168 (-9%) | 3mo | $161,000 | $138 | 48 |
| 325 Outlook St | 0.57mi | 2/2.5 (-1) | 1,142 (-11%) | 0mo | $165,000 | $144 | 46 |
Match score weights: distance 35% · size 25% · config 20% · recency 20%. Top-matched comps best support the ARV.
Projected returns pro-forma
-3.0% appreciation · 4.33% rent growth · sell at horizon
- IRR
- -10.7%
- Equity multiple
- 0.60×
- Total profit
- $-15,496
- Equity at exit
- $20,874
- IRR
- 0.6%
- Equity multiple
- 1.04×
- Total profit
- $1,609
- Equity at exit
- $12,105
Cash invested: $39,200 (down + closing). Projections, not guarantees.
Landlord ↔ Tenant lean methodology
- Overall (STATE)
- 62 Landlord-Friendly
- State Pennsylvania
- 62 Landlord-Friendly · EVEN
- County
- — inherits STATE
- City
- — inherits STATE
ZIP-level market 15227
- Home prices YoY
- -27.5%
- Rents YoY
- 4.3%
- Active inventory
- 117
- Price-to-rent
- 8.2×
Monthly cashflow live
- Estimated rent
- $1,424 high interval (Pro) →
- Mortgage (P&I)
- −$734
- Tax from tax record
- −$251 /mo · $3,013/yr
- Insurance
- −$58
- HOA
- −$0
- Vacancy / Maint / Mgmt
- −$299
- Net cashflow
- $82
Break-even live
UW: 25.0% down · 7.5% · 30yr · 1.5% tax · 5.0% vac · 8.0% maint · 8.0% mgmt
Financing live
Cash to close
- Down payment
- $35,000
- Closing costs
- $4,200
- Reserves months
- —
- Total cash needed
- —
Loan-product check · same deal, 3 products live
Conventional
25% down · 7.5% · 30yr
- Down + closing
- —
- Monthly P&I
- —
- Monthly cashflow
- —
- DSCR
- —
- Eligible?
- —
Personal DTI + credit; lowest rate.
DSCR
20% down · 8.5% · 30yr
- Down + closing
- —
- Monthly P&I
- —
- Monthly cashflow
- —
- DSCR
- —
- Eligible?
- —
No personal income docs; deal must DSCR.
Hard money
10% down · 12.0% · 12mo
- Down + closing
- —
- Monthly P&I
- —
- Monthly cashflow
- —
- DSCR
- —
- Eligible?
- —
Short-term bridge; refi at stabilization.
Rent comps 21 comps
| Address | Beds | Baths | Sqft | Rent | $/sqft | DOM | Units | Dist |
|---|---|---|---|---|---|---|---|---|
| 2823 Clermont Ave Pittsburgh, PA | 3.0 | 1.0 | 1354 | $1,490 | $1.10 | 20d | 1 | 0.05mi |
| 2721 Pyramid Ave Pittsburgh, PA | 3.0 | 1.0 | 1560 | $1,550 | $0.99 | 7d | 1 | 0.05mi |
| 2733-2735 Pyramid Ave Pittsburgh, PA | 2.0 | 1.0 | 1028 | $1,295 | $1.26 | 43d | 1 | 0.05mi |
| 2811 Brownsville Rd Unit 4 Brentwood, PA | 2.0 | 1.0 | 1250 | $995 | $0.80 | 43d | 1 | 0.07mi |
| 2769 Churchview Ave Unit 9 Pittsburgh, PA | 2.0 | 1.0 | 1200 | $1,095 | $0.91 | 43d | 1 | 0.13mi |
| 2940 Brevard Ave Pittsburgh, PA | 3.0 | 1.5 | 1176 | $1,475 | $1.25 | 43d | 1 | 0.19mi |
| 3224 Bookman Ave Unit 1 Pittsburgh, PA | 2.0 | 2.0 | 1207 | $1,550 | $1.28 | 43d | 1 | 0.38mi |
| 139 W Bellecrest Ave Brentwood, PA | 1.0–3.0 | 1.0 | 775 | $1,450 | $1.87 | 2d | 12 | 0.44mi |
| 416 Jacobson Dr Brentwood, PA | 2.0 | 1.0 | 1150 | $1,050 | $0.91 | 23d | 1 | 0.64mi |
| 3341 Recker Dr Pittsburgh, PA | 3.0 | 2.0 | 875 | $1,790 | $2.05 | 43d | 1 | 0.73mi |
| 3341 Recker Dr Pittsburgh, PA | 3.0 | 2.0 | 1174 | $1,750 | $1.49 | 23d | 1 | 0.73mi |
| 453 Greenlee Rd Pittsburgh, PA | 3.0 | 1.0 | 1176 | $1,495 | $1.27 | 43d | 1 | 0.83mi |
| 3367 Jameson Dr Brentwood, PA | 2.0–3.0 | 1.0 | 975 | $1,435 | $1.47 | 7d | 7 | 0.87mi |
| 1053 Edward Dr Pittsburgh, PA | 3.0 | 1.0 | 1163 | $1,700 | $1.46 | 23d | 1 | 0.91mi |
| 616 Lane Way Pittsburgh, PA | 2.0 | 1.0 | 1228 | $1,690 | $1.38 | 23d | 1 | 1.05mi |
| 616 Lane Way Pittsburgh, PA | 2.0 | 1.0 | 1228 | $1,690 | $1.38 | 43d | 1 | 1.05mi |
| 960 Agnew Rd Pittsburgh, PA | 3.0 | 2.0 | 950 | $1,295 | $1.36 | 14d | 1 | 1.15mi |
| 973 Agnew Rd Pittsburgh, PA | 4.0 | 3.0 | 1532 | $2,395 | $1.56 | 7d | 1 | 1.19mi |
| 4588 E Willock Rd Pittsburgh, PA | 3.0 | 1.5 | 1500 | $1,500 | $1.00 | 4d | 1 | 1.23mi |
| 2355 Glenbury St Pittsburgh, PA | 4.0 | 2.0 | 1350 | $2,300 | $1.70 | 4d | 1 | 1.25mi |
| 1526 Parkline Dr Pittsburgh, PA | 3.0 | 1.0 | 942 | $1,475 | $1.56 | 7d | 44 | 1.35mi |
Listing history 21 events
-
2026-06-18days on market $140,000 Active 3 DOM
-
2026-06-17days on market $140,000 Active 2 DOM
-
2026-06-16pricestatusdays on market $140,000 Active 1 DOM
-
2026-05-09price $149,900 892-char remark
-
2026-04-30$154,900 Active 892-char remark
-
2026-04-23price $164,900
-
2026-04-23status Active
-
2026-04-08price $169,900
-
2026-03-27price $170,000
-
2026-03-13price $169,900
-
2026-02-04$189,900 Active
-
2018-08-01soldstatus $65,000 Sold
-
2018-06-25historical Contingent
-
2018-06-06$72,500 Active
-
2017-02-14historical Expired
-
2017-01-31historical Contingent
-
2016-11-18price $58,900
-
2016-09-28$64,900 Active
-
2011-12-05$79,500
-
2011-04-26$79,900
-
2010-06-30$84,900
ⓘ Source: listings_history table (triggers on properties + properties_extension) + one-shot
backfill from property_details.listing_events for pre-trigger history.
Tax reassessment forecast PA · Partial reset (capped growth)
- Current annual tax
- $3,013 · $251/mo
- Projected year-2 tax
- $3,013 · $251/mo
- Expected delta
- $0/yr ($0/mo · 0.0%)
ⓘ Screening estimate from a state-policy table — verify with the county assessor before closing.
Climate risk First Street
- Flood 5/10 Major FEMA zone X (unshaded) · 24% chance over 30 yrs
- Wildfire 1/10 Low
- Heat 4/10 Moderate 7 d/yr ≥96°F today · 17 d/yr by 30 yrs out
- Wind 2/10 Low
- Air quality 3/10 Moderate 3 unhealthy d/yr today · 5 by 30 yrs out
Nearby sold comps map
Loading sold comps map…
Walkable amenities ~0.75 mi
Loading nearby amenities…
Taxation est. · year 1
- Rental income
- $17,090
- − Mortgage interest
- −$7,842
- − Property taxes
- −$3,013
- − Insurance
- −$700
- − Repairs & maintenance
- −$1,367
- − Management
- −$1,367
- − Depreciation
- −$4,073
- Taxable loss
- −$1,272
- Est. tax savings @ 24.0%
- +$305
- After-tax cash flow
- $1,283/yr
For passive investors: Depreciation is non-cash, so a rental often shows a tax loss while cash-flowing — sheltering income. Rental losses are passive: they offset passive income freely, and up to $25,000/yr can offset ordinary (W-2) income if you actively participate and your MAGI is under $100k (phasing out to $0 by $150k); unused losses carry forward. On sale, claimed depreciation is recaptured at up to 25%, and gains may owe capital-gains tax (a 1031 exchange can defer both). Figures are a year-1 estimate at your 24.0% rate — not tax advice; consult a CPA.
Schools (NCES district)
- District
- Brentwood Borough SD
- NCES district ID
- 4204140
- Math proficiency
- 29% ▼ -15.00%
- Reading proficiency
- 50% ▼ -15.00%
- Median HH income
- $49,260
- Composite
- 33.92/100
- National rank
- #5341
- State rank
- #357 of 539 in PA
Livability — Brentwood
- Score
- 81/100
- State rank
- #178
- US rank
- #1479
Category grades
Schools grade is shown separately in the Schools card above.
Census & demographics
- Census place
- Brentwood, PA
- County
- Allegheny County · 1,022,028 people
- City population
- 28,460
- Metro
- Pittsburgh, PA
- Population (ZIP)
- 28,460
- Household income
- $75,448
- Rent vs Own
- Severe rent burden
- 780.0
Population outlook (Allegheny County) Hauer SSP2
- Today (2025)
- 1,250,282 people
- By 2030
- 1,256,482 · +0.5%
- By 2040
- 1,256,318 · +0.5%
- By 2050
- 1,244,169 · -0.5%
- By 2075
- 1,197,693 · -4.2%
- By 2100
- 1,093,187 · -12.6%
Race, ethnicity, and origin ACS 2023
- Neighborhood character
- Predominantly White (80%)
- Race & ethnicity
- White 80% Black 7% Asian 6% Two or more races 5% Hispanic / Latino 1%
- Common ancestry
- Romanian 9% Scotch-Irish 2% Slovak 1%
- Foreign-born
- 9% · India, Canada, China
- Languages at home
- 89% English-only · Other Indo-European 6% Other Asian/Pacific 1% French/Haitian/Cajun 1%
Political lean MEDSL · Allegheny
- 2024 margin
- Strong D (+20.3) · D 59.7% · R 39.4%
- 2008→2024 swing
- +4.8pp toward D · 2008: 15.5pp · 2024: 20.3pp
- All cycles
- 2024: D+20.3 2020: D+20.4 2016: D+16.4 2012: D+14.4 2008: D+15.5
Not yet ingested
- Civics
- —
Market trends
- HPI YoY
- ▼ -92.53%
- Current HPI
- 243.6383
- Rent YoY
- ▲ 4.33%
- Metro
- Pittsburgh, PA
- State GDP YoY
- ▲ 1.68%
- F500 in state
- 34
Industry mix (Fortune 500 HQ in PA)
| Industry | F500 HQs | Revenue |
|---|---|---|
| Healthcare | 2 | $309B |
|
||
| Insurance | 2 | $27B |
|
||
| Telecommunications / Media | 1 | $124B |
|
||
| Industrial Distribution | 1 | $22B |
|
||
| Financial Services | 1 | $20B |
|
||
| Chemicals / Materials | 1 | $18B |
|
||
Price history
+64.9% since first listed19 events — show timeline
- 2026-06-15 Listed $140,000 West Penn MLS
- 2026-05-09 Price Changed $149,900 West Penn MLS
- 2026-04-30 Listed $154,900 West Penn MLS
- 2026-04-23 Price Changed $164,900 West Penn MLS
- 2026-04-23 Relisted — West Penn MLS
- 2026-04-08 Price Changed $169,900 West Penn MLS
- 2026-03-27 Price Changed $170,000 West Penn MLS
- 2026-03-13 Price Changed $169,900 West Penn MLS
- 2026-02-04 Listed $189,900 West Penn MLS
- 2018-08-01 Sold (MLS) $65,000 West Penn MLS
- 2018-06-25 Contingent — West Penn MLS
- 2018-06-06 Listed $72,500 West Penn MLS
- 2017-02-14 Delisted — West Penn MLS
- 2017-01-31 Contingent — West Penn MLS
- 2016-11-18 Price Changed $58,900 West Penn MLS
- 2016-09-28 Listed $64,900 West Penn MLS
- 2011-12-05 Listed $79,500 West Penn MLS
- 2011-04-26 Listed $79,900 West Penn MLS
- 2010-06-30 Listed $84,900 West Penn MLS
Property tax history
+2.7%/yrLatest (2026): $3,013 · +4.6% YoY. Source: county tax records.
Cash-flow waterfall
monthlySold comps — $/sqft
last 12 mo · ≤1 miLoading sold comps…