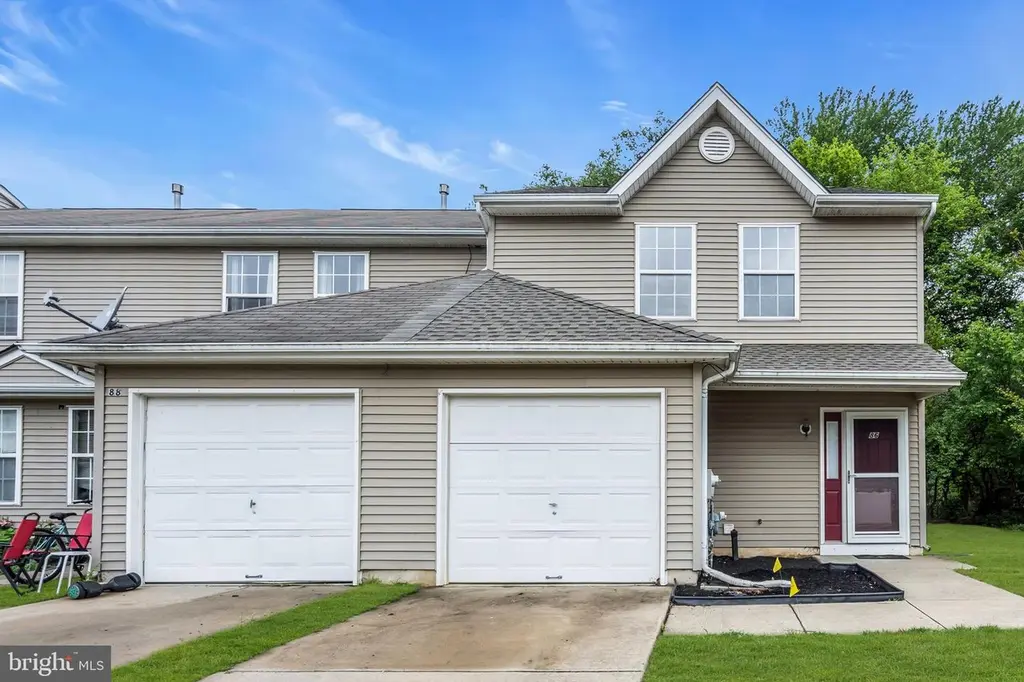
86 High Meadows Dr · Sicklerville, NJ
Flood risk 1/10 · Minimal
- FEMA flood zone
- X (unshaded)
- Chance of flooding over 30 yrs
- 0.0%
- Est. flood insurance / yr
- $507 – $1,088
Fire risk 4/10 · Minor
- Est. fire insurance / yr
- $526 – $976
Heat risk 6/10 · Moderate
- Hot days now (above 104°F)
- 7 days/yr
- Hot days in 30 yrs
- 14 days/yr
Wind risk 6/10 · Moderate
- Chance of severe wind over 30 yrs
- 67.0%
Air-quality risk 3/10 · Minor
- Unhealthy air days now
- 2 days/yr
- Unhealthy air days in 30 yrs
- 4 days/yr
Risk factors via First Street. Map © Google.
Why this score? — see what drove the D- grade
The composite is a weighted blend of 9 inputs, each scored 0–100. Each bar is that input's sub-score; the figure is the points it added to the 100-point composite (weight × sub-score).
- Cash flow +13.3/30.0
- ARV discount +4.5/15.0
- 1% rule +4.4/10.0
- DSCR +4.0/10.0
- Rent growth +3.4/5.0
- Livability +2.5/5.0
- Condition / age +2.5/5.0
- Schools +2.3/10.0
- Appreciation +0.0/10.0
$260,000
🖨 Deal sheet (PDF) 📄 Offer letter ✓ Due diligence
Listing remarks
End unit. Wooded backdrop. Priced to make you look twice. Set in a quiet section of the community, this bright and open 3-bedroom townhome offers something buyers rarely find at this price point—privacy. As an end unit backing to the woods, you get added light, space, and a natural buffer that most homes here simply don’t have. Inside, the layout feels open and functional, with fresh paint throughout and a brand-new roof already taken care of—two major upgrades that remove the big-ticket worries for the next owner. The kitchen and flooring offer a chance to update over time, giving you the flexibility to personalize without paying a premium upfront. The garage has been con
Key facts
- Wooded backdrop
- Fresh paint
- Brand new roof
Tags
Property features AI
Finance
- HOA & community: Monthly HOA fee of $60; HOA covers lawn maintenance and management
Exterior
- Parking: Driveway parking (2 spaces); On-street parking; Total of 2 garage/parking spaces
- Utilities: Public water; Public sewer; Natural gas for heating, cooling, and hot water
- Home design: Condominium; End of Row/Townhouse structure; Asphalt roof
- Construction: Aluminum siding; Other foundation; Estimated year built
- Exterior features: End-of-row townhouse setting; Above-grade other structures
Interior
- Kitchen: Cooktop; Dishwasher; Refrigerator
- Bedrooms: Three bedrooms on the upper level
- Flooring: Carpet
- Bathrooms: One full bathroom; One half bathroom
- Heating & cooling: Forced air heating (natural gas); Central air conditioning (natural gas)
- Interior features: Open floor plan; Dining area; Walk-in closet(s); Tub with shower; Carpeted areas
- Laundry & utility: Washer; Dryer
Neighborhood map
What this means for you Summary
Snapshot
- This is a 3-bed/1.5-bath townhouse listed at $260k.
Deal economics
- At list price, monthly cash flow is $-2 ($-24/yr) — negative.
- To cash-flow at today's rent, offer at most $260k (0.1% below list).
- To meet the 1% rule (rent ≥ 1% of price), the offer needs to be $244k (6.1% below list).
- Recommended offer: $244k (6.1% below list) — sets the bar for 1% rule.
- Cap rate 6.3% vs local median 4.7% in Sicklerville — top-decile yield for the area; either an underpriced asset or a hidden risk that comps aren't pricing in. Stress-test before assuming the spread holds.
Location & tenants
- Location reads: area grade D — affects rentability + tenant quality, not the cash-flow math above.
- Winslow Township School District (suburban): math 11% / reading 36% proficiency, ranked #387 of 472 in NJ (top 82%) — low school quality limits family demand, transient renter base, plan for 1-2y turnover.
- Zoned schools: Winslow Township Elementary School Three (math 8% / reading 22%, grade F, #1,124 of 1,303 statewide, top 88%, 457 students, 48% FRL); Winslow Township Middle School (math 14% / reading 42%, grade F, #335 of 431 statewide, top 79%, 764 students, 46% FRL); Winslow Township High School (math 10% / reading 36%, grade F, #337 of 399 statewide, top 85%, 1,273 students, 42% FRL) — zoned schools at 45% FRL track the district average.
- Market conditions: Rents rising (+3.4%/yr); 335 active listings in the ZIP; 13 comparable units currently listed for rent nearby; rentals at typical pace (median 17d on market — plan ~3-4 weeks tenant-placement turnaround); solid renter incomes; 1,018 units permitted in Camden County in 2024 (509 in 5+ unit buildings).
Forward outlook
- Local home prices are declining (-3.0%/yr); year-one equity from $2k of loan paydown is wiped out by about $8k of value loss. Plan a longer hold.
- Camden County population projected to shrink 8% by 2050 — rents likely to lag national; underwrite the cash flow, not the appreciation.
Negotiation context
- Only 8 days on market — expect competitive offers; lowballing is unlikely to land.
- 8 sale attempts since 22y ago with the ask held roughly flat each time — persistent listings suggest the price (not the market) is what's stuck; bring a comps-based counter.
- Current owner paid $180k; 44% above their basis — modest negotiation headroom, anchor on the comps not their cost.
Risks & watch-outs
- Climate carrying-cost: major wind risk, 67% chance of damaging wind over 30y; extreme-heat days projected 7→14/yr by 2055 (HVAC capex compounding) — expect insurance premiums to compound above CPI over the hold.
Questions for the listing agent
- What do current leases actually rent for vs. the listed asking? Can we see a recent rent roll and the last 12 months of T-12 income?
- What does the HOA fee cover, when was the last increase, and are there any pending special assessments or reserve-fund shortfalls?
- Is there a deadline driving the sale (1031 exchange, divorce, estate, relocation)? That informs how much negotiation room exists.
- The area grade is low — what's the realistic commute time and amenity access for the typical tenant pool here? Any planned neighborhood developments (good or bad) we should know about?
- What's the average days-on-market for RENTAL listings here right now (not sales)? A rising rental-DOM trend means longer vacancies and softer asking-rent achievability than the comps imply.
- What's the recent tenant-quality profile in this submarket — average credit score on applications, eviction rate, late-payment / NSF rate, and stable-employment percentage? A property-management company in the area should have these aggregated.
- How much new for-sale + rental construction is in the pipeline within 1–3 miles? Heavy new supply typically softens prices + rents 12–24 months out; constrained supply supports both.
Investment metrics
- 1% rule
- 0.94% ✗
- Cap rate
- 6.28%
- Cash-on-cash
- -0.03%
- DSCR
- 1.00
- GRM
- 8.9
CMA / ARV
- ARV (on-the-fly)
- $243,672
- Comps found
- 12
Show comp detail 12 sales within ~0.75 mi
| Address | Dist | Beds/Ba | Sqft | Sold | Price | $/sf | Match |
|---|---|---|---|---|---|---|---|
| 7 Lyons Ct | 0.25mi | 3/1.5 | 1,152 (+1%) | 1mo | $263,000 | $228 | 86 |
| 57 Vanderbilt Ct | 0.53mi | 3/1.5 | 1,120 (-2%) | 3mo | $230,000 | $205 | 69 |
| 54 Victoria Manor Ct | 0.61mi | 3/1.5 | 1,120 (-2%) | 1mo | $224,000 | $200 | 68 |
| 13 Lamont Ct | 0.31mi | 3/1.5 | 1,034 (-10%) | 4mo | $229,999 | $222 | 66 |
| 175 Villa Knoll Ct | 0.75mi | 3/1.5 | 1,140 (-0%) | 0mo | $245,000 | $215 | 64 |
| 195 Villa Knoll Ct | 0.73mi | 3/1.5 | 1,140 (-0%) | 2mo | $230,000 | $202 | 64 |
| 21 Locust Ct | 0.35mi | 3/1.0 | 1,034 (-10%) | 2mo | $220,000 | $213 | 64 |
| 18 Langdon Ct | 0.36mi | 3/1.0 | 1,034 (-10%) | 3mo | $225,000 | $218 | 62 |
| 9 Lawrence Ct | 0.41mi | 3/1.0 | 1,034 (-10%) | 0mo | $234,900 | $227 | 62 |
| 157 Villa Knoll Ct | 0.74mi | 3/1.5 | 1,160 (+1%) | 3mo | $205,000 | $177 | 60 |
| 17 Lawrence Ct | 0.39mi | 3/1.0 | 1,034 (-10%) | 7mo | $210,000 | $203 | 58 |
| 12 Villanova Ct | 0.47mi | 3/1.5 | 1,280 (+12%) | 3mo | $213,500 | $167 | 56 |
Match score weights: distance 35% · size 25% · config 20% · recency 20%. Top-matched comps best support the ARV.
Projected returns pro-forma
-3.0% appreciation · 3.41% rent growth · sell at horizon
- IRR
- -15.8%
- Equity multiple
- 0.44×
- Total profit
- $-41,129
- Equity at exit
- $38,767
- IRR
- -6.6%
- Equity multiple
- 0.57×
- Total profit
- $-31,312
- Equity at exit
- $22,480
Cash invested: $72,800 (down + closing). Projections, not guarantees.
Landlord ↔ Tenant lean methodology
- Overall (STATE)
- 21 Tenant-Leaning
- State New Jersey
- 21 Tenant-Leaning · D+6
- County
- — inherits STATE
- City
- — inherits STATE
ZIP-level market 08081
- Rents YoY
- 3.4%
- Active inventory
- 335
- Price-to-rent
- 8.9×
Monthly cashflow live
- Estimated rent
- $2,441 high interval (Pro) →
- Mortgage (P&I)
- −$1,363
- Tax from tax record
- −$399 /mo · $4,786/yr
- Insurance
- −$108
- HOA
- −$60
- Vacancy / Maint / Mgmt
- −$513
- Net cashflow
- $-2
Break-even live
Sensitivity live
| Price | -10% $145 | -5% $72 | +0% $-2 | +5% $-76 | +10% $-149 |
|---|---|---|---|---|---|
| Rent | -10% $-195 | -5% $-98 | +0% $-2 | +5% $94 | +10% $191 |
| Rate | -1.0pp $129 | -0.5pp $64 | base $-2 | +0.5pp $-69 | +1.0pp $-138 |
UW: 25.0% down · 7.5% · 30yr · 1.5% tax · 5.0% vac · 8.0% maint · 8.0% mgmt
Financing live
Cash to close
- Down payment
- $65,000
- Closing costs
- $7,800
- Reserves months
- —
- Total cash needed
- —
Loan-product check · same deal, 3 products live
Conventional
25% down · 7.5% · 30yr
- Down + closing
- —
- Monthly P&I
- —
- Monthly cashflow
- —
- DSCR
- —
- Eligible?
- —
Personal DTI + credit; lowest rate.
DSCR
20% down · 8.5% · 30yr
- Down + closing
- —
- Monthly P&I
- —
- Monthly cashflow
- —
- DSCR
- —
- Eligible?
- —
No personal income docs; deal must DSCR.
Hard money
10% down · 12.0% · 12mo
- Down + closing
- —
- Monthly P&I
- —
- Monthly cashflow
- —
- DSCR
- —
- Eligible?
- —
Short-term bridge; refi at stabilization.
Rent comps 13 comps
| Address | Beds | Baths | Sqft | Rent | $/sqft | DOM | Units | Dist |
|---|---|---|---|---|---|---|---|---|
| 110 High Meadows Dr Sicklerville, NJ | 3.0 | 1.5 | 1408 | $2,400 | $1.70 | 45d | 1 | 0.09mi |
| 16 High Meadows Dr Sicklerville, NJ | 3.0 | 1.5 | 1353 | $2,600 | $1.92 | 45d | 1 | 0.13mi |
| 3 Lawrence Ct Sicklerville, NJ | 2.0 | 1.0 | 968 | $1,850 | $1.91 | 0d | 1 | 0.39mi |
| 27 Villanova Ct Sicklerville, NJ | 3.0 | 1.5 | 1280 | $2,300 | $1.80 | 4d | 1 | 0.47mi |
| 28 Melwood Ct Sicklerville, NJ | 3.0 | 1.5 | 1370 | $2,500 | $1.82 | 17d | 1 | 0.61mi |
| 25 Memphis Ct Sicklerville, NJ | 3.0 | 1.5 | 1450 | $2,000 | $1.38 | 20d | 1 | 0.61mi |
| 4 Milstone Ct Sicklerville, NJ | 3.0 | 1.5 | 1462 | $2,400 | $1.64 | 3d | 1 | 0.61mi |
| 8 Vernon Ct Sicklerville, NJ | 3.0 | 1.5 | 1300 | $1,900 | $1.46 | 5d | 1 | 0.62mi |
| 28 Magnolia Ct Sicklerville, NJ | 3.0 | 1.5 | 1450 | $2,000 | $1.38 | 45d | 1 | 0.75mi |
| 46 Magnolia Ct Sicklerville, NJ | 2.0 | 1.5 | 1370 | $2,200 | $1.61 | 4d | 1 | 0.81mi |
| 9 Marcia Ct Unit 9 Sicklerville, NJ | 3.0 | 1.5 | 1462 | $2,000 | $1.37 | 0d | 1 | 0.86mi |
| 41 Hampton Gate Dr Sicklerville, NJ | 2.0 | 1.5 | 1272 | $2,100 | $1.65 | 20d | 1 | 1.06mi |
| 55 Hampton Gate Dr Sicklerville, NJ | 2.0 | 1.5 | 1272 | $2,000 | $1.57 | 45d | 1 | 1.06mi |
HOA detail
- Monthly dues
- $60 · $720/yr
Listing history 8 events
-
2026-06-10status $260,000 Pending 8 DOM
-
2026-06-09days on market $260,000 Active 8 DOM
-
2026-06-08days on market $260,000 Active 7 DOM
-
2026-06-07days on market $260,000 Active 6 DOM
-
2026-06-04days on market $260,000 Active 3 DOM
-
2026-06-03days on market $260,000 Active 2 DOM
-
2026-06-02remarks 681-char remark
-
2026-06-02$260,000 Active 1 DOM
ⓘ Source: listings_history table (triggers on properties + properties_extension) + one-shot
backfill from property_details.listing_events for pre-trigger history.
Tax reassessment forecast NJ · Partial reset (capped growth)
- Current annual tax
- $4,786 · $399/mo
- Projected year-2 tax
- $5,630 · $469/mo
- Expected delta
- +$844/yr (+$70/mo · 17.6%)
ⓘ Screening estimate from a state-policy table — verify with the county assessor before closing.
Climate risk First Street
- Flood 1/10 Low FEMA zone X (unshaded) · 0% chance over 30 yrs
- Wildfire 4/10 Moderate
- Heat 6/10 Major 7 d/yr ≥104°F today · 14 d/yr by 30 yrs out
- Wind 6/10 Major 67% chance of damaging wind over 30 yrs
- Air quality 3/10 Moderate 2 unhealthy d/yr today · 4 by 30 yrs out
Nearby sold comps map
Loading sold comps map…
Walkable amenities ~0.75 mi
Loading nearby amenities…
Taxation est. · year 1
- Rental income
- $29,295
- − Mortgage interest
- −$14,564
- − Property taxes
- −$4,786
- − Insurance
- −$1,300
- − Repairs & maintenance
- −$2,344
- − Management
- −$2,344
- − HOA
- −$720
- − Depreciation
- −$7,564
- Taxable loss
- −$4,326
- Est. tax savings @ 24.0%
- +$1,038
- After-tax cash flow
- $1,014/yr
For passive investors: Depreciation is non-cash, so a rental often shows a tax loss while cash-flowing — sheltering income. Rental losses are passive: they offset passive income freely, and up to $25,000/yr can offset ordinary (W-2) income if you actively participate and your MAGI is under $100k (phasing out to $0 by $150k); unused losses carry forward. On sale, claimed depreciation is recaptured at up to 25%, and gains may owe capital-gains tax (a 1031 exchange can defer both). Figures are a year-1 estimate at your 24.0% rate — not tax advice; consult a CPA.
Schools (NCES district)
- District
- Winslow Township School District
- NCES district ID
- 3418060
- Math proficiency
- 11% ▼ -17.00%
- Reading proficiency
- 36% ▼ -5.00%
- Median HH income
- $70,254
- Composite
- 22.65/100
- National rank
- #8057
- State rank
- #387 of 472 in NJ
Livability — Sicklerville
No livability data for this city. (Only ~50 U.S. cities are tracked.)
Census & demographics
- Census place
- Sicklerville, NJ
- County
- Camden County · 407,624 people
- City population
- 50,264
- Metro
- Philadelphia-Camden-Wilmington, PA-NJ-DE-MD
- Population (ZIP)
- 50,264
- Household income
- $105,800
- Rent vs Own
- Severe rent burden
- 979.0
Population outlook (Camden County) Hauer SSP2
- Today (2025)
- 507,964 people
- By 2030
- 502,182 · -1.1%
- By 2040
- 485,602 · -4.4%
- By 2050
- 465,630 · -8.3%
- By 2075
- 419,986 · -17.3%
- By 2100
- 369,492 · -27.3%
Race, ethnicity, and origin ACS 2023
- Neighborhood character
- Diverse neighborhood (Simpson 0.65)
- Race & ethnicity
- White 47% Black 34% Two or more races 9% Hispanic / Latino 9% Asian 4%
- Hispanic origin (detail)
- Puerto Rican 5%
- Common ancestry
- Romanian 6% Slovak 2% Iranian 1%
- Foreign-born
- 8% · Canada, China, South Korea
- Languages at home
- 90% English-only · Spanish 4% Other Indo-European 1% Tagalog/Filipino 1%
Political lean MEDSL · Camden
- 2024 margin
- Strong D (+27.4) · D 63.0% · R 35.5% · Other 1.5%
- 2008→2024 swing
- -8.8pp toward R · 2008: 36.2pp · 2024: 27.4pp
- All cycles
- 2024: D+27.4 2020: D+33.5 2016: D+32.4 2012: D+36.6 2008: D+36.2
Not yet ingested
- Civics
- —
Market trends
- HPI YoY
- ▼ -176.48%
- Current HPI
- 303.1017
- Rent YoY
- ▲ 3.41%
- Metro
- Philadelphia-Camden-Wilmington, PA-NJ-DE-MD
- State GDP YoY
- ▲ 2.05%
- F500 in state
- 34
Industry mix (Fortune 500 HQ in NJ)
| Industry | F500 HQs | Revenue |
|---|---|---|
| Consumer Goods | 3 | $31B |
|
||
| Pharmaceuticals | 2 | $153B |
|
||
| Technology | 2 | $21B |
|
||
| Insurance | 2 | $20B |
|
||
| Healthcare | 2 | $19B |
|
||
| Financial Services | 1 | $70B |
|
||
Price history
+108.0% since first listed18 events — show timeline
- 2026-06-01 Listed $260,000 BRIGHT MLS
- 2010-04-01 Listing Removed — BRIGHT MLS
- 2009-12-30 Listing Removed — BRIGHT MLS
- 2009-12-30 Listed $139,900 BRIGHT MLS
- 2009-07-21 Listed $139,900 BRIGHT MLS
- 2009-02-25 Listing Removed — BRIGHT MLS
- 2008-08-25 Listed $184,999 BRIGHT MLS
- 2008-08-22 Listing Removed — BRIGHT MLS
- 2008-03-22 Listed $184,999 BRIGHT MLS
- 2007-02-01 Sold (Public Records) $180,000 Public Records
- 2006-12-13 Sold (MLS) $180,000 BRIGHT MLS
- 2006-11-21 Listing Removed — BRIGHT MLS
- 2006-09-27 Listing Removed — BRIGHT MLS
- 2006-09-25 Listed $180,000 BRIGHT MLS
- 2006-07-22 Listed $177,000 BRIGHT MLS
- 2005-02-18 Sold (Public Records) $125,000 Public Records
- 2004-10-01 Sold (MLS) $125,000 BRIGHT MLS
- 2004-08-07 Listed $125,000 BRIGHT MLS
Property tax history
+2.1%/yrLatest (2025): $4,786 · +1.9% YoY. Source: county tax records.
Cash-flow waterfall
monthlySold comps — $/sqft
last 12 mo · ≤1 miLoading sold comps…