 🏗️ New Construction
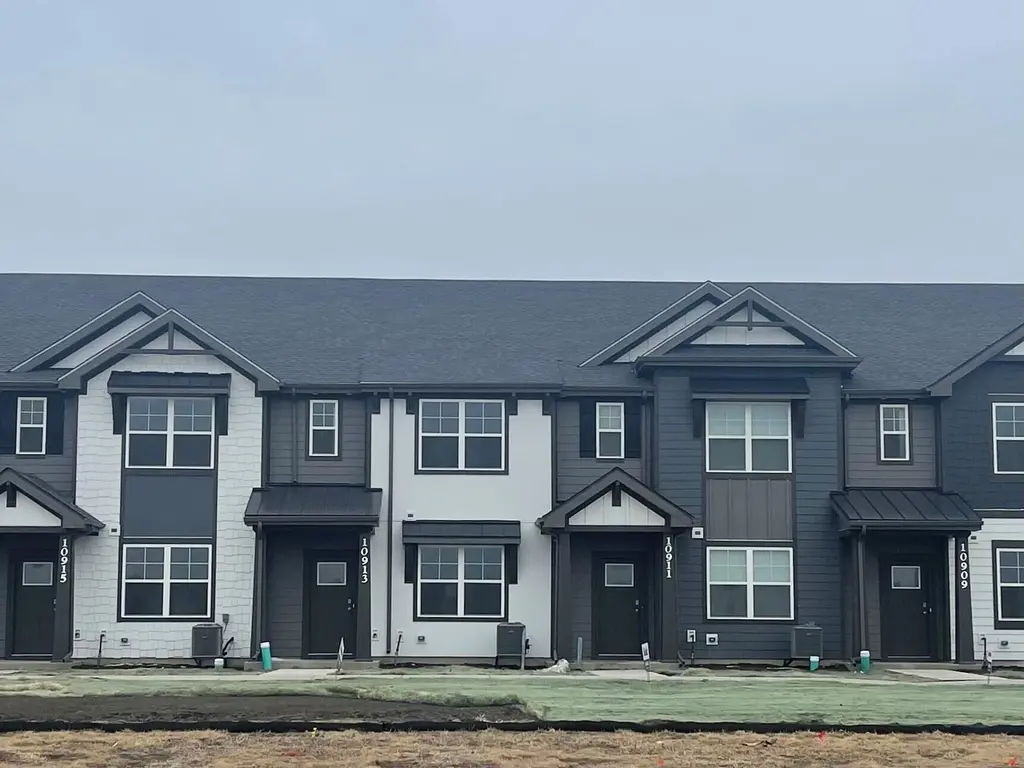
10913 Remington Pl · St. John, IN
Flood risk 1/10 · Minimal
- FEMA flood zone
- X (unshaded)
- Chance of flooding over 30 yrs
- 0.0%
- Est. flood insurance / yr
- $507 – $1,088
Fire risk 1/10 · Minimal
- Est. fire insurance / yr
- $717 – $1,331
Heat risk 3/10 · Minor
- Hot days now (above 101°F)
- 7 days/yr
- Hot days in 30 yrs
- 16 days/yr
Wind risk 2/10 · Minimal
- Chance of severe wind over 30 yrs
- 1.0%
Air-quality risk 2/10 · Minimal
- Unhealthy air days now
- 1 days/yr
- Unhealthy air days in 30 yrs
- 1 days/yr
Risk factors via First Street. Map © Google.
Why this score? — see what drove the D grade
The composite is a weighted blend of 9 inputs, each scored 0–100. Each bar is that input's sub-score; the figure is the points it added to the 100-point composite (weight × sub-score).
- Cash flow +13.4/30.0
- ARV discount +7.5/15.0
- Condition / age +4.8/5.0
- 1% rule +4.6/10.0
- Schools +4.5/10.0
- DSCR +4.0/10.0
- Rent growth +2.5/5.0
- Livability +2.5/5.0
- Appreciation +0.0/10.0
$299,990
🖨 Deal sheet (PDF) 📄 Offer letter ✓ Due diligence
Listing remarks
Discover yourself at 10913 Remington Place, St John Indiana, a beautiful new townhome in our Maple Gate community. This townhome is move-in READY! Make this townhome yours for the holidays! Homesite includes a fully sodded yard that is maintained throughout the year as well as snow removal in the winter. This Norfolk townhome plan offers over 1,500 square feet of living space with 3 bedrooms plus a loft, 2.5 baths, a mudroom and a 2-car garage. As soon as you step inside, you'll be greeted by our open concept living area, featuring luxury vinyl plank and 9' ceilings throughout the main living areas. The expansive kitchen overlooks the dining and great room areas, making it the ideal space t
Key facts
- $200 HOA
- 2 garage spots
- Built 2025
Neighborhood map
What this means for you Summary
Snapshot
- This is a 3-bed/2.5-bath townhouse listed at $300k. Condition is rated excellent.
Deal economics
- At list price, monthly cash flow is $5 ($58/yr) — positive.
- To cash-flow at today's rent, offer at most $291k (3.1% below list).
- To meet the 1% rule (rent ≥ 1% of price), the offer needs to be $280k (6.8% below list).
- Recommended offer: $280k (6.8% below list) — sets the bar for 1% rule.
- Cap rate 6.3% vs local median 3.6% in St. John — top-decile yield for the area; either an underpriced asset or a hidden risk that comps aren't pricing in. Stress-test before assuming the spread holds.
Location & tenants
- Location reads: area grade D — affects rentability + tenant quality, not the cash-flow math above.
- Hanover Community School Corporation (suburban): math 49% / reading 53% proficiency, ranked #38 of 301 in IN (top 13%) — acceptable for families but not a draw, mixed tenant base, ~2y average lease; only 20% free/reduced lunch — higher-income household profile.
- Zoned schools: Lincoln Elementary School (math 57% / reading 57%, grade C+, #172 of 994 statewide, top 18%, 312 students, 14% FRL); Hanover Central Middle School (math 44% / reading 47%, grade D+, #79 of 330 statewide, top 24%, 650 students, 25% FRL); Hanover Central High School (math 47% / reading 72%, grade C+, #49 of 369 statewide, top 16%, 782 students, 22% FRL) — zoned schools at 20% FRL track the district average.
- Market conditions: 262 active listings in the ZIP; 5 comparable units currently listed for rent nearby; rentals lingering (median 46d on market — plan ~5-8 weeks vacancy on turnover, expect pricing pressure); 60% of comp listings sitting > 30 days — soft ceiling on asking rent; 1,642 units permitted in Lake County in 2024 (14 in 5+ unit buildings).
Forward outlook
- Local home prices are declining (-3.0%/yr); year-one equity from $2k of loan paydown is wiped out by about $9k of value loss. Plan a longer hold.
- Lake County population projected to shrink 7% by 2050 — rents likely to lag national; underwrite the cash flow, not the appreciation.
Negotiation context
- Only 0 days on market — expect competitive offers; lowballing is unlikely to land.
Questions for the listing agent
- What does the HOA fee cover, when was the last increase, and are there any pending special assessments or reserve-fund shortfalls?
- Is there a deadline driving the sale (1031 exchange, divorce, estate, relocation)? That informs how much negotiation room exists.
- The area grade is low — what's the realistic commute time and amenity access for the typical tenant pool here? Any planned neighborhood developments (good or bad) we should know about?
- What's the average days-on-market for RENTAL listings here right now (not sales)? A rising rental-DOM trend means longer vacancies and softer asking-rent achievability than the comps imply.
- What's the recent tenant-quality profile in this submarket — average credit score on applications, eviction rate, late-payment / NSF rate, and stable-employment percentage? A property-management company in the area should have these aggregated.
- How much new for-sale + rental construction is in the pipeline within 1–3 miles? Heavy new supply typically softens prices + rents 12–24 months out; constrained supply supports both.
Investment metrics
- 1% rule
- 0.96% ✗
- Cap rate
- 6.31%
- Cash-on-cash
- 0.07%
- DSCR
- 1.00
- GRM
- 8.6
CMA / ARV
- ARV (on-the-fly)
- $289,896
- Comps found
- 12
Show comp detail 12 sales within ~0.75 mi
| Address | Dist | Beds/Ba | Sqft | Sold | Price | $/sf | Match |
|---|---|---|---|---|---|---|---|
| 8958 Remington Way | 0.03mi | 3/2.5 | 1,542 (0%) | 0mo | $293,990 | $191 | 98 |
| 8959 Remington Way | 0.03mi | 3/2.5 | 1,543 (+0%) | 0mo | $306,490 | $199 | 98 |
| 8956 Remington Way | 0.01mi | 3/2.5 | 1,543 (+0%) | 2mo | $290,165 | $188 | 98 |
| 8954 Remington Way | 0.05mi | 3/2.5 | 1,542 (0%) | 1mo | $293,990 | $191 | 97 |
| 8952 Remington Way | 0.06mi | 3/2.5 | 1,542 (0%) | 1mo | $303,990 | $197 | 97 |
| 10915 Remington Pl | 0.01mi | 3/2.5 | 1,542 (0%) | 4mo | $289,990 | $188 | 96 |
| 10907 Remington Pl | 0.05mi | 3/2.5 | 1,542 (0%) | 2mo | $288,990 | $187 | 96 |
| 9346 W 107th Ln | 0.44mi | 2/2.0 (-1) | 1,550 (+0%) | 0mo | $325,000 | $210 | 71 |
| 8737 Clover Ln | 0.25mi | 3/2.5 | 1,756 (+14%) | 1mo | $309,000 | $176 | 65 |
| 8746 Clover Ln | 0.25mi | 3/2.0 | 1,756 (+14%) | 5mo | $322,340 | $184 | 59 |
| 8690 Larkspur Ln | 0.33mi | 3/2.5 | 1,751 (+14%) | 4mo | $307,000 | $175 | 58 |
| 8700 Larkspur Ln | 0.32mi | 3/2.5 | 1,758 (+14%) | 7mo | $315,000 | $179 | 56 |
Match score weights: distance 35% · size 25% · config 20% · recency 20%. Top-matched comps best support the ARV.
Projected returns pro-forma
-3.0% appreciation · 3.0% rent growth · sell at horizon
- IRR
- -16.1%
- Equity multiple
- 0.43×
- Total profit
- $-46,505
- Equity at exit
- $43,224
- IRR
- -7.7%
- Equity multiple
- 0.51×
- Total profit
- $-39,431
- Equity at exit
- $25,065
Cash invested: $81,171 (down + closing). Projections, not guarantees.
Landlord ↔ Tenant lean methodology
- Overall (STATE)
- 90 Strongly Landlord-Friendly
- State Indiana
- 90 Strongly Landlord-Friendly · R+11
- County
- — inherits STATE
- City
- — inherits STATE
ZIP-level market 46373
- Home prices YoY
- -23.8%
- Active inventory
- 262
- Price-to-rent
- 8.9×
Monthly cashflow live
- Estimated rent
- $2,795 high interval (Pro) →
- Mortgage (P&I)
- −$1,520
- Tax est. 1.5%
- −$362 /mo · $4,348/yr
- Insurance
- −$121
- HOA
- −$200
- Vacancy / Maint / Mgmt
- −$587
- Net cashflow
- $5
Break-even live
Sensitivity live
| Price | -10% $205 | -5% $105 | +0% $5 | +5% $-95 | +10% $-196 |
|---|---|---|---|---|---|
| Rent | -10% $-216 | -5% $-106 | +0% $5 | +5% $115 | +10% $226 |
| Rate | -1.0pp $151 | -0.5pp $79 | base $5 | +0.5pp $-70 | +1.0pp $-147 |
UW: 25.0% down · 7.5% · 30yr · 1.5% tax · 5.0% vac · 8.0% maint · 8.0% mgmt
Financing live
Cash to close
- Down payment
- $72,474
- Closing costs
- $8,697
- Reserves months
- —
- Total cash needed
- —
Loan-product check · same deal, 3 products live
Conventional
25% down · 7.5% · 30yr
- Down + closing
- —
- Monthly P&I
- —
- Monthly cashflow
- —
- DSCR
- —
- Eligible?
- —
Personal DTI + credit; lowest rate.
DSCR
20% down · 8.5% · 30yr
- Down + closing
- —
- Monthly P&I
- —
- Monthly cashflow
- —
- DSCR
- —
- Eligible?
- —
No personal income docs; deal must DSCR.
Hard money
10% down · 12.0% · 12mo
- Down + closing
- —
- Monthly P&I
- —
- Monthly cashflow
- —
- DSCR
- —
- Eligible?
- —
Short-term bridge; refi at stabilization.
Rent comps 5 comps
| Address | Beds | Baths | Sqft | Rent | $/sqft | DOM | Units | Dist |
|---|---|---|---|---|---|---|---|---|
| 8769 W 108th Ln Saint John, IN | 3.0 | 2.5 | 1758 | $2,775 | $1.58 | 45d | 1 | 0.19mi |
| 8754 Clover Ln Saint John, IN | 3.0 | 2.5 | 1756 | $2,675 | $1.52 | 45d | 1 | 0.23mi |
| 8726 Orchid Dr Saint John, IN | 3.0 | 2.5 | 1756 | $2,725 | $1.55 | 45d | 1 | 0.27mi |
| 8688 Larkspur Ln Saint John, IN | 3.0 | 2.5 | 1758 | $3,000 | $1.71 | 0d | 1 | 0.32mi |
| 10342 Adler Cv Saint John, IN | 3.0 | 2.0 | 1944 | $3,000 | $1.54 | 0d | 1 | 0.75mi |
HOA detail
- Monthly dues
- $200 · $2,400/yr
- Likely covers
- snow removal
Listing history 2 events
-
2026-03-20historical
-
2026-03-20$299,990
ⓘ Source: listings_history table (triggers on properties + properties_extension) + one-shot
backfill from property_details.listing_events for pre-trigger history.
Climate risk First Street
- Flood 1/10 Low FEMA zone X (unshaded) · 0% chance over 30 yrs
- Wildfire 1/10 Low
- Heat 3/10 Moderate 7 d/yr ≥101°F today · 16 d/yr by 30 yrs out
- Wind 2/10 Low 100% chance of damaging wind over 30 yrs
- Air quality 2/10 Low 1 unhealthy d/yr today · 1 by 30 yrs out
Nearby sold comps map
Loading sold comps map…
Walkable amenities ~0.75 mi
Loading nearby amenities…
Taxation est. · year 1
- Rental income
- $33,542
- − Mortgage interest
- −$16,239
- − Property taxes
- −$4,348
- − Insurance
- −$1,449
- − Repairs & maintenance
- −$2,683
- − Management
- −$2,683
- − HOA
- −$2,400
- − Depreciation
- −$8,433
- Taxable loss
- −$4,694
- Est. tax savings @ 24.0%
- +$1,127
- After-tax cash flow
- $1,184/yr
For passive investors: Depreciation is non-cash, so a rental often shows a tax loss while cash-flowing — sheltering income. Rental losses are passive: they offset passive income freely, and up to $25,000/yr can offset ordinary (W-2) income if you actively participate and your MAGI is under $100k (phasing out to $0 by $150k); unused losses carry forward. On sale, claimed depreciation is recaptured at up to 25%, and gains may owe capital-gains tax (a 1031 exchange can defer both). Figures are a year-1 estimate at your 24.0% rate — not tax advice; consult a CPA.
Condition & rehab AI · 13 photos
This move-in-ready townhouse in Maple Gate, St. John, Indiana, is in excellent condition with modern finishes and a well-maintained exterior. It offers a good return on investment with minimal updates needed.
Value-add opportunities
- Both Painting the exterior siding — Enhances curb appeal and can increase both resale and rental value
- Both Landscaping the front yard — Improves curb appeal and can increase both resale and rental value
Renovation cost estimate screening
Value-add ROI direction
- Both Painting the exterior siding — Enhances curb appeal and can increase both resale and rental value ↑
- Both Landscaping the front yard — Improves curb appeal and can increase both resale and rental value ↑
ⓘ Cost ranges are severity-bucket heuristics (US national rule-of-thumb). Get contractor quotes + a written scope before underwriting a rehab budget.
Schools (NCES district)
- District
- Hanover Community School Corporation
- NCES district ID
- 1804350
- Math proficiency
- 49% ▼ -11.00%
- Reading proficiency
- 53% ▼ -7.00%
- Median HH income
- $68,151
- Composite
- 45.34/100
- National rank
- #2637
- State rank
- #38 of 301 in IN
Livability — St. John
No livability data for this city. (Only ~50 U.S. cities are tracked.)
Census & demographics
- Census place
- St. John, IN
- City population
- 18,509
- Population (ZIP)
- 18,509
Population outlook (Lake County) Hauer SSP2
- Today (2025)
- 484,026 people
- By 2030
- 478,091 · -1.2%
- By 2040
- 462,974 · -4.3%
- By 2050
- 449,894 · -7.1%
- By 2075
- 436,169 · -9.9%
- By 2100
- 426,607 · -11.9%
Race, ethnicity, and origin ACS 2023
- Neighborhood character
- Predominantly White (82%)
- Race & ethnicity
- White 82% Hispanic / Latino 9% Two or more races 5% Black 3% Asian 2%
- Hispanic origin (detail)
- Mexican 7% Puerto Rican 1%
- Common ancestry
- Romanian 21% Iranian 6% Lithuanian 2%
- Foreign-born
- 6% · Canada
- Languages at home
- 89% English-only · Spanish 5% Russian/Polish/Slavic 4% Other Indo-European 1%
Political lean MEDSL · Lake
- 2024 margin
- Lean D (+5.6) · D 52.1% · R 46.5% · Other 1.5%
- 2008→2024 swing
- -28.6pp toward R · 2008: 34.3pp · 2024: 5.6pp
- All cycles
- 2024: D+5.6 2020: D+15.1 2016: D+20.6 2012: D+31.0 2008: D+34.3
Not yet ingested
- Civics
- —
Market trends
- HPI YoY
- ▼ -69.86%
- Current HPI
- 224.1176
- Rent YoY
- —
- Metro
- —
- State GDP YoY
- ▲ 2.90%
- F500 in state
- 18
Industry mix (Fortune 500 HQ in IN)
| Industry | F500 HQs | Revenue |
|---|---|---|
| Industrial Machinery | 2 | $37B |
|
||
| Healthcare | 1 | $177B |
|
||
| Pharmaceuticals | 1 | $45B |
|
||
| Metals / Steel | 1 | $18B |
|
||
| Agriculture | 1 | $17B |
|
||
| Packaging | 1 | $12B |
|
||
Price history
2 events — show timeline
- 2026-03-20 Listing Removed — NIRA MLS as Distributed by MLS Grid
- 2026-03-20 Listed $299,990 NIRA MLS as Distributed by MLS Grid
Cash-flow waterfall
monthlySold comps — $/sqft
last 12 mo · ≤1 miLoading sold comps…