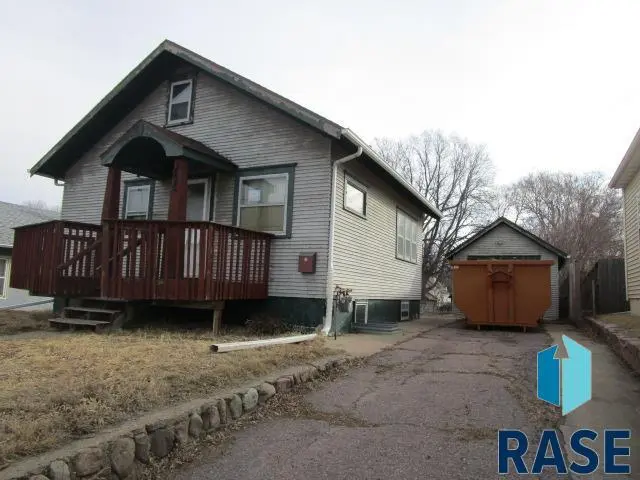
1506 S Cliff Ave Ave · Sioux Falls, SD
Flood risk 1/10 · Minimal
- FEMA flood zone
- X (unshaded)
- Chance of flooding over 30 yrs
- 0.0%
- Est. flood insurance / yr
- $473 – $860
Fire risk 1/10 · Minimal
- Est. fire insurance / yr
- $1,342 – $2,492
Heat risk 2/10 · Minimal
- Hot days now (above 99°F)
- 7 days/yr
- Hot days in 30 yrs
- 14 days/yr
Wind risk 2/10 · Minimal
- Chance of severe wind over 30 yrs
- —
Air-quality risk 2/10 · Minimal
- Unhealthy air days now
- 1 days/yr
- Unhealthy air days in 30 yrs
- 1 days/yr
Risk factors via First Street. Map © Google.
Why this score? — see what drove the B grade
The composite is a weighted blend of 9 inputs, each scored 0–100. Each bar is that input's sub-score; the figure is the points it added to the 100-point composite (weight × sub-score).
- Cash flow +30.0/30.0
- 1% rule +10.0/10.0
- DSCR +10.0/10.0
- ARV discount +7.5/15.0
- Livability +4.2/5.0
- Rent growth +3.8/5.0
- Schools +3.7/10.0
- Condition / age +2.5/5.0
- Appreciation +0.0/10.0
$76,950
🖨 Deal sheet 📄 Offer letter ✓ Due diligence
Listing remarks MLS
Lots Of Updates In This Conveniently Located Story & 1/2 * Furnace, Humidifier, A/C, 5 Yrs Old * Water Heater 2.5 Yrs * Updtd Elec W/ Circuit Breaker 10 Yrs Old * New Front Deck, New Patio Pavers, Privacy Fence! Shingles 3 Yrs * Egress Window * See Addendum
Key facts
- Private backyard
- Solid foundation
- 5,807 sq ft lot
Tags
Property features AI
Finance
- Financial info: $2,094.58 annual property tax
Exterior
- Parking: Detached garage; One garage space (13x18)
- Utilities: Public water; Public sewer
- Home design: Single-family residence; 1.5-story design; Irregular lot shape; Lot is owned; Inside city limits; Curb and gutter street
- Construction: Wood siding; Block foundation; Composition roof; Above-grade finished living area: 856; Below-grade unfinished area: 550
- Exterior features: Shed(s)
Interior
- Bedrooms: One bedroom on the upper level
- Flooring: Carpet flooring
- Bathrooms: One full bathroom
- Heating & cooling: Natural gas heat; Central air conditioning; One water heater
- Interior features: Master bedroom on the main floor; Full basement; 5 total rooms
Neighborhood map
What this means for you Summary
Snapshot
- This is a 2-bed/2.0-bath single-family listed at $77k.
Deal economics
- At list price, monthly cash flow is $387 ($5k/yr) — positive.
- The deal already cash-flows at list — no discount required.
- Meets the 1% rule at list price ($1k rent vs $77k).
- Recommended offer: $75k (3.0% below list) — sets the bar for market timing.
- Cap rate 12.3% vs local median 2.6% in Sioux Falls — top-decile yield for the area; either an underpriced asset or a hidden risk that comps aren't pricing in. Stress-test before assuming the spread holds.
Location & tenants
- Location reads 85/100 on livability (#3 in SD, #610 nationally) — a professional / high-income tenant draw. Strengths: amenities A+, commute A+, cost of living A+; Watch: crime F.
- Sioux Falls School District 49-5 (urban): math 39% / reading 48% proficiency, ranked #45 of 59 in SD (top 76%) — families likely to look elsewhere, expect single-tenant / working-renter base with shorter leases.
- Zoned schools: Susan B. Anthony Elementary - 66 (math 40% / reading 40%, grade F, #165 of 253 statewide, top 65%, 555 students, 43% FRL); Patrick Henry Middle School - 07 (math 42% / reading 53%, grade C-, #69 of 143 statewide, top 48%, 940 students, 24% FRL) — zoned schools at 34% FRL track the district average.
- Market conditions: Rents rising fast (+5.2%/yr); 171 active listings in the ZIP; 40 comparable units currently listed for rent nearby; rentals at typical pace (median 21d on market — plan ~3-4 weeks tenant-placement turnaround); 48% of comp listings sitting > 30 days — soft ceiling on asking rent; solid renter incomes; 2,425 units permitted in Minnehaha County in 2024 (1,367 in 5+ unit buildings).
Forward outlook
- Local home prices are declining (-3.0%/yr); year-one equity from $532 of loan paydown is wiped out by about $2k of value loss. Plan a longer hold.
- Minnehaha County population projected at +46% by 2050 — long-run rental-demand tailwind backs the buy-and-hold thesis.
- At projected returns (-3.0% appreciation + 5.2% rent growth), your $22k cash investment doubles in ~6 years — after that, you're playing with house money.
Negotiation context
- It's been on market 36 days — a 3% lower offer ($75k) is reasonable based on typical stale-listing flexibility.
- 2 sale attempts since 20y ago with the ask held roughly flat each time — persistent listings suggest the price (not the market) is what's stuck; bring a comps-based counter.
Risks & watch-outs
- Watch-outs: built in 1922 — expect roof / HVAC / electrical / plumbing capex.
Questions for the listing agent
- It's been on market 36 days. Have you received any prior offers? Is the seller open to a 3% concession, seller financing, or rate buy-down credit?
- Built in 1922 — when were the roof, HVAC, electrical panel, plumbing, and water heater last replaced?
- Is there a deadline driving the sale (1031 exchange, divorce, estate, relocation)? That informs how much negotiation room exists.
- Schools are B-rated — typically a magnet for longer-tenancy family renters. What's the average tenant stay here, and is there a school-zone premium baked into asking?
- Crime grade is F in this area — have there been break-ins, vandalism, or insurance claims at this property in the last 3 years? What carrier currently insures it and at what premium?
- What's the average days-on-market for RENTAL listings here right now (not sales)? A rising rental-DOM trend means longer vacancies and softer asking-rent achievability than the comps imply.
- What's the recent tenant-quality profile in this submarket — average credit score on applications, eviction rate, late-payment / NSF rate, and stable-employment percentage? A property-management company in the area should have these aggregated.
- How much new for-sale + rental construction is in the pipeline within 1–3 miles? Heavy new supply typically softens prices + rents 12–24 months out; constrained supply supports both.
Investment metrics
- 1% rule
- 1.60% ✓
- Cap rate
- 12.32%
- Cash-on-cash
- 21.54%
- DSCR
- 1.96
- GRM
- 5.2
CMA / ARV
- ARV (on-the-fly)
- $230,104
- Comps found
- 12
Show comp detail 12 sales within ~0.75 mi
| Address | Dist | Beds/Ba | Sqft | Sold | Price | $/sf | Match |
|---|---|---|---|---|---|---|---|
| 1520 S Sherman Ave | 0.07mi | 3/2.0 (+1) | 1,140 (-3%) | 10mo | $200,000 | $175 | 79 |
| 1736 S Van Eps Ave Ave | 0.24mi | 3/1.0 (+1) | 1,131 (-4%) | 2mo | $221,600 | $196 | 72 |
| 1101 S 6th Ave Ave | 0.42mi | 2/2.0 | 1,257 (+7%) | 2mo | $185,000 | $147 | 67 |
| 900 S 4th Ave Ave | 0.60mi | 2/1.0 | 1,197 (+2%) | 3mo | $170,000 | $142 | 63 |
| 702 E 21st St St | 0.34mi | 3/1.0 (+1) | 1,250 (+6%) | 2mo | $260,000 | $208 | 62 |
| 1509 S Bruce Rd | 0.42mi | 3/1.5 (+1) | 1,200 (+2%) | 10mo | $230,000 | $192 | 62 |
| 1321 S Coates Rd | 0.34mi | 2/1.0 | 1,248 (+6%) | 12mo | $260,000 | $208 | 60 |
| 311 E 19th St St | 0.65mi | 3/1.0 (+1) | 1,210 (+3%) | 1mo | $255,000 | $211 | 55 |
| 708 S Blauvelt Ave Ave | 0.68mi | 2/1.0 | 1,232 (+5%) | 4mo | $230,000 | $187 | 53 |
| 705 S Mable Ave | 0.70mi | 2/1.0 | 1,152 (-2%) | 11mo | $233,000 | $202 | 51 |
| 1300 E Prospect St | 0.48mi | 3/1.0 (+1) | 1,000 (-15%) | 9mo | $145,000 | $145 | 36 |
| 2324 S Crestwood Rd Rd | 0.69mi | 3/1.0 (+1) | 1,287 (+10%) | 8mo | $258,000 | $200 | 36 |
Match score weights: distance 35% · size 25% · config 20% · recency 20%. Top-matched comps best support the ARV.
Projected returns pro-forma
-3.0% appreciation · 5.25% rent growth · sell at horizon
- IRR
- 16.8%
- Equity multiple
- 1.70×
- Total profit
- $15,058
- Equity at exit
- $11,473
- IRR
- 27.0%
- Equity multiple
- 3.66×
- Total profit
- $57,261
- Equity at exit
- $6,653
Cash invested: $21,546 (down + closing). Projections, not guarantees.
Landlord ↔ Tenant lean methodology
- Overall (STATE)
- 83 Strongly Landlord-Friendly
- State South Dakota
- 83 Strongly Landlord-Friendly · R+16
- County
- — inherits STATE
- City
- — inherits STATE
ZIP-level market 57105
- Rents YoY
- 5.2%
- Active inventory
- 171
- Price-to-rent
- 5.2×
Monthly cashflow live
- Estimated rent
- $1,229 high interval (Pro) →
- Mortgage (P&I)
- −$404
- Tax from tax record
- −$149 /mo · $1,784/yr
- Insurance
- −$32
- HOA
- −$0
- Vacancy / Maint / Mgmt
- −$258
- Net cashflow
- $387
Break-even live
UW: 25.0% down · 7.5% · 30yr · 1.5% tax · 5.0% vac · 8.0% maint · 8.0% mgmt
Financing live
Cash to close
- Down payment
- $19,238
- Closing costs
- $2,308
- Reserves months
- —
- Total cash needed
- —
Loan-product check · same deal, 3 products live
Conventional
25% down · 7.5% · 30yr
- Down + closing
- —
- Monthly P&I
- —
- Monthly cashflow
- —
- DSCR
- —
- Eligible?
- —
Personal DTI + credit; lowest rate.
DSCR
20% down · 8.5% · 30yr
- Down + closing
- —
- Monthly P&I
- —
- Monthly cashflow
- —
- DSCR
- —
- Eligible?
- —
No personal income docs; deal must DSCR.
Hard money
10% down · 12.0% · 12mo
- Down + closing
- —
- Monthly P&I
- —
- Monthly cashflow
- —
- DSCR
- —
- Eligible?
- —
Short-term bridge; refi at stabilization.
Rent comps 40 comps
| Address | Beds | Baths | Sqft | Rent | $/sqft | DOM | Units | Dist |
|---|---|---|---|---|---|---|---|---|
| 1612 S Cliff Ave Sioux Falls, SD | 2.0 | 1.0 | 1000 | $1,400 | $1.40 | 43d | 1 | 0.10mi |
| 1707 S 10th Ave Apt 3 Sioux Falls, SD | 1.0 | 1.0 | 800 | $1,199 | $1.50 | 21d | 1 | 0.19mi |
| 1707 S 10th Ave Apt 2 Sioux Falls, SD | 1.0 | 1.0 | 700 | $894 | $1.28 | 21d | 1 | 0.19mi |
| 1710 S 9th Ave Sioux Falls, SD | 2.0 | 1.0 | 800 | $1,590 | $1.99 | 21d | 1 | 0.21mi |
| 1723 S 9th Ave Sioux Falls, SD | 2.0 | 1.0 | 1071 | $1,506 | $1.41 | 21d | 1 | 0.27mi |
| 1716 S 8th Ave Sioux Falls, SD | 2.0 | 1.5 | 1080 | $1,732 | $1.60 | 21d | 1 | 0.28mi |
| 600 E 21st St Unit 1 (F) Sioux Falls, SD | 2.0 | 1.0 | 800 | $1,476 | $1.84 | 21d | 1 | 0.41mi |
| 909 E 14th St Sioux Falls, SD | 1.0 | 1.0 | 780 | $995 | $1.28 | 21d | 3 | 0.56mi |
| 758 S 3rd Ave Sioux Falls, SD | 2.0 | 1.0 | 900 | $900 | $1.00 | 21d | 1 | 0.65mi |
| 220 W 21st St Unit 5 Sioux Falls, SD | 1.0 | 1.0 | 800 | $1,495 | $1.87 | 43d | 1 | 0.87mi |
| 220 W 21st St Unit 3 Sioux Falls, SD | 1.0 | 1.0 | 800 | $1,395 | $1.74 | 43d | 1 | 0.87mi |
| 100 W 17th St Apt 15 Sioux Falls, SD | 2.0 | 1.5 | 1000 | $1,195 | $1.20 | 21d | 1 | 0.88mi |
| 100 W 17th St Unit 17 Sioux Falls, SD | 1.0 | 1.0 | 965 | $895 | $0.93 | 21d | 1 | 0.88mi |
| 205 W 18th St Sioux Falls, SD | 1.0–2.0 | 1.0 | 1000 | $995 | $0.99 | 21d | 2 | 0.89mi |
| 1511 E Nye St Sioux Falls, SD | 2.0 | 1.0 | 907 | $975 | $1.07 | 43d | 1 | 0.90mi |
| 801 S Phillips Ave Unit 1 Sioux Falls, SD | 1.0 | 1.0 | 800 | $735 | $0.92 | 43d | 1 | 0.90mi |
| 325 E 12th St Sioux Falls, SD | 1.0–2.0 | 1.0–2.0 | 954 | $1,680 | $1.76 | 13d | 11 | 0.90mi |
| 112 W 17th St Unit 7 Sioux Falls, SD | 2.0 | 1.0 | 1000 | $1,150 | $1.15 | 43d | 1 | 0.91mi |
| 310 W 21st St Unit 4 Sioux Falls, SD | 1.0 | 1.0 | 750 | $695 | $0.93 | 43d | 1 | 0.94mi |
| 310 W 21st St Unit 1 Sioux Falls, SD | 1.0 | 1.0 | 750 | $675 | $0.90 | 43d | 1 | 0.94mi |
| 301 W 18th St Unit 2 Sioux Falls, SD | 1.0 | 1.0 | 900 | $685 | $0.76 | 43d | 1 | 0.94mi |
| 1210 S Majestic View Pl Sioux Falls, SD | 2.0–3.0 | 1.5–2.0 | 1170 | $1,046 | $0.89 | 13d | 3 | 0.95mi |
| 1011 S Blaine Ave Sioux Falls, SD | 2.0 | 1.0 | 1000 | $975 | $0.97 | 21d | 1 | 0.95mi |
| 1301 S Cleveland Ave Sioux Falls, SD | 1.0–2.0 | 1.0 | 800 | $825 | $1.03 | 43d | 2 | 0.97mi |
| 1301 S Cleveland Ave Sioux Falls, SD | 2.0 | 1.0 | 900 | $825 | $0.92 | 21d | 1 | 0.97mi |
| 210 W 17th St Sioux Falls, SD | 2.0 | 1.0 | 720 | $1,000 | $1.39 | 43d | 1 | 0.97mi |
| 1006 S Dakota Ave Sioux Falls, SD | 1.0 | 1.0 | 950 | $1,050 | $1.11 | 21d | 1 | 0.97mi |
| 1209 S Cleveland Ave Sioux Falls, SD | 2.0 | 1.0 | 900 | $875 | $0.97 | 43d | 1 | 0.98mi |
| 1701 S Dakota Ave Sioux Falls, SD | 1.0 | 1.0 | 800 | $900 | $1.12 | 43d | 1 | 0.99mi |
| 205 E 12th St Sioux Falls, SD | 1.0–2.0 | 1.0–2.0 | 772 | $2,430 | $3.15 | 13d | 28 | 0.99mi |
| 647 S Main Ave Sioux Falls, SD | 2.0 | 2.0 | 1224 | $1,097 | $0.90 | 13d | 2 | 0.99mi |
| 124 S Blauvelt Ave Unit 117 Sioux Falls, SD | 2.0 | 2.0 | 900 | $1,095 | $1.22 | 21d | 1 | 1.01mi |
| 633 S Main Ave Unit 2 Sioux Falls, SD | 2.0 | 1.5 | 980 | $950 | $0.97 | 43d | 1 | 1.02mi |
| 113 S Mable Ave Unit 212 Sioux Falls, SD | 2.0 | 2.0 | 900 | $1,095 | $1.22 | 13d | 1 | 1.02mi |
| 1600 S Rock Creek Dr Sioux Falls, SD | 1.0–2.0 | 1.0 | 765 | $825 | $1.08 | 43d | 1 | 1.03mi |
| 1904 S Cleveland Ave Sioux Falls, SD | 2.0 | 1.0 | 1055 | $1,050 | $1.00 | 13d | 1 | 1.05mi |
| 1227 E 8th St Sioux Falls, SD | 2.0 | 1.0 | 700 | $749 | $1.07 | 43d | 1 | 1.06mi |
| 1966 S Cleveland Ave Sioux Falls, SD | 2.0 | 1.0 | 1055 | $1,095 | $1.04 | 43d | 1 | 1.06mi |
| 2420 S Main Ave Sioux Falls, SD | 2.0 | 1.0 | 936 | $2,400 | $2.56 | 43d | 1 | 1.07mi |
| 2048 S Cleveland Ave Sioux Falls, SD | 2.0 | 1.0 | 995 | $1,295 | $1.30 | 43d | 1 | 1.11mi |
Listing history 4 events
-
2026-04-28status Pending
-
2026-03-23$76,950 Active
-
2006-04-28soldstatus $70,500
-
2006-03-06$68,000 263-char remark
Show marketing remark (263 chars)
Lots Of Updates In This Conveniently Located Story & 1/2 * Furnace, Humidifier, A/C, 5 Yrs Old * Water Heater 2.5 Yrs * Updtd Elec W/ Circuit Breaker 10 Yrs Old * New Front Deck, New Patio Pavers, Privacy Fence! Shingles 3 Yrs * Egress Window * See Addendum
ⓘ Source: listings_history table (triggers on properties + properties_extension) + one-shot
backfill from property_details.listing_events for pre-trigger history.
Tax reassessment forecast SD · Resets to sale price
- Current annual tax
- $1,784 · $149/mo
- Projected year-2 tax
- $1,784 · $149/mo
- Expected delta
- $0/yr ($0/mo · 0.0%)
ⓘ Screening estimate from a state-policy table — verify with the county assessor before closing.
Climate risk First Street
- Flood 1/10 Low FEMA zone X (unshaded) · 0% chance over 30 yrs
- Wildfire 1/10 Low
- Heat 2/10 Low 7 d/yr ≥99°F today · 14 d/yr by 30 yrs out
- Wind 2/10 Low
- Air quality 2/10 Low 1 unhealthy d/yr today · 1 by 30 yrs out
Nearby sold comps map
Loading sold comps map…
Walkable amenities ~0.75 mi
Loading nearby amenities…
Taxation est. · year 1
- Rental income
- $14,750
- − Mortgage interest
- −$4,310
- − Property taxes
- −$1,784
- − Insurance
- −$385
- − Repairs & maintenance
- −$1,180
- − Management
- −$1,180
- − Depreciation
- −$2,239
- Taxable income
- $3,672
- Est. tax owed @ 24.0%
- −$881
- After-tax cash flow
- $3,760/yr
For passive investors: Depreciation is non-cash, so a rental often shows a tax loss while cash-flowing — sheltering income. Rental losses are passive: they offset passive income freely, and up to $25,000/yr can offset ordinary (W-2) income if you actively participate and your MAGI is under $100k (phasing out to $0 by $150k); unused losses carry forward. On sale, claimed depreciation is recaptured at up to 25%, and gains may owe capital-gains tax (a 1031 exchange can defer both). Figures are a year-1 estimate at your 24.0% rate — not tax advice; consult a CPA.
Schools (NCES district)
- District
- Sioux Falls School District 49-5
- NCES district ID
- 4666270
- Math proficiency
- 39% ▼ -4.00%
- Reading proficiency
- 48% ▼ -2.00%
- Median HH income
- $51,093
- Composite
- 37.47/100
- National rank
- #4407
- State rank
- #45 of 59 in SD
Livability — Sioux Falls
- Score
- 85/100
- State rank
- #3
- US rank
- #610
Category grades
Schools grade is shown separately in the Schools card above.
Census & demographics
- Census place
- Sioux Falls, SD
- County
- Minnehaha County · 191,523 people
- City population
- 207,623
- Metro
- Sioux Falls, SD
- Population (ZIP)
- 23,287
- Household income
- $77,292
- Rent vs Own
- Severe rent burden
- 631.0
Population outlook (Minnehaha County) Hauer SSP2
- Today (2025)
- 222,323 people
- By 2030
- 241,430 · +8.6%
- By 2040
- 281,643 · +26.7%
- By 2050
- 325,574 · +46.4%
- By 2075
- 469,313 · +111.1%
- By 2100
- 664,763 · +199.0%
Race, ethnicity, and origin ACS 2023
- Neighborhood character
- Predominantly White (86%)
- Race & ethnicity
- White 86% Two or more races 5% Black 4% Hispanic / Latino 3% Asian 2% Native American 2%
- Common ancestry
- Portuguese 16% Iranian 4% Lithuanian 3%
- Foreign-born
- 3% · Canada
- Languages at home
- 95% English-only · Spanish 2% Other Indo-European 1%
Political lean MEDSL · Minnehaha
- 2024 margin
- R (+12.7) · D 42.5% · R 55.2% · Other 2.4%
- 2008→2024 swing
- -13.4pp toward R · 2008: 0.7pp · 2024: -12.7pp
- All cycles
- 2024: R+12.7 2020: R+9.5 2016: R+14.6 2012: R+7.4 2008: D+0.7
Not yet ingested
- Civics
- —
Market trends
- HPI YoY
- ▼ -236.85%
- Current HPI
- 235.1948
- Rent YoY
- ▲ 5.25%
- Metro
- Sioux Falls, SD
- State GDP YoY
- ▲ 0.70%
- F500 in state
- 2
Industry mix (Fortune 500 HQ in SD)
| Industry | F500 HQs | Revenue |
|---|---|---|
| Utilities | 1 | $1B |
|
||
Price history
+13.2% since first listed4 events — show timeline
- 2026-04-28 Pending — REALTOR® Association of the Sioux Empire
- 2026-03-23 Listed $76,950 REALTOR® Association of the Sioux Empire
- 2006-04-28 Sold (Public Records) $70,500 Public Records
- 2006-03-06 Listed $68,000 REALTOR® Association of the Sioux Empire
Property tax history
+7.4%/yrLatest (2024): $1,784 · -3.5% YoY. Source: county tax records.
Cash-flow waterfall
monthlySold comps — $/sqft
last 12 mo · ≤1 miLoading sold comps…