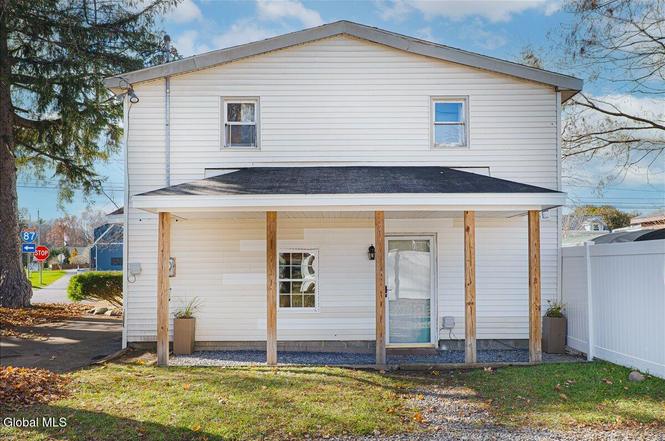
136 Jefferson St · Saratoga Springs, NY
Flood risk 6/10 · Moderate
- FEMA flood zone
- X
- Chance of flooding over 30 yrs
- 0.74%
- Est. flood insurance / yr
- $507 – $1,088
Fire risk 1/10 · Minimal
- Est. fire insurance / yr
- $691 – $1,283
Heat risk 3/10 · Minor
- Hot days now (above 97°F)
- 7 days/yr
- Hot days in 30 yrs
- 16 days/yr
Wind risk 2/10 · Minimal
- Chance of severe wind over 30 yrs
- 4.0%
Air-quality risk 1/10 · Minimal
- Unhealthy air days now
- 0 days/yr
- Unhealthy air days in 30 yrs
- 0 days/yr
Risk factors via First Street. Map © Google.
Why this score? — see what drove the C+ grade
The composite is a weighted blend of 9 inputs, each scored 0–100. Each bar is that input's sub-score; the figure is the points it added to the 100-point composite (weight × sub-score).
- Cash flow +17.3/30.0
- ARV discount +15.0/15.0
- Schools +6.1/10.0
- DSCR +5.4/10.0
- 1% rule +5.0/10.0
- Rent growth +4.8/5.0
- Livability +4.1/5.0
- Condition / age +2.5/5.0
- Appreciation +0.0/10.0
$299,900
🖨 Deal sheet (PDF) 📄 Offer letter ✓ Due diligence
Listing remarks
* * OPEN HOUSE CANCELLED. OFFER ACCEPTED * * CASH ONLY! Set on a corner lot just five blocks from the Saratoga Racetrack, this property is a prime fix-and-flip surrounded by high-value homes. Luxury properties nearby set a strong ARV benchmark, giving investors a clear path to returns. Purchase now, start renovations immediately, and bring the finished home to market as spring buyers and track-season demand push prices to their peak. The layout is built for investors: renovate as a single-family with an income-producing in-law suite, or convert to a cohesive full single-family residence. The in-law offers two private entrances, its own driveway, an updated kitchen, and a primary bedroom w
Key facts
- In-law suite
- Updated kitchen
- Full bath ensuite
Tags
Neighborhood map
What this means for you Summary
Snapshot
- This is a 3-bed/2.0-bath single-family listed at $300k.
Deal economics
- At list price, monthly cash flow is $217 ($3k/yr) — positive.
- The deal already cash-flows at list — no discount required.
- To meet the 1% rule (rent ≥ 1% of price), the offer needs to be $299k (0.2% below list).
- Recommended offer: $295k (1.5% below list) — sets the bar for market timing.
- Cap rate 7.2% vs local median 2.0% in Saratoga Springs — top-decile yield for the area; either an underpriced asset or a hidden risk that comps aren't pricing in. Stress-test before assuming the spread holds.
Location & tenants
- Location reads 82/100 on livability (#83 in NY, #1,284 nationally) — a professional / high-income tenant draw. Strengths: employment A+, housing A+, health & safety A; Watch: amenities D+, cost of living F.
- Saratoga Springs City SD (suburban): math 67% / reading 72% proficiency, ranked #138 of 590 in NY (top 23%) — acceptable for families but not a draw, mixed tenant base, ~2y average lease; only 15% free/reduced lunch — higher-income household profile.
- Zoned schools: Caroline Street Elementary School (math 87% / reading 77%, grade A+, #138 of 2,108 statewide, top 8%, 357 students, 29% FRL); Maple Avenue Middle School (math 46% / reading 69%, grade B, #187 of 729 statewide, top 26%, 1,392 students, 27% FRL); Saratoga Springs High School (math 98% / reading 92%, grade A+, #83 of 1,100 statewide, top 8%, 1,947 students, 26% FRL).
- Market conditions: Rents rising fast (+9.2%/yr); 474 active listings in the ZIP; 29 comparable units currently listed for rent nearby; rentals lingering (median 45d on market — plan ~5-8 weeks vacancy on turnover, expect pricing pressure); 55% of comp listings sitting > 30 days — soft ceiling on asking rent; solid renter incomes; 1,132 units permitted in Saratoga County in 2024 (378 in 5+ unit buildings).
Forward outlook
- Local home prices are declining (-3.0%/yr); year-one equity from $2k of loan paydown is wiped out by about $9k of value loss. Plan a longer hold.
- Saratoga County population projected at +4% by 2050 — modest demand growth; plan on rents tracking national, not racing it.
- At projected returns (-3.0% appreciation + 8.0% rent growth), your $84k cash investment doubles in ~10 years — after that, you're playing with house money.
Negotiation context
- It's been on market 17 days — a 2% lower offer ($295k) is reasonable based on typical stale-listing flexibility.
- 3 sale attempts since 10y ago; this cycle's ask has dropped $150k (33%) from the opening price — seller is motivated, your offer sets the floor, not the list.
- Current owner paid $23k; list at $300k implies a 1183% gain — meaningful room to come down on a strong offer.
Risks & watch-outs
- Watch-outs: built in 1954 — expect roof / HVAC / electrical / plumbing capex.
- Climate carrying-cost: major flood risk — expect insurance premiums to compound above CPI over the hold.
Questions for the listing agent
- Built in 1954 — when were the roof, HVAC, electrical panel, plumbing, and water heater last replaced?
- Is there a deadline driving the sale (1031 exchange, divorce, estate, relocation)? That informs how much negotiation room exists.
- Schools are A-rated — typically a magnet for longer-tenancy family renters. What's the average tenant stay here, and is there a school-zone premium baked into asking?
- What's the average days-on-market for RENTAL listings here right now (not sales)? A rising rental-DOM trend means longer vacancies and softer asking-rent achievability than the comps imply.
- What's the recent tenant-quality profile in this submarket — average credit score on applications, eviction rate, late-payment / NSF rate, and stable-employment percentage? A property-management company in the area should have these aggregated.
- How much new for-sale + rental construction is in the pipeline within 1–3 miles? Heavy new supply typically softens prices + rents 12–24 months out; constrained supply supports both.
Investment metrics
- 1% rule
- 1.00% ✗
- Cap rate
- 7.16%
- Cash-on-cash
- 3.10%
- DSCR
- 1.14
- GRM
- 8.3
CMA / ARV
- ARV (on-the-fly)
- $494,874
- Comps found
- 12
Show comp detail 12 sales within ~0.75 mi
| Address | Dist | Beds/Ba | Sqft | Sold | Price | $/sf | Match |
|---|---|---|---|---|---|---|---|
| 12 Ward St | 0.12mi | 3/1.5 | 1,565 (+8%) | 6mo | $700,000 | $447 | 73 |
| 86 Jefferson St | 0.14mi | 3/1.0 | 1,350 (-7%) | 13mo | $290,000 | $215 | 67 |
| 8 Clark St | 0.43mi | 2/1.5 (-1) | 1,426 (-2%) | 15mo | $400,000 | $281 | 58 |
| 13 Thoroughbred Dr | 0.41mi | 3/2.5 | 1,560 (+8%) | 9mo | $799,000 | $512 | 58 |
| 41 Madison St | 0.26mi | 3/2.0 | 1,654 (+14%) | 9mo | $565,000 | $342 | 57 |
| 88 Monroe St | 0.13mi | 4/2.0 (+1) | 1,650 (+14%) | 12mo | $660,000 | $400 | 55 |
| 34 Vanderbilt Ave | 0.24mi | 2/1.0 (-1) | 1,366 (-6%) | 21mo | $399,000 | $292 | 53 |
| 30 Spa Dr | 0.63mi | 3/2.0 | 1,576 (+9%) | 5mo | $480,000 | $305 | 51 |
| 303 Jefferson St | 0.27mi | 2/1.5 (-1) | 1,344 (-7%) | 22mo | $415,000 | $309 | 50 |
| 27 Thoroughbred Dr | 0.41mi | 3/2.5 | 1,620 (+12%) | 12mo | $669,900 | $414 | 49 |
| 27 Spa Dr | 0.66mi | 4/2.0 (+1) | 1,632 (+13%) | 9mo | $520,000 | $319 | 35 |
| 70 Mitchell St | 0.68mi | 2/1.5 (-1) | 1,572 (+9%) | 18mo | $799,000 | $508 | 32 |
Match score weights: distance 35% · size 25% · config 20% · recency 20%. Top-matched comps best support the ARV.
Projected returns pro-forma
-3.0% appreciation · 8.0% rent growth · sell at horizon
- IRR
- -5.7%
- Equity multiple
- 0.78×
- Total profit
- $-18,862
- Equity at exit
- $44,716
- IRR
- 9.3%
- Equity multiple
- 1.88×
- Total profit
- $73,746
- Equity at exit
- $25,930
Cash invested: $83,972 (down + closing). Projections, not guarantees.
Landlord ↔ Tenant lean methodology
- Overall (STATE)
- 15 Strongly Tenant-Friendly
- State New York
- 15 Strongly Tenant-Friendly · D+10
- County
- — inherits STATE
- City
- — inherits STATE
ZIP-level market 12866
- Home prices YoY
- -31.8%
- Rents YoY
- 9.2%
- Active inventory
- 474
- Price-to-rent
- 8.3×
Monthly cashflow live
- Estimated rent
- $2,993 high interval (Pro) →
- Mortgage (P&I)
- −$1,573
- Tax from tax record
- −$450 /mo · $5,399/yr
- Insurance
- −$125
- HOA
- −$0
- Vacancy / Maint / Mgmt
- −$629
- Net cashflow
- $217
Break-even live
Sensitivity live
| Price | -10% $387 | -5% $302 | +0% $217 | +5% $132 | +10% $47 |
|---|---|---|---|---|---|
| Rent | -10% $-19 | -5% $99 | +0% $217 | +5% $335 | +10% $454 |
| Rate | -1.0pp $368 | -0.5pp $293 | base $217 | +0.5pp $139 | +1.0pp $60 |
UW: 25.0% down · 7.5% · 30yr · 1.5% tax · 5.0% vac · 8.0% maint · 8.0% mgmt
Financing live
Cash to close
- Down payment
- $74,975
- Closing costs
- $8,997
- Reserves months
- —
- Total cash needed
- —
Loan-product check · same deal, 3 products live
Conventional
25% down · 7.5% · 30yr
- Down + closing
- —
- Monthly P&I
- —
- Monthly cashflow
- —
- DSCR
- —
- Eligible?
- —
Personal DTI + credit; lowest rate.
DSCR
20% down · 8.5% · 30yr
- Down + closing
- —
- Monthly P&I
- —
- Monthly cashflow
- —
- DSCR
- —
- Eligible?
- —
No personal income docs; deal must DSCR.
Hard money
10% down · 12.0% · 12mo
- Down + closing
- —
- Monthly P&I
- —
- Monthly cashflow
- —
- DSCR
- —
- Eligible?
- —
Short-term bridge; refi at stabilization.
Rent comps 29 comps
| Address | Beds | Baths | Sqft | Rent | $/sqft | DOM | Units | Dist |
|---|---|---|---|---|---|---|---|---|
| 289 Jefferson St Saratoga Springs, NY | 2.0 | 2.0 | 1240 | $18,000 | $14.52 | 15d | 1 | 0.23mi |
| 20 Madison Ave Ste A Saratoga Springs, NY | 4.0 | 3.0 | 1600 | $2,800 | $1.75 | 45d | 1 | 0.72mi |
| 1 Spring St Saratoga Springs, NY | 3.0 | 2.0 | 1340 | $30,000 | $22.39 | 45d | 1 | 0.88mi |
| 10 Marion Pl Saratoga Springs, NY | 4.0 | 2.0 | 1800 | $4,500 | $2.50 | 25d | 1 | 0.92mi |
| 74 Caroline St Saratoga Springs, NY | 2.0 | 2.0 | 1200 | $2,795 | $2.33 | 25d | 1 | 0.93mi |
| 30 Lake Ave Saratoga Springs, NY | 2.0 | 1.0–2.0 | 976 | $3,190 | $3.27 | 15d | 7 | 1.02mi |
| 425 Broadway Saratoga Springs, NY | 2.0 | 1.0 | 1100 | $2,800 | $2.55 | 45d | 1 | 1.03mi |
| 433 Broadway Saratoga Springs, NY | 2.0 | 1.0 | 1000 | $2,750 | $2.75 | 45d | 1 | 1.04mi |
| 156 Circular St Unit 3 Saratoga Springs, NY | 2.0 | 2.0 | 1600 | $3,250 | $2.03 | 25d | 1 | 1.08mi |
| 55 Railroad Pl Saratoga Springs, NY | 1.0–3.0 | 1.0–2.0 | 1097 | $3,570 | $3.25 | 20d | 2 | 1.08mi |
| 156 Circular St Unit 9 Saratoga Springs, NY | 2.0 | 1.0 | 950 | $2,350 | $2.47 | 45d | 1 | 1.09mi |
| 165 Lake Ave Saratoga Springs, NY | 2.0 | 2.0 | 1200 | $15,000 | $12.50 | 25d | 1 | 1.10mi |
| 38 High Rock Ave Saratoga Springs, NY | 2.0 | 2.5 | 1589 | $25,000 | $15.73 | 45d | 1 | 1.11mi |
| 175 Lake Ave #2 Saratoga Springs, NY | 2.0 | 1.0 | 1200 | $5,900 | $4.92 | 45d | 1 | 1.12mi |
| 2 Ritchie Pl Saratoga Springs, NY | 3.0 | 2.0 | 1272 | $20,000 | $15.72 | 22d | 1 | 1.29mi |
| 59 Van Dam St Saratoga Springs, NY | 3.0 | 1.0 | 1148 | $2,500 | $2.18 | 45d | 1 | 1.30mi |
| 106 Van Dam St Saratoga Springs, NY | 2.0 | 2.5 | 1612 | $18,000 | $11.17 | 20d | 1 | 1.31mi |
| 110 Van Dam St Saratoga Springs, NY | 2.0 | 1.0 | 1120 | $2,600 | $2.32 | 45d | 1 | 1.32mi |
| 77 Van Dam St Saratoga Springs, NY | 2.0 | 1.0 | 985 | $14,000 | $14.21 | 45d | 1 | 1.32mi |
| 99 1/2 Walworth St Saratoga Springs, NY | 3.0 | 2.0 | 1152 | $3,200 | $2.78 | 45d | 1 | 1.33mi |
| 590 N Broadway Saratoga Springs, NY | 2.0 | 1.0 | 1012 | $2,150 | $2.12 | 45d | 1 | 1.34mi |
| 5 Alger St Saratoga Springs, NY | 3.0 | 1.5 | 1540 | $2,750 | $1.79 | 45d | 1 | 1.35mi |
| 116 West Ave Saratoga Springs, NY | 2.0 | 2.0 | 1135 | $20,000 | $17.62 | 25d | 1 | 1.41mi |
| 68 Marvin St Saratoga Springs, NY | 2.0 | 1.0 | 1100 | $2,500 | $2.27 | 25d | 1 | 1.42mi |
| 11 Outlook Ave Saratoga Springs, NY | 3.0 | 2.5 | 1706 | $28,000 | $16.41 | 25d | 1 | 1.43mi |
| 30 Excelsior Ave Unit Townhome Saratoga Springs, NY | 2.0 | 2.5 | 1150 | $2,825 | $2.46 | 45d | 1 | 1.45mi |
| 30 Excelsior Ave Saratoga Springs, NY | 2.0 | 2.0 | 1100 | $2,625 | $2.39 | 45d | 1 | 1.45mi |
| 30 Excelsior Ave Unit B-5 Saratoga Springs, NY | 2.0 | 2.0 | 1000 | $2,625 | $2.62 | 22d | 1 | 1.45mi |
| 17 Van Dorn St Saratoga Springs, NY | 2.0 | 1.5 | 1342 | $18,000 | $13.41 | 45d | 1 | 1.46mi |
Listing history 11 events
-
2025-12-11status Pending
-
2025-12-09price $299,900
-
2025-11-24$450,000 Active
-
2025-09-30historical
-
2025-09-26price $499,900
-
2025-09-23price $529,900
-
2025-09-16$559,900 Active
-
2016-05-15historical
-
2016-04-21$247,000 New
-
2011-08-03soldstatus $23,376
-
2011-08-03soldstatus $23,376
ⓘ Source: listings_history table (triggers on properties + properties_extension) + one-shot
backfill from property_details.listing_events for pre-trigger history.
Tax reassessment forecast NY · Partial reset (capped growth)
- Current annual tax
- $5,399 · $450/mo
- Projected year-2 tax
- $5,399 · $450/mo
- Expected delta
- $0/yr ($0/mo · 0.0%)
ⓘ Screening estimate from a state-policy table — verify with the county assessor before closing.
Climate risk First Street
- Flood 6/10 Major FEMA zone X · 74% chance over 30 yrs
- Wildfire 1/10 Low
- Heat 3/10 Moderate 7 d/yr ≥97°F today · 16 d/yr by 30 yrs out
- Wind 2/10 Low 4% chance of damaging wind over 30 yrs
- Air quality 1/10 Low 0 unhealthy d/yr today · 0 by 30 yrs out
Nearby sold comps map
Loading sold comps map…
Walkable amenities ~0.75 mi
Loading nearby amenities…
Taxation est. · year 1
- Rental income
- $35,919
- − Mortgage interest
- −$16,799
- − Property taxes
- −$5,399
- − Insurance
- −$1,500
- − Repairs & maintenance
- −$2,874
- − Management
- −$2,874
- − Depreciation
- −$8,724
- Taxable loss
- −$2,250
- Est. tax savings @ 24.0%
- +$540
- After-tax cash flow
- $3,145/yr
For passive investors: Depreciation is non-cash, so a rental often shows a tax loss while cash-flowing — sheltering income. Rental losses are passive: they offset passive income freely, and up to $25,000/yr can offset ordinary (W-2) income if you actively participate and your MAGI is under $100k (phasing out to $0 by $150k); unused losses carry forward. On sale, claimed depreciation is recaptured at up to 25%, and gains may owe capital-gains tax (a 1031 exchange can defer both). Figures are a year-1 estimate at your 24.0% rate — not tax advice; consult a CPA.
Schools (NCES district)
- District
- Saratoga Springs City SD
- NCES district ID
- 3625770
- Math proficiency
- 67% ▼ -10.00%
- Reading proficiency
- 72% ▲ 6.00%
- Median HH income
- $69,864
- Composite
- 60.83/100
- National rank
- #818
- State rank
- #138 of 590 in NY
Livability — Saratoga Springs
- Score
- 82/100
- State rank
- #83
- US rank
- #1284
Category grades
Schools grade is shown separately in the Schools card above.
Census & demographics
- Census place
- Saratoga Springs, NY
- County
- Saratoga County · 166,192 people
- City population
- 40,057
- Metro
- Albany-Schenectady-Troy, NY
- Population (ZIP)
- 40,057
- Household income
- $101,901
- Rent vs Own
- Severe rent burden
- 1424.0
Population outlook (Saratoga County) Hauer SSP2
- Today (2025)
- 238,889 people
- By 2030
- 243,681 · +2.0%
- By 2040
- 249,118 · +4.3%
- By 2050
- 248,638 · +4.1%
- By 2075
- 241,675 · +1.2%
- By 2100
- 213,150 · -10.8%
Race, ethnicity, and origin ACS 2023
- Neighborhood character
- Predominantly White (87%)
- Race & ethnicity
- White 87% Two or more races 5% Hispanic / Latino 4% Asian 2% Black 2%
- Common ancestry
- Romanian 6% Lithuanian 5% Slovak 2%
- Foreign-born
- 6% · Canada, South Korea, China
- Languages at home
- 92% English-only · Spanish 2% German/W. Germanic 1% Korean 1%
Political lean MEDSL · Saratoga
- 2024 margin
- Toss-up / Even · D 50.9% · R 49.1%
- 2008→2024 swing
- -1.6pp toward R · 2008: 3.4pp · 2024: 1.8pp
- All cycles
- 2024: D+1.8 2020: D+5.4 2016: R+4.4 2012: D+2.1 2008: D+3.4
Not yet ingested
- Civics
- —
Market trends
- HPI YoY
- ▼ -178.78%
- Current HPI
- 382.7429
- Rent YoY
- ▲ 9.15%
- Metro
- Albany-Schenectady-Troy, NY
- State GDP YoY
- ▲ 2.60%
- F500 in state
- 92
Industry mix (Fortune 500 HQ in NY)
| Industry | F500 HQs | Revenue |
|---|---|---|
| Financial Services | 10 | $950B |
|
||
| Consumer Goods | 9 | $162B |
|
||
| Insurance | 4 | $225B |
|
||
| Telecommunications | 2 | $144B |
|
||
| Pharmaceuticals | 2 | $112B |
|
||
| Media / Entertainment | 2 | $69B |
|
||
Price history
+1182.9% since first listed11 events — show timeline
- 2025-12-11 Pending — Global MLS
- 2025-12-09 Price Changed $299,900 Global MLS
- 2025-11-24 Listed $450,000 Global MLS
- 2025-09-30 Listing Removed — Global MLS
- 2025-09-26 Price Changed $499,900 Global MLS
- 2025-09-23 Price Changed $529,900 Global MLS
- 2025-09-16 Listed $559,900 Global MLS
- 2016-05-15 Listing Removed — Global MLS
- 2016-04-21 Listed $247,000 Global MLS
- 2011-08-03 Sold (Public Records) $23,376 Public Records
- 2011-08-03 Sold (Public Records) $23,376 Public Records
Property tax history
+2.9%/yrLatest (2025): $5,399 · +6.6% YoY. Source: county tax records.
Cash-flow waterfall
monthlySold comps — $/sqft
last 12 mo · ≤1 miLoading sold comps…