 Triplex
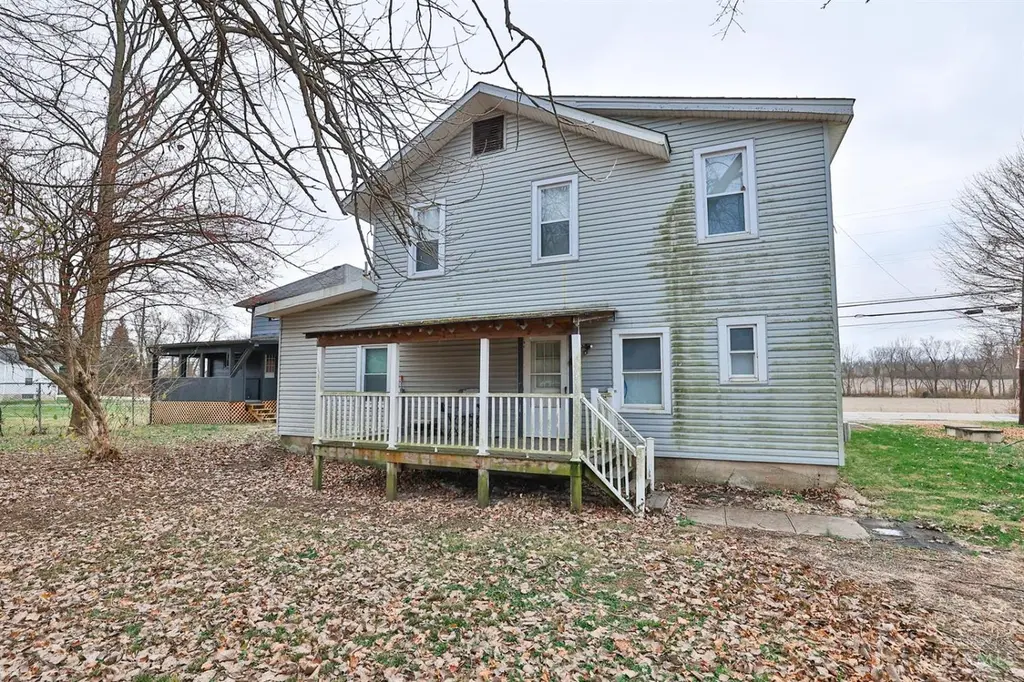
4844 Alert New London Rd · Ross, OH
Flood risk 5/10 · Moderate
- FEMA flood zone
- X (unshaded)
- Chance of flooding over 30 yrs
- 0.66%
- Est. flood insurance / yr
- $507 – $1,088
Fire risk 1/10 · Minimal
- Est. fire insurance / yr
- $713 – $1,323
Heat risk 4/10 · Minor
- Hot days now (above 104°F)
- 7 days/yr
- Hot days in 30 yrs
- 19 days/yr
Wind risk 2/10 · Minimal
- Chance of severe wind over 30 yrs
- 1.0%
Air-quality risk 4/10 · Minor
- Unhealthy air days now
- 3 days/yr
- Unhealthy air days in 30 yrs
- 5 days/yr
Risk factors via First Street. Map © Google.
Why this score? — see what drove the B grade
The composite is a weighted blend of 9 inputs, each scored 0–100. Each bar is that input's sub-score; the figure is the points it added to the 100-point composite (weight × sub-score).
- Cash flow +30.0/30.0
- 1% rule +10.0/10.0
- DSCR +10.0/10.0
- ARV discount +7.5/15.0
- Schools +6.4/10.0
- Rent growth +3.4/5.0
- Livability +3.4/5.0
- Condition / age +2.5/5.0
- Appreciation +0.0/10.0
$264,900
🖨 Deal sheet (PDF) 📄 Offer letter ✓ Due diligence
Multi-family units
County records classify this as Multi-Family (2-4 Unit). Listing-text estimate: 3 units. confirmed
Listing remarks MLS
3 family, 2 story home. Good rental history. Trees trimmed in 2017. Roof 2018. Water heater in unit 1 (2017) unit 2 (2020). Fridge in unit 2 (2022). Stove in unit 1 (2023) Tenants would like to stay. Subject to tenant rights.
Key facts
- 0.27 acre lot
- Built 1906
- Listed 203 days
Neighborhood map
What this means for you Summary
Snapshot
- This is a 3 × 5-bed/3.0-bath units multifamily listed at $265k.
Deal economics
- At list price, monthly cash flow is $3k ($36k/yr) — positive. Per door: $998/mo.
- The deal already cash-flows at list — no discount required.
- Meets the 1% rule at list price ($6k rent vs $265k).
- Recommended offer: $233k (12.0% below list) — sets the bar for market timing.
Location & tenants
- Location reads 67/100 on livability (#591 in OH) — a middle-class / working-renter tenant base. Strengths: crime A+, employment A+, cost of living A+; Watch: amenities F, commute F, health & safety F.
- Ross Local (rural): math 71% / reading 76% proficiency, ranked #95 of 656 in OH (top 14%) — strong family-tenant draw, lease renewals of 3-5y typical; only 20% free/reduced lunch — higher-income household profile.
- Zoned schools: Morgan Elementary School (math 87% / reading 77%, grade A+, #116 of 1,584 statewide, top 9%, 408 students, 19% FRL); Ross Middle School (math 65% / reading 75%, grade A, #136 of 654 statewide, top 22%, 726 students, 24% FRL); Ross High School (math 71% / reading 84%, grade A-, #52 of 781 statewide, top 7%, 933 students, 20% FRL) — zoned schools at 21% FRL track the district average.
- Market conditions: Rents rising (+3.7%/yr); 121 active listings in the ZIP; 1,163 units permitted in Butler County in 2024 (356 in 5+ unit buildings).
- At $6,020/mo this rent would consume 98% of the median local household income ($74k/yr) (locally 1047% of renters already pay >50% of income on rent) — very limited rent-growth headroom before tenants either downsize or default.
Forward outlook
- Local home prices are declining (-3.0%/yr); year-one equity from $2k of loan paydown is wiped out by about $8k of value loss. Plan a longer hold.
- At projected returns (-3.0% appreciation + 3.7% rent growth), your $74k cash investment doubles in ~3 years — after that, you're playing with house money.
Negotiation context
- It's been on market 203 days — a 12% lower offer ($233k) is reasonable based on typical stale-listing flexibility.
- 2 sale attempts since 15y ago with the ask held roughly flat each time — persistent listings suggest the price (not the market) is what's stuck; bring a comps-based counter.
- Current owner paid $60k; list at $265k implies a 338% gain — meaningful room to come down on a strong offer.
Risks & watch-outs
- Watch-outs: built in 1906 — expect roof / HVAC / electrical / plumbing capex.
- Climate carrying-cost: moderate flood risk — expect insurance premiums to compound above CPI over the hold.
Questions for the listing agent
- It's been on market 203 days. Have you received any prior offers? Is the seller open to a 12% concession, seller financing, or rate buy-down credit?
- Can we see the unit-by-unit rent roll, current vacancy, and any below-market leases? What's the average tenancy length?
- What capital expenditures (roof, boiler, parking lot, exteriors) have been made in the last 5 years, and what's planned in the next 2?
- Built in 1906 — when were the roof, HVAC, electrical panel, plumbing, and water heater last replaced?
- Why hasn't it sold? Are there any deal-killer items the seller is aware of (foundation, flood, title, zoning, code violations)?
- Is there a deadline driving the sale (1031 exchange, divorce, estate, relocation)? That informs how much negotiation room exists.
- Schools are F-rated, which usually means shorter tenancies and higher turnover. Who's the typical renter profile here, and what's been the actual vacancy rate?
- What's the average days-on-market for RENTAL listings here right now (not sales)? A rising rental-DOM trend means longer vacancies and softer asking-rent achievability than the comps imply.
- What's the recent tenant-quality profile in this submarket — average credit score on applications, eviction rate, late-payment / NSF rate, and stable-employment percentage? A property-management company in the area should have these aggregated.
- How much new apartment / multifamily construction is in the pipeline within 1–3 miles? Heavy new supply (>2% of stock underway) typically softens rents 12–24 months out; light construction supports rent growth.
Investment metrics
- 1% rule
- 2.27% ✓
- Cap rate
- 19.86%
- Cash-on-cash
- 48.44%
- DSCR
- 3.16
- GRM
- 3.7
CMA / ARV
No comps found within radius.
Projected returns pro-forma
-3.0% appreciation · 3.69% rent growth · sell at horizon
- IRR
- 46.7%
- Equity multiple
- 3.05×
- Total profit
- $152,029
- Equity at exit
- $39,497
- IRR
- 52.8%
- Equity multiple
- 6.33×
- Total profit
- $395,645
- Equity at exit
- $22,904
Cash invested: $74,172 (down + closing). Projections, not guarantees.
Landlord ↔ Tenant lean methodology
- Overall (STATE)
- 73 Landlord-Friendly
- State Ohio
- 73 Landlord-Friendly · R+6
- County
- — inherits STATE
- City
- — inherits STATE
ZIP-level market 45013
- Rents YoY
- 3.7%
- Active inventory
- 121
- Price-to-rent
- 11.0×
Monthly cashflow live
- Estimated rent
- $6,020 medium interval (Pro) →
- Mortgage (P&I)
- −$1,389
- Tax from tax record
- −$262 /mo · $3,146/yr
- Insurance
- −$110
- HOA
- −$0
- Lot rent
- −$0
- Vacancy / Maint / Mgmt
- −$1,264
- Net cashflow
- $2,994
Break-even live
Sensitivity live
| Price | -10% $3,144 | -5% $3,069 | +0% $2,994 | +5% $2,919 | +10% $2,844 |
|---|---|---|---|---|---|
| Rent | -10% $2,519 | -5% $2,756 | +0% $2,994 | +5% $3,232 | +10% $3,470 |
| Rate | -1.0pp $3,128 | -0.5pp $3,061 | base $2,994 | +0.5pp $2,925 | +1.0pp $2,856 |
3-unit breakdown (identical units grouped — click to expand)
| Units | Beds | Baths | Est. rent |
|---|---|---|---|
| 3× units | 5 | 3 | $6,021 |
| #1 | 5 | 3 | $2,007 |
| #2 | 5 | 3 | $2,007 |
| #3 | 5 | 3 | $2,007 |
| Total (3 units) | $6,020 | ||
UW: 25.0% down · 7.5% · 30yr · 1.5% tax · 5.0% vac · 8.0% maint · 8.0% mgmt
Financing live
Cash to close
- Down payment
- $66,225
- Closing costs
- $7,947
- Reserves months
- —
- Total cash needed
- —
Loan-product check · same deal, 3 products live
Conventional
25% down · 7.5% · 30yr
- Down + closing
- —
- Monthly P&I
- —
- Monthly cashflow
- —
- DSCR
- —
- Eligible?
- —
Personal DTI + credit; lowest rate.
DSCR
20% down · 8.5% · 30yr
- Down + closing
- —
- Monthly P&I
- —
- Monthly cashflow
- —
- DSCR
- —
- Eligible?
- —
No personal income docs; deal must DSCR.
Hard money
10% down · 12.0% · 12mo
- Down + closing
- —
- Monthly P&I
- —
- Monthly cashflow
- —
- DSCR
- —
- Eligible?
- —
Short-term bridge; refi at stabilization.
Listing history 20 events
-
2026-06-22days on market $264,900 Active 203 DOM
-
2026-06-21days on market $264,900 Active 202 DOM
-
2026-06-18days on market $264,900 Active 199 DOM
-
2026-06-17days on market $264,900 Active 198 DOM
-
2026-06-16days on market $264,900 Active 197 DOM
-
2026-06-15days on market $264,900 Active 196 DOM
-
2026-06-13days on market $264,900 Active 194 DOM
-
2026-06-09days on market $264,900 Active 190 DOM
-
2026-06-08days on market $264,900 Active 189 DOM
-
2026-06-07days on market $264,900 Active 188 DOM
-
2026-06-05days on market $264,900 Active 185 DOM
-
2026-06-03days on market $264,900 Active 184 DOM
-
2026-06-02days on market $264,900 Active 183 DOM
-
2026-06-01days on market $264,900 Active 182 DOM
-
2026-05-31days on market $264,900 Active 181 DOM
-
2025-12-01$264,900 Active 225-char remark
Show marketing remark (225 chars)
3 family, 2 story home. Good rental history. Trees trimmed in 2017. Roof 2018. Water heater in unit 1 (2017) unit 2 (2020). Fridge in unit 2 (2022). Stove in unit 1 (2023) Tenants would like to stay. Subject to tenant rights.
-
2012-05-24soldstatus $60,500 94-char remark
Show marketing remark (94 chars)
This 3 family is fully rented and in great condition. Newer siding and enjoy the country view.
-
2012-05-03soldstatus $60,500
-
2011-07-19$76,900 94-char remark
Show marketing remark (94 chars)
This 3 family is fully rented and in great condition. Newer siding and enjoy the country view.
-
1988-01-14soldstatus $28,600
ⓘ Source: listings_history table (triggers on properties + properties_extension) + one-shot
backfill from property_details.listing_events for pre-trigger history.
Tax reassessment forecast OH · Partial reset (capped growth)
- Current annual tax
- $3,146 · $262/mo
- Projected year-2 tax
- $3,639 · $303/mo
- Expected delta
- +$493/yr (+$41/mo · 15.7%)
ⓘ Screening estimate from a state-policy table — verify with the county assessor before closing.
Climate risk First Street
- Flood 5/10 Major FEMA zone X (unshaded) · 66% chance over 30 yrs
- Wildfire 1/10 Low
- Heat 4/10 Moderate 7 d/yr ≥104°F today · 19 d/yr by 30 yrs out
- Wind 2/10 Low 100% chance of damaging wind over 30 yrs
- Air quality 4/10 Moderate 3 unhealthy d/yr today · 5 by 30 yrs out
Nearby sold comps map
Loading sold comps map…
Walkable amenities ~0.75 mi
Loading nearby amenities…
Taxation est. · year 1
- Rental income
- $72,240
- − Mortgage interest
- −$14,839
- − Property taxes
- −$3,146
- − Insurance
- −$1,324
- − Repairs & maintenance
- −$5,779
- − Management
- −$5,779
- − Depreciation
- −$7,706
- Taxable income
- $33,667
- Est. tax owed @ 24.0%
- −$8,080
- After-tax cash flow
- $27,849/yr
For passive investors: Depreciation is non-cash, so a rental often shows a tax loss while cash-flowing — sheltering income. Rental losses are passive: they offset passive income freely, and up to $25,000/yr can offset ordinary (W-2) income if you actively participate and your MAGI is under $100k (phasing out to $0 by $150k); unused losses carry forward. On sale, claimed depreciation is recaptured at up to 25%, and gains may owe capital-gains tax (a 1031 exchange can defer both). Figures are a year-1 estimate at your 24.0% rate — not tax advice; consult a CPA.
Schools (NCES district)
- District
- Ross Local
- NCES district ID
- 3904614
- Math proficiency
- 71% ▼ -9.00%
- Reading proficiency
- 76% ▼ -3.00%
- Median HH income
- $70,035
- Composite
- 64.17/100
- National rank
- #567
- State rank
- #95 of 656 in OH
Livability — Ross
- Score
- 67/100
- State rank
- #591
- US rank
- #10127
Category grades
Schools grade is shown separately in the Schools card above.
Census & demographics
- County
- Butler County · 381,674 people
- Metro
- Cincinnati, OH-KY-IN
- Population (ZIP)
- 53,998
- Household income
- $73,633
- Rent vs Own
- Severe rent burden
- 1047.0
Population outlook (Butler County) Hauer SSP2
- Today (2025)
- 387,706 people
- By 2030
- 392,028 · +1.1%
- By 2040
- 395,307 · +2.0%
- By 2050
- 391,116 · +0.9%
- By 2075
- 378,642 · -2.3%
- By 2100
- 343,248 · -11.5%
Race, ethnicity, and origin ACS 2023
- Neighborhood character
- Predominantly White (88%)
- Race & ethnicity
- White 88% Two or more races 6% Hispanic / Latino 4% Black 3%
- Common ancestry
- Lithuanian 2% Romanian 2% Slovak 2%
- Foreign-born
- 2% · Canada
- Languages at home
- 97% English-only · Spanish 2%
Political lean MEDSL · Butler
- 2024 margin
- Strong R (+26.3) · D 36.4% · R 62.7%
- 2008→2024 swing
- -3.6pp toward R · 2008: -22.6pp · 2024: -26.3pp
- All cycles
- 2024: R+26.3 2020: R+24.0 2016: R+28.3 2012: R+26.2 2008: R+22.6
Not yet ingested
- Civics
- —
Market trends
- HPI YoY
- ▼ -210.85%
- Current HPI
- 237.0239
- Rent YoY
- ▲ 3.69%
- Metro
- Cincinnati, OH-KY-IN
- State GDP YoY
- ▲ 1.98%
- F500 in state
- 48
Industry mix (Fortune 500 HQ in OH)
| Industry | F500 HQs | Revenue |
|---|---|---|
| Insurance | 3 | $145B |
|
||
| Industrial Machinery | 3 | $49B |
|
||
| Financial Services | 3 | $24B |
|
||
| Consumer Goods | 2 | $93B |
|
||
| Aerospace / Defense | 2 | $47B |
|
||
| Utilities | 2 | $33B |
|
||
Price history
+826.2% since first listed5 events — show timeline
- 2025-12-01 Listed $264,900 Cincy MLS
- 2012-05-24 Sold (MLS) $60,500 Cincy MLS
- 2012-05-03 Sold (Public Records) $60,500 Public Records
- 2011-07-19 Listed $76,900 Cincy MLS
- 1988-01-14 Sold (Public Records) $28,600 Public Records
Property tax history
+11.8%/yrLatest (2025): $3,146 · +0.7% YoY. Source: county tax records.
Cash-flow waterfall
monthlySold comps — $/sqft
last 12 mo · ≤1 miLoading sold comps…