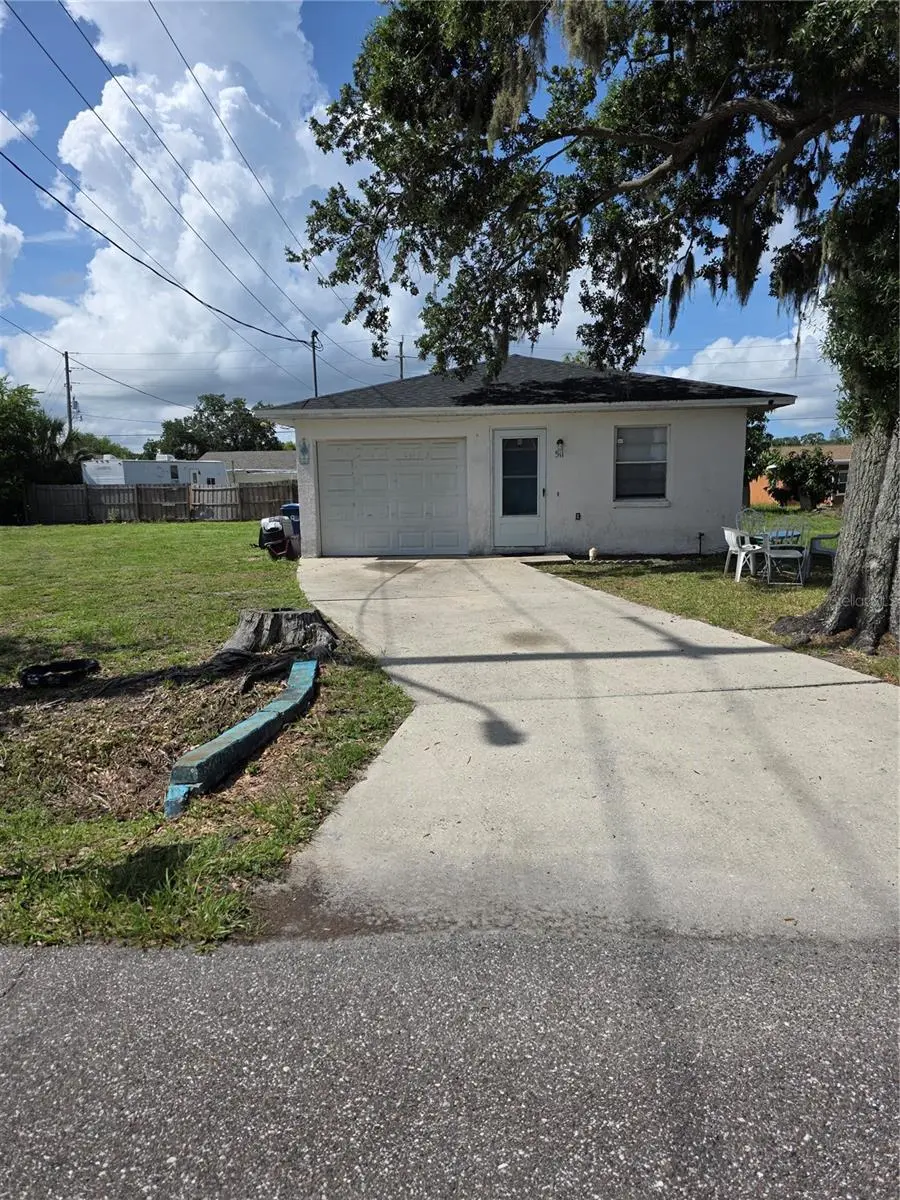
511 30th St E · Memphis, FL
Flood risk 1/10 · Minimal
- FEMA flood zone
- X (unshaded)
- Chance of flooding over 30 yrs
- 0.0%
- Est. flood insurance / yr
- $507 – $1,088
Fire risk 2/10 · Minimal
- Est. fire insurance / yr
- $947 – $1,759
Heat risk 10/10 · Severe
- Hot days now (above 107°F)
- 7 days/yr
- Hot days in 30 yrs
- 29 days/yr
Wind risk 10/10 · Severe
- Chance of severe wind over 30 yrs
- 99.0%
Air-quality risk 3/10 · Minor
- Unhealthy air days now
- 2 days/yr
- Unhealthy air days in 30 yrs
- 2 days/yr
Risk factors via First Street. Map © Google.
Why this score? — see what drove the C grade
The composite is a weighted blend of 9 inputs, each scored 0–100. Each bar is that input's sub-score; the figure is the points it added to the 100-point composite (weight × sub-score).
- Cash flow +19.9/30.0
- ARV discount +14.4/15.0
- DSCR +6.3/10.0
- 1% rule +5.1/10.0
- Schools +4.4/10.0
- Livability +3.2/5.0
- Condition / age +2.5/5.0
- Rent growth +1.8/5.0
- Appreciation +0.0/10.0
$220,000
🖨 Deal sheet 📄 Offer letter ✓ Due diligence
Listing remarks
Perfect opportunity for investors! This 3 bedroom, 1 bath home features a newer roof and plenty of potential. With a little TLC, this property could be transformed into a great rental, flip, or starter home. Don't miss the chance to add value and make it your own!
Key facts
- 5,001 sq ft lot
- Garage
- Built 2000
Property features AI
Finance
- Other: Zoning: RSF6
- Financial info: No lease restrictions; Unfurnished
- HOA & community: No HOA/association indicated
Exterior
- Parking: Attached garage with space for 1 vehicle
- Utilities: Public water; Public sewer; Public utilities
- Home design: Single-family residence; One story; North-facing
- Construction: Block construction; Shingle roof; Slab foundation; Built area about 1,070 (source: public records)
- Exterior features: Paved road access; Lot dimensions approximately 50 x 100
Interior
- Kitchen: No appliances included
- Bedrooms: 3 bedrooms
- Flooring: Tile flooring
- Bathrooms: 2 full bathrooms
- Heating & cooling: Central heating; Central air conditioning
- Interior features: Other interior features
- Laundry & utility: No laundry features
Neighborhood map
What this means for you Summary
Snapshot
- This is a 3-bed/1.0-bath single-family listed at $220k.
Deal economics
- At list price, monthly cash flow is $267 ($3k/yr) — positive.
- The deal already cash-flows at list — no discount required.
- Meets the 1% rule at list price ($2k rent vs $220k).
- Cap rate 7.7% vs local median 4.5% in Memphis — top-decile yield for the area; either an underpriced asset or a hidden risk that comps aren't pricing in. Stress-test before assuming the spread holds.
Location & tenants
- Location reads 63/100 on livability (#745 in FL) — a middle-class / working-renter tenant base. Strengths: cost of living A+, housing A+; Watch: employment D+, schools F, amenities F.
- Manatee (suburban): math 54% / reading 50% proficiency, ranked #26 of 73 in FL (top 36%) — acceptable for families but not a draw, mixed tenant base, ~2y average lease.
- Market conditions: Rents soft (-3.0%/yr); 1160 active listings in the ZIP; 17 comparable units currently listed for rent nearby; rentals at typical pace (median 24d on market — plan ~3-4 weeks tenant-placement turnaround); solid renter incomes; 7,472 units permitted in Manatee County in 2024 (1,782 in 5+ unit buildings).
- This rent runs 34% of the median local income ($78k/yr) — at the standard rent-burdened threshold; future hikes will face affordability resistance.
Forward outlook
- Local home prices are declining (-3.0%/yr); year-one equity from $2k of loan paydown is wiped out by about $7k of value loss. Plan a longer hold.
- Manatee County population projected at +43% by 2050 — long-run rental-demand tailwind backs the buy-and-hold thesis.
Negotiation context
- Only 5 days on market — expect competitive offers; lowballing is unlikely to land.
Risks & watch-outs
- Climate carrying-cost: severe wind risk, 99% chance of damaging wind over 30y; extreme-heat days projected 7→29/yr by 2055 (HVAC capex compounding) — expect insurance premiums to compound above CPI over the hold.
Questions for the listing agent
- Is there a deadline driving the sale (1031 exchange, divorce, estate, relocation)? That informs how much negotiation room exists.
- Schools are F-rated, which usually means shorter tenancies and higher turnover. Who's the typical renter profile here, and what's been the actual vacancy rate?
- What's the average days-on-market for RENTAL listings here right now (not sales)? A rising rental-DOM trend means longer vacancies and softer asking-rent achievability than the comps imply.
- What's the recent tenant-quality profile in this submarket — average credit score on applications, eviction rate, late-payment / NSF rate, and stable-employment percentage? A property-management company in the area should have these aggregated.
- How much new for-sale + rental construction is in the pipeline within 1–3 miles? Heavy new supply typically softens prices + rents 12–24 months out; constrained supply supports both.
Investment metrics
- 1% rule
- 1.01% ✓
- Cap rate
- 7.75%
- Cash-on-cash
- 5.20%
- DSCR
- 1.23
- GRM
- 8.3
CMA / ARV
- ARV (on-the-fly)
- $260,010
- Comps found
- 12
Show comp detail 12 sales within ~0.75 mi
| Address | Dist | Beds/Ba | Sqft | Sold | Price | $/sf | Match |
|---|---|---|---|---|---|---|---|
| 2411 5th Avenue Dr E | 0.33mi | 3/2.0 | 1,104 (+3%) | 9mo | $257,500 | $233 | 68 |
| 1111 26th Street Ct E | 0.42mi | 3/1.0 | 1,084 (+1%) | 14mo | $215,000 | $198 | 66 |
| 2706 6th Ave E | 0.15mi | 3/2.0 | 1,152 (+8%) | 13mo | $287,000 | $249 | 65 |
| 820 32nd St E | 0.29mi | 3/1.0 | 984 (-8%) | 14mo | $269,900 | $274 | 61 |
| 616 30th St E | 0.07mi | 4/2.0 (+1) | 1,152 (+8%) | 18mo | $260,000 | $226 | 60 |
| 2312 4th Ave E | 0.40mi | 3/2.0 | 1,110 (+4%) | 14mo | $277,900 | $250 | 59 |
| 528 29th St E | 0.04mi | 3/2.0 | 1,217 (+14%) | 17mo | $179,000 | $147 | 57 |
| 3 Shady Ln | 0.47mi | 2/2.0 (-1) | 1,113 (+4%) | 16mo | $112,000 | $101 | 49 |
| 3230 6th Ave W | 0.68mi | 3/2.0 | 1,072 (+0%) | 18mo | $305,000 | $285 | 48 |
| 3305 6th Ave W | 0.74mi | 2/2.0 (-1) | 1,068 (-0%) | 13mo | $260,000 | $243 | 46 |
| 3229 6th Ave W | 0.71mi | 2/2.0 (-1) | 1,010 (-6%) | 14mo | $283,000 | $280 | 37 |
| 316 20th St E | 0.61mi | 3/2.0 | 1,225 (+14%) | 14mo | $289,900 | $237 | 32 |
Match score weights: distance 35% · size 25% · config 20% · recency 20%. Top-matched comps best support the ARV.
Projected returns pro-forma
-3.0% appreciation · 0.0% rent growth · sell at horizon
- IRR
- -11.6%
- Equity multiple
- 0.59×
- Total profit
- $-25,143
- Equity at exit
- $32,803
- IRR
- -7.4%
- Equity multiple
- 0.59×
- Total profit
- $-25,071
- Equity at exit
- $19,022
Cash invested: $61,600 (down + closing). Projections, not guarantees.
Landlord ↔ Tenant lean methodology
- Overall (STATE)
- 87 Strongly Landlord-Friendly
- State Florida
- 87 Strongly Landlord-Friendly · R+3
- County
- — inherits STATE
- City
- — inherits STATE
ZIP-level market 34221
- Rents YoY
- -3.0%
- Active inventory
- 1160
- Price-to-rent
- 8.3×
Monthly cashflow live
- Estimated rent
- $2,216 high interval (Pro) →
- Mortgage (P&I)
- −$1,154
- Tax from tax record
- −$239 /mo · $2,863/yr
- Insurance
- −$92
- HOA
- −$0
- Vacancy / Maint / Mgmt
- −$465
- Net cashflow
- $267
Break-even live
UW: 25.0% down · 7.5% · 30yr · 1.5% tax · 5.0% vac · 8.0% maint · 8.0% mgmt
Financing live
Cash to close
- Down payment
- $55,000
- Closing costs
- $6,600
- Reserves months
- —
- Total cash needed
- —
Loan-product check · same deal, 3 products live
Conventional
25% down · 7.5% · 30yr
- Down + closing
- —
- Monthly P&I
- —
- Monthly cashflow
- —
- DSCR
- —
- Eligible?
- —
Personal DTI + credit; lowest rate.
DSCR
20% down · 8.5% · 30yr
- Down + closing
- —
- Monthly P&I
- —
- Monthly cashflow
- —
- DSCR
- —
- Eligible?
- —
No personal income docs; deal must DSCR.
Hard money
10% down · 12.0% · 12mo
- Down + closing
- —
- Monthly P&I
- —
- Monthly cashflow
- —
- DSCR
- —
- Eligible?
- —
Short-term bridge; refi at stabilization.
Rent comps 17 comps
| Address | Beds | Baths | Sqft | Rent | $/sqft | DOM | Units | Dist |
|---|---|---|---|---|---|---|---|---|
| 307 27th St E Palmetto, FL | 2.0 | 2.0 | 980 | $2,000 | $2.04 | 23d | 1 | 0.22mi |
| 2615 9th Avenue Dr E Palmetto, FL | 3.0 | 2.0 | 1369 | $2,200 | $1.61 | 23d | 1 | 0.29mi |
| 719 23rd St E Palmetto, FL | 3.0 | 2.0 | 1060 | $1,800 | $1.70 | 10d | 1 | 0.44mi |
| 900 21st St E Palmetto, FL | 2.0–3.0 | 1.0 | 800 | $1,795 | $2.24 | 23d | 1 | 0.49mi |
| 2211 11th Ave E Palmetto, FL | 3.0 | 2.0 | 1285 | $2,195 | $1.71 | 16d | 1 | 0.56mi |
| 1910 3rd Ave E Palmetto, FL | 4.0 | 2.0 | 1214 | $2,600 | $2.14 | 23d | 1 | 0.67mi |
| 3222 6th Ave W Palmetto, FL | 3.0 | 2.0 | 1414 | $2,185 | $1.55 | 23d | 1 | 0.69mi |
| 1809 5th Ave W Palmetto, FL | 3.0 | 1.0 | 962 | $1,895 | $1.97 | 23d | 1 | 0.87mi |
| 709 45th St E Palmetto, FL | 2.0 | 2.0 | 1000 | $1,550 | $1.55 | 3d | 1 | 0.88mi |
| 515 45th St E Palmetto, FL | 2.0 | 2.0 | 900 | $2,100 | $2.33 | 23d | 1 | 0.93mi |
| 1607 18th St E Palmetto, FL | 3.0 | 1.0 | 916 | $1,950 | $2.13 | 23d | 1 | 1.02mi |
| 4721 1st Ave E #4721 Palmetto, FL | 3.0 | 2.0 | 1460 | $2,000 | $1.37 | 23d | 1 | 1.18mi |
| 501 11th St W Palmetto, FL | 2.0 | 1.0 | 850 | $1,340 | $1.58 | 2d | 1 | 1.39mi |
| 2225 14th Ave W Palmetto, FL | 2.0 | 2.0 | 1120 | $1,895 | $1.69 | 23d | 1 | 1.44mi |
| 2225 14th Ave W Unit 204 Palmetto, FL | 2.0 | 2.0 | 1120 | $1,795 | $1.60 | 23d | 1 | 1.44mi |
| 2320 Terra Ceia Bay Blvd #211 Palmetto, FL | 2.0 | 2.0 | 978 | $2,500 | $2.56 | 23d | 1 | 1.46mi |
| 3115 Live Oak Ln #30 Palmetto, FL | 2.0 | 2.0 | 1253 | $3,695 | $2.95 | 23d | 1 | 1.48mi |
Listing history 6 events
-
2026-06-18days on market $220,000 Active 5 DOM
-
2026-06-17days on market $220,000 Active 4 DOM
-
2026-06-16days on market $220,000 Active 3 DOM
-
2026-06-15days on market $220,000 Active 2 DOM
-
2026-06-13remarks 264-char remark
-
2026-06-13$220,000 Active 1 DOM
ⓘ Source: listings_history table (triggers on properties + properties_extension) + one-shot
backfill from property_details.listing_events for pre-trigger history.
Tax reassessment forecast FL · Resets to sale price
- Current annual tax
- $2,863 · $239/mo
- Projected year-2 tax
- $2,863 · $239/mo
- Expected delta
- $0/yr ($0/mo · 0.0%)
ⓘ Screening estimate from a state-policy table — verify with the county assessor before closing.
Climate risk First Street
- Flood 1/10 Low FEMA zone X (unshaded) · 0% chance over 30 yrs
- Wildfire 2/10 Low
- Heat 10/10 Extreme 7 d/yr ≥107°F today · 29 d/yr by 30 yrs out
- Wind 10/10 Extreme 99% chance of damaging wind over 30 yrs
- Air quality 3/10 Moderate 2 unhealthy d/yr today · 2 by 30 yrs out
Nearby sold comps map
Loading sold comps map…
Walkable amenities ~0.75 mi
Loading nearby amenities…
Taxation est. · year 1
- Rental income
- $26,593
- − Mortgage interest
- −$12,323
- − Property taxes
- −$2,863
- − Insurance
- −$1,100
- − Repairs & maintenance
- −$2,127
- − Management
- −$2,127
- − Depreciation
- −$6,400
- Taxable loss
- −$348
- Est. tax savings @ 24.0%
- +$84
- After-tax cash flow
- $3,285/yr
For passive investors: Depreciation is non-cash, so a rental often shows a tax loss while cash-flowing — sheltering income. Rental losses are passive: they offset passive income freely, and up to $25,000/yr can offset ordinary (W-2) income if you actively participate and your MAGI is under $100k (phasing out to $0 by $150k); unused losses carry forward. On sale, claimed depreciation is recaptured at up to 25%, and gains may owe capital-gains tax (a 1031 exchange can defer both). Figures are a year-1 estimate at your 24.0% rate — not tax advice; consult a CPA.
Schools (NCES district)
- District
- Manatee
- NCES district ID
- 1201230
- Math proficiency
- 54% ▼ -6.00%
- Reading proficiency
- 50% ▼ -2.00%
- Median HH income
- $49,607
- Composite
- 44.43/100
- National rank
- #2806
- State rank
- #26 of 73 in FL
Livability — Memphis
- Score
- 63/100
- State rank
- #745
- US rank
- #16072
Category grades
Schools grade is shown separately in the Schools card above.
Census & demographics
- Census place
- Memphis, FL
- County
- Manatee County · 416,364 people
- Metro
- North Port-Sarasota-Bradenton, FL
- Population (ZIP)
- 56,208
- Household income
- $77,712
- Rent vs Own
- Severe rent burden
- 1193.0
Population outlook (Manatee County) Hauer SSP2
- Today (2025)
- 447,342 people
- By 2030
- 488,911 · +9.3%
- By 2040
- 567,934 · +27.0%
- By 2050
- 637,995 · +42.6%
- By 2075
- 781,970 · +74.8%
- By 2100
- 848,272 · +89.6%
Race, ethnicity, and origin ACS 2023
- Neighborhood character
- Diverse neighborhood (Simpson 0.58)
- Race & ethnicity
- White 59% Hispanic / Latino 22% Black 14% Two or more races 11%
- Hispanic origin (detail)
- Mexican 14% Puerto Rican 3%
- Common ancestry
- Romanian 2% Lithuanian 2% Italian 2%
- Foreign-born
- 10% · Canada, Dominican Republic, Jamaica
- Languages at home
- 81% English-only · Spanish 16% Other Indo-European 1%
Political lean MEDSL · Manatee
- 2024 margin
- Strong R (+23.5) · D 37.9% · R 61.4%
- 2008→2024 swing
- -16.5pp toward R · 2008: -7.0pp · 2024: -23.5pp
- All cycles
- 2024: R+23.5 2020: R+16.1 2016: R+17.1 2012: R+12.5 2008: R+7.0
Not yet ingested
- Civics
- —
Market trends
- HPI YoY
- ▼ -383.53%
- Current HPI
- 302.1458
- Rent YoY
- ▼ -2.98%
- Metro
- North Port-Sarasota-Bradenton, FL
- State GDP YoY
- ▲ 3.28%
- F500 in state
- 36
Industry mix (Fortune 500 HQ in FL)
| Industry | F500 HQs | Revenue |
|---|---|---|
| Industrial Technology | 2 | $29B |
|
||
| Insurance | 2 | $17B |
|
||
| Retail | 1 | $60B |
|
||
| Technology Distribution | 1 | $58B |
|
||
| Homebuilding | 1 | $35B |
|
||
| Technology Manufacturing | 1 | $35B |
|
||
Price history
1 event — show timeline
- 2026-06-13 Listed $220,000 Stellar MLS as Distributed by MLS Grid
Property tax history
+7.7%/yrLatest (2025): $2,863 · +7.4% YoY. Source: county tax records.
Cash-flow waterfall
monthlySold comps — $/sqft
last 12 mo · ≤1 miLoading sold comps…