110 S 14th St · Lafayette, IN
Flood risk 1/10 · Minimal
- FEMA flood zone
- X (unshaded)
- Chance of flooding over 30 yrs
- 0.0%
- Est. flood insurance / yr
- $473 – $860
Fire risk 1/10 · Minimal
- Est. fire insurance / yr
- $717 – $1,331
Heat risk 3/10 · Minor
- Hot days now (above 102°F)
- 7 days/yr
- Hot days in 30 yrs
- 18 days/yr
Wind risk 2/10 · Minimal
- Chance of severe wind over 30 yrs
- —
Air-quality risk 2/10 · Minimal
- Unhealthy air days now
- 1 days/yr
- Unhealthy air days in 30 yrs
- 2 days/yr
Risk factors via First Street. Map © Google.
Why this score? — see what drove the D+ grade
The composite is a weighted blend of 9 inputs, each scored 0–100. Each bar is that input's sub-score; the figure is the points it added to the 100-point composite (weight × sub-score).
- Cash flow +14.3/30.0
- ARV discount +13.8/15.0
- DSCR +4.3/10.0
- 1% rule +3.9/10.0
- Rent growth +3.8/5.0
- Livability +3.7/5.0
- Schools +2.6/10.0
- Condition / age +2.5/5.0
- Appreciation +0.0/10.0
$155,000
🖨 Deal sheet (PDF) 📄 Offer letter ✓ Due diligence
Listing remarks MLS
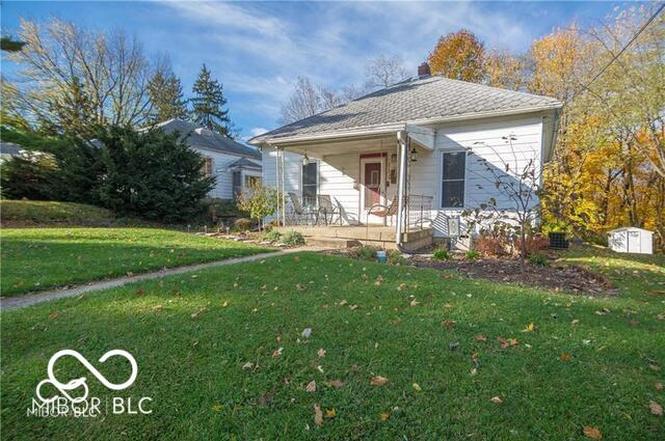
This quaint home backs up to a wooded lot. It's beautifully landscaped and reflects pride of ownership. 9 Ft ceilings, spacious living room, and a formal dining area. The home also features a full unfinished basement perfect for storage, a workshop, or a craft area. Perfect location for those looking to be close to downtown or Purdue. Updates in the past two years include new crown molding, flooring, lighting, new disposal, new water heater, new bathroom, electrical upgrades, some plumbing replaced, new landscaping. All but 2 walls are new!
Key facts
- Wooded lot
- New landscaping
- Formal dining area
Tags
Neighborhood map
What this means for you Summary
Snapshot
- This is a 3-bed/1.0-bath single-family listed at $155k.
Deal economics
- At list price, monthly cash flow is $27 ($326/yr) — positive.
- The deal already cash-flows at list — no discount required.
- To meet the 1% rule (rent ≥ 1% of price), the offer needs to be $137k (11.5% below list).
- Recommended offer: $137k (11.5% below list) — sets the bar for 1% rule.
- Cap rate 6.5% vs local median 4.2% in Lafayette — top-decile yield for the area; either an underpriced asset or a hidden risk that comps aren't pricing in. Stress-test before assuming the spread holds.
Location & tenants
- Location reads 74/100 on livability (#68 in IN, #4,374 nationally) — a middle-class / working-renter tenant base. Strengths: cost of living A+, housing A+, health & safety A+; Watch: amenities D+, employment D+, crime F.
- Lafayette School Corporation (urban): math 29% / reading 34% proficiency, ranked #235 of 301 in IN (top 78%) — families likely to look elsewhere, expect single-tenant / working-renter base with shorter leases; 63% free/reduced lunch — lower-income household profile, screen leases tightly.
- Zoned schools: Thomas Miller Elementary School (math 27% / reading 22%, grade F, #762 of 994 statewide, top 78%, 343 students, 85% FRL); Jefferson High School (math 23% / reading 55%, grade F, #235 of 369 statewide, top 65%, 2,118 students, 69% FRL).
- Market conditions: Rents rising fast (+5.1%/yr); 219 active listings in the ZIP; 40 comparable units currently listed for rent nearby; rentals at typical pace (median 22d on market — plan ~3-4 weeks tenant-placement turnaround); 42% of comp listings sitting > 30 days — soft ceiling on asking rent; 1,341 units permitted in Tippecanoe County in 2024 (869 in 5+ unit buildings).
Forward outlook
- Local home prices are declining (-3.0%/yr); year-one equity from $1k of loan paydown is wiped out by about $5k of value loss. Plan a longer hold.
- Tippecanoe County population projected at +41% by 2050 — long-run rental-demand tailwind backs the buy-and-hold thesis.
Negotiation context
- It's been on market 84 days — a 6% lower offer ($146k) is reasonable based on typical stale-listing flexibility.
- 5 sale attempts since 11y ago; this cycle's ask has dropped $30k (16%) from the opening price — seller is motivated, your offer sets the floor, not the list.
- Current owner paid $84k; list at $155k implies a 85% gain — meaningful room to come down on a strong offer.
Risks & watch-outs
- Watch-outs: built in 1930 — expect roof / HVAC / electrical / plumbing capex.
Questions for the listing agent
- It's been on market 84 days. Have you received any prior offers? Is the seller open to a 11% concession, seller financing, or rate buy-down credit?
- Built in 1930 — when were the roof, HVAC, electrical panel, plumbing, and water heater last replaced?
- Why hasn't it sold? Are there any deal-killer items the seller is aware of (foundation, flood, title, zoning, code violations)?
- Is there a deadline driving the sale (1031 exchange, divorce, estate, relocation)? That informs how much negotiation room exists.
- Schools are D-rated, which usually means shorter tenancies and higher turnover. Who's the typical renter profile here, and what's been the actual vacancy rate?
- Crime grade is F in this area — have there been break-ins, vandalism, or insurance claims at this property in the last 3 years? What carrier currently insures it and at what premium?
- The area grade is low — what's the realistic commute time and amenity access for the typical tenant pool here? Any planned neighborhood developments (good or bad) we should know about?
- What's the average days-on-market for RENTAL listings here right now (not sales)? A rising rental-DOM trend means longer vacancies and softer asking-rent achievability than the comps imply.
- What's the recent tenant-quality profile in this submarket — average credit score on applications, eviction rate, late-payment / NSF rate, and stable-employment percentage? A property-management company in the area should have these aggregated.
- How much new for-sale + rental construction is in the pipeline within 1–3 miles? Heavy new supply typically softens prices + rents 12–24 months out; constrained supply supports both.
Investment metrics
- 1% rule
- 0.89% ✗
- Cap rate
- 6.50%
- Cash-on-cash
- 0.75%
- DSCR
- 1.03
- GRM
- 9.4
CMA / ARV
- ARV (on-the-fly)
- $180,180
- Comps found
- 12
Show comp detail 12 sales within ~0.75 mi
| Address | Dist | Beds/Ba | Sqft | Sold | Price | $/sf | Match |
|---|---|---|---|---|---|---|---|
| 826 S 18th St | 0.57mi | 3/1.0 | 1,064 (-3%) | 0mo | $150,000 | $141 | 69 |
| 622 S 21st St | 0.59mi | 3/1.0 | 1,144 (+5%) | 4mo | $192,000 | $168 | 61 |
| 1114 Kossuth St | 0.38mi | 2/1.5 (-1) | 1,179 (+8%) | 4mo | $195,000 | $165 | 59 |
| 819 S 19th St | 0.60mi | 3/1.0 | 988 (-10%) | 1mo | $110,000 | $111 | 55 |
| 1910 Perdue St | 0.45mi | 2/1.0 (-1) | 993 (-9%) | 8mo | $160,000 | $161 | 52 |
| 1118 S 14th St | 0.69mi | 3/1.5 | 1,152 (+6%) | 8mo | $217,000 | $188 | 50 |
| 715 S 5th St | 0.66mi | 3/2.0 | 1,008 (-8%) | 4mo | $164,900 | $164 | 49 |
| 633 S 24th St | 0.74mi | 3/1.0 | 1,016 (-7%) | 8mo | $110,000 | $108 | 47 |
| 1202 S 14th St | 0.71mi | 2/1.0 (-1) | 1,042 (-5%) | 10mo | $206,000 | $198 | 46 |
| 1204 Central St | 0.63mi | 3/1.5 | 1,246 (+14%) | 2mo | $270,000 | $217 | 43 |
| 1401 Franklin St | 0.59mi | 2/2.0 (-1) | 1,192 (+9%) | 9mo | $225,000 | $189 | 40 |
| 1203 Central St | 0.66mi | 2/1.0 (-1) | 1,222 (+12%) | 10mo | $200,000 | $164 | 36 |
Match score weights: distance 35% · size 25% · config 20% · recency 20%. Top-matched comps best support the ARV.
Projected returns pro-forma
-3.0% appreciation · 5.12% rent growth · sell at horizon
- IRR
- -12.8%
- Equity multiple
- 0.53×
- Total profit
- $-20,388
- Equity at exit
- $23,111
- IRR
- -0.8%
- Equity multiple
- 0.94×
- Total profit
- $-2,672
- Equity at exit
- $13,402
Cash invested: $43,400 (down + closing). Projections, not guarantees.
Landlord ↔ Tenant lean methodology
- Overall (STATE)
- 90 Strongly Landlord-Friendly
- State Indiana
- 90 Strongly Landlord-Friendly · R+11
- County
- — inherits STATE
- City
- — inherits STATE
ZIP-level market 47905
- Home prices YoY
- -33.2%
- Rents YoY
- 5.1%
- Active inventory
- 219
- Price-to-rent
- 9.4×
Monthly cashflow live
- Estimated rent
- $1,372 high interval (Pro) →
- Mortgage (P&I)
- −$813
- Tax from tax record
- −$180 /mo · $2,154/yr
- Insurance
- −$65
- HOA
- −$0
- Vacancy / Maint / Mgmt
- −$288
- Net cashflow
- $27
Break-even live
Sensitivity live
| Price | -10% $115 | -5% $71 | +0% $27 | +5% $-17 | +10% $-61 |
|---|---|---|---|---|---|
| Rent | -10% $-81 | -5% $-27 | +0% $27 | +5% $81 | +10% $136 |
| Rate | -1.0pp $105 | -0.5pp $67 | base $27 | +0.5pp $-13 | +1.0pp $-54 |
UW: 25.0% down · 7.5% · 30yr · 1.5% tax · 5.0% vac · 8.0% maint · 8.0% mgmt
Financing live
Cash to close
- Down payment
- $38,750
- Closing costs
- $4,650
- Reserves months
- —
- Total cash needed
- —
Loan-product check · same deal, 3 products live
Conventional
25% down · 7.5% · 30yr
- Down + closing
- —
- Monthly P&I
- —
- Monthly cashflow
- —
- DSCR
- —
- Eligible?
- —
Personal DTI + credit; lowest rate.
DSCR
20% down · 8.5% · 30yr
- Down + closing
- —
- Monthly P&I
- —
- Monthly cashflow
- —
- DSCR
- —
- Eligible?
- —
No personal income docs; deal must DSCR.
Hard money
10% down · 12.0% · 12mo
- Down + closing
- —
- Monthly P&I
- —
- Monthly cashflow
- —
- DSCR
- —
- Eligible?
- —
Short-term bridge; refi at stabilization.
Rent comps 40 comps
| Address | Beds | Baths | Sqft | Rent | $/sqft | DOM | Units | Dist |
|---|---|---|---|---|---|---|---|---|
| 1512 Main St Unit 1 Lafayette, IN | 2.0 | 1.5 | 1200 | $1,349 | $1.12 | 14d | 1 | 0.20mi |
| 1422 Main St Unit 05 Lafayette, IN | 2.0 | 1.0 | 780 | $875 | $1.12 | 22d | 1 | 0.21mi |
| 1611 Grove St Lafayette, IN | 3.0 | 1.5 | 1250 | $1,195 | $0.96 | 14d | 1 | 0.22mi |
| 409 S 15th St Lafayette, IN | 2.0 | 2.0 | 864 | $1,200 | $1.39 | 45d | 1 | 0.24mi |
| 1024 Main St Unit 10245 Lafayette, IN | 2.0 | 1.0 | 1200 | $1,350 | $1.12 | 22d | 1 | 0.29mi |
| 1739 Main St Unit 5 Lafayette, IN | 3.0 | 1.0 | 850 | $1,200 | $1.41 | 45d | 1 | 0.29mi |
| 1739 Main St Unit 7 Lafayette, IN | 3.0 | 1.0 | 750 | $1,300 | $1.73 | 14d | 1 | 0.29mi |
| 612 S 10th St Unit 612 Lafayette, IN | 2.0 | 1.0 | 1028 | $1,035 | $1.01 | 14d | 1 | 0.42mi |
| 205 S 6th St Lafayette, IN | 2.0 | 1.0 | 1123 | $1,200 | $1.07 | 22d | 1 | 0.44mi |
| 400 N 9th St Lafayette, IN | 1.0–2.0 | 1.0–2.0 | 1600 | $2,675 | $1.67 | 45d | 2 | 0.44mi |
| 721 North St Apt 2 Lafayette, IN | 2.0 | 1.0 | 1036 | $900 | $0.87 | 45d | 1 | 0.47mi |
| 500 South St Lafayette, IN | 1.0–2.0 | 1.0–2.0 | 1232 | $2,000 | $1.62 | 22d | 1 | 0.51mi |
| 117 N 5th St Lafayette, IN | 2.0 | 1.0–1.5 | 1123 | $1,632 | $1.45 | 22d | 4 | 0.54mi |
| 475 South St Lafayette, IN | 1.0–2.0 | 1.0–2.0 | 870 | $2,100 | $2.41 | 14d | 12 | 0.54mi |
| 2026 Scott St Lafayette, IN | 2.0 | 2.0 | 1025 | $1,450 | $1.41 | 45d | 1 | 0.56mi |
| 6 S 4th St Lafayette, IN | 1.0–3.0 | 1.0–3.0 | 1102 | $1,649 | $1.50 | 14d | 1 | 0.60mi |
| 811 Union St Unit 813 Lafayette, IN | 2.0 | 1.0 | 700 | $850 | $1.21 | 22d | 1 | 0.67mi |
| 802 N 9th St Lafayette, IN | 2.0 | 1.0–2.0 | 902 | $789 | $0.87 | 14d | 1 | 0.68mi |
| 407 N 24th St Lafayette, IN | 3.0 | 2.0 | 1388 | $2,200 | $1.59 | 45d | 1 | 0.71mi |
| 549 S 3rd St Lafayette, IN | 2.0 | 1.0 | 1000 | $1,100 | $1.10 | 45d | 1 | 0.71mi |
| 423 N 3rd St Lafayette, IN | 2.0 | 1.0 | 1100 | $1,379 | $1.25 | 45d | 1 | 0.74mi |
| 901 S 4th St Lafayette, IN | 1.0–2.0 | 1.0 | 739 | $1,033 | $1.40 | 14d | 3 | 0.81mi |
| 2107 Central St Lafayette, IN | 2.0 | 1.0 | 816 | $1,179 | $1.44 | 45d | 1 | 0.83mi |
| 915 N 6th St Lafayette, IN | 2.0–3.0 | 1.0–2.0 | 850 | $2,100 | $2.47 | 45d | 4 | 0.84mi |
| 1213 S 19th St Lafayette, IN | 3.0 | 2.0 | 1484 | $1,900 | $1.28 | 14d | 1 | 0.85mi |
| 510 Salem St Lafayette, IN | 2.0 | 1.0–2.0 | 767 | $1,138 | $1.48 | 45d | 1 | 0.87mi |
| 1103 N 7th St Unit 4 Lafayette, IN | 2.0 | 1.0 | 750 | $920 | $1.23 | 45d | 1 | 0.90mi |
| 1033 Holloway St Lafayette, IN | 2.0 | 1.0 | 780 | $1,150 | $1.47 | 14d | 1 | 1.05mi |
| 1719 Morton St Lafayette, IN | 2.0 | 1.0 | 820 | $1,179 | $1.44 | 45d | 1 | 1.06mi |
| 1102 Holloway St Apt 2 Lafayette, IN | 2.0 | 1.0 | 747 | $995 | $1.33 | 45d | 1 | 1.08mi |
| 335 S 31st St Lafayette, IN | 2.0 | 1.0 | 840 | $1,250 | $1.49 | 14d | 1 | 1.10mi |
| 320 Brown St West Lafayette, IN | 1.0–4.0 | 1.0–2.0 | 835 | $1,399 | $1.68 | 14d | 12 | 1.11mi |
| 1226 Greenbush St Lafayette, IN | 2.0 | 1.0 | 800 | $800 | $1.00 | 45d | 1 | 1.12mi |
| 1502 N 13th St Lafayette, IN | 3.0 | 1.0 | 1000 | $1,050 | $1.05 | 45d | 1 | 1.13mi |
| 512 Portledge Commons Dr Lafayette, IN | 1.0–2.0 | 1.0–2.0 | 978 | $1,325 | $1.35 | 45d | 1 | 1.13mi |
| 2450 S Earl Ave Lafayette, IN | 1.0–2.0 | 1.0 | 755 | $1,214 | $1.61 | 14d | 3 | 1.15mi |
| 1510 N 10th St Unit FP205 Lafayette, IN | 3.0 | 1.0 | 1050 | $1,197 | $1.14 | 14d | 1 | 1.16mi |
| 1707 Meharry St Lafayette, IN | 3.0 | 2.0 | 1348 | $1,500 | $1.11 | 22d | 1 | 1.23mi |
| 400 N River Rd West Lafayette, IN | 3.0 | 1.0–3.0 | 693 | $1,229 | $1.77 | 14d | 42 | 1.29mi |
| 120 S Salisbury St West Lafayette, IN | 3.0 | 2.0 | 935 | $1,399 | $1.50 | 14d | 1 | 1.32mi |
Listing history 12 events
-
2026-04-16status Pending
-
2026-04-10price $155,000
-
2026-03-27price $169,000
-
2026-02-14price $175,000
-
2026-01-22$185,000 Active
-
2019-04-19soldstatus $84,000 546-char remark
Show marketing remark (546 chars)
This quaint home backs up to a wooded lot. It's beautifully landscaped and reflects pride of ownership. 9 Ft ceilings, spacious living room, and a formal dining area. The home also features a full unfinished basement perfect for storage, a workshop, or a craft area. Perfect location for those looking to be close to downtown or Purdue. Updates in the past two years include new crown molding, flooring, lighting, new disposal, new water heater, new bathroom, electrical upgrades, some plumbing replaced, new landscaping. All but 2 walls are new!
-
2019-04-19soldstatus $84,000
Show marketing remark (546 chars)
This quaint home backs up to a wooded lot. It's beautifully landscaped and reflects pride of ownership. 9 Ft ceilings, spacious living room, and a formal dining area. The home also features a full unfinished basement perfect for storage, a workshop, or a craft area. Perfect location for those looking to be close to downtown or Purdue. Updates in the past two years include new crown molding, flooring, lighting, new disposal, new water heater, new bathroom, electrical upgrades, some plumbing replaced, new landscaping. All but 2 walls are new!
-
2018-11-09$89,900 546-char remark
Show marketing remark (546 chars)
This quaint home backs up to a wooded lot. It's beautifully landscaped and reflects pride of ownership. 9 Ft ceilings, spacious living room, and a formal dining area. The home also features a full unfinished basement perfect for storage, a workshop, or a craft area. Perfect location for those looking to be close to downtown or Purdue. Updates in the past two years include new crown molding, flooring, lighting, new disposal, new water heater, new bathroom, electrical upgrades, some plumbing replaced, new landscaping. All but 2 walls are new!
-
2018-11-09$89,900
Show marketing remark (546 chars)
This quaint home backs up to a wooded lot. It's beautifully landscaped and reflects pride of ownership. 9 Ft ceilings, spacious living room, and a formal dining area. The home also features a full unfinished basement perfect for storage, a workshop, or a craft area. Perfect location for those looking to be close to downtown or Purdue. Updates in the past two years include new crown molding, flooring, lighting, new disposal, new water heater, new bathroom, electrical upgrades, some plumbing replaced, new landscaping. All but 2 walls are new!
-
2016-12-16soldstatus $62,500
-
2016-04-22$62,500
-
2015-07-10$65,000
ⓘ Source: listings_history table (triggers on properties + properties_extension) + one-shot
backfill from property_details.listing_events for pre-trigger history.
Tax reassessment forecast IN · Partial reset (capped growth)
- Current annual tax
- $2,154 · $180/mo
- Projected year-2 tax
- $2,154 · $180/mo
- Expected delta
- $0/yr ($0/mo · 0.0%)
ⓘ Screening estimate from a state-policy table — verify with the county assessor before closing.
Climate risk First Street
- Flood 1/10 Low FEMA zone X (unshaded) · 0% chance over 30 yrs
- Wildfire 1/10 Low
- Heat 3/10 Moderate 7 d/yr ≥102°F today · 18 d/yr by 30 yrs out
- Wind 2/10 Low
- Air quality 2/10 Low 1 unhealthy d/yr today · 2 by 30 yrs out
Nearby sold comps map
Loading sold comps map…
Walkable amenities ~0.75 mi
Loading nearby amenities…
Taxation est. · year 1
- Rental income
- $16,467
- − Mortgage interest
- −$8,682
- − Property taxes
- −$2,154
- − Insurance
- −$775
- − Repairs & maintenance
- −$1,317
- − Management
- −$1,317
- − Depreciation
- −$4,509
- Taxable loss
- −$2,289
- Est. tax savings @ 24.0%
- +$549
- After-tax cash flow
- $875/yr
For passive investors: Depreciation is non-cash, so a rental often shows a tax loss while cash-flowing — sheltering income. Rental losses are passive: they offset passive income freely, and up to $25,000/yr can offset ordinary (W-2) income if you actively participate and your MAGI is under $100k (phasing out to $0 by $150k); unused losses carry forward. On sale, claimed depreciation is recaptured at up to 25%, and gains may owe capital-gains tax (a 1031 exchange can defer both). Figures are a year-1 estimate at your 24.0% rate — not tax advice; consult a CPA.
Schools (NCES district)
- District
- Lafayette School Corporation
- NCES district ID
- 1805400
- Math proficiency
- 29% ▼ -9.00%
- Reading proficiency
- 34% ▼ -7.00%
- Median HH income
- $39,817
- Composite
- 26.46/100
- National rank
- #7217
- State rank
- #235 of 301 in IN
Livability — Lafayette
- Score
- 74/100
- State rank
- #68
- US rank
- #4374
Category grades
Schools grade is shown separately in the Schools card above.
Census & demographics
- Census place
- Lafayette, IN
- County
- Tippecanoe County · 181,820 people
- City population
- 106,622
- Metro
- Lafayette-West Lafayette, IN
- Population (ZIP)
- 42,219
- Household income
- $65,861
- Rent vs Own
- Severe rent burden
- 1475.0
Population outlook (Tippecanoe County) Hauer SSP2
- Today (2025)
- 215,327 people
- By 2030
- 232,284 · +7.9%
- By 2040
- 266,517 · +23.8%
- By 2050
- 302,826 · +40.6%
- By 2075
- 394,445 · +83.2%
- By 2100
- 463,500 · +115.3%
Race, ethnicity, and origin ACS 2023
- Neighborhood character
- Predominantly White (74%)
- Race & ethnicity
- White 74% Hispanic / Latino 12% Two or more races 8% Black 7% Asian 4%
- Hispanic origin (detail)
- Mexican 10%
- Common ancestry
- Romanian 3% Italian 2% Slovak 2%
- Foreign-born
- 10% · Canada, China, Vietnam
- Languages at home
- 91% English-only · Spanish 6% Other Asian/Pacific 1% Vietnamese 1%
Political lean MEDSL · Tippecanoe
- 2024 margin
- Toss-up / Even · D 49.0% · R 49.1% · Other 1.9%
- 2008→2024 swing
- -11.8pp toward R · 2008: 11.6pp · 2024: -0.1pp
- All cycles
- 2024: R+0.1 2020: D+0.6 2016: R+5.7 2012: R+3.6 2008: D+11.6
Not yet ingested
- Civics
- —
Market trends
- HPI YoY
- ▼ -113.05%
- Current HPI
- 227.1583
- Rent YoY
- ▲ 5.12%
- Metro
- Lafayette-West Lafayette, IN
- State GDP YoY
- ▲ 2.90%
- F500 in state
- 18
Industry mix (Fortune 500 HQ in IN)
| Industry | F500 HQs | Revenue |
|---|---|---|
| Industrial Machinery | 2 | $37B |
|
||
| Healthcare | 1 | $177B |
|
||
| Pharmaceuticals | 1 | $45B |
|
||
| Metals / Steel | 1 | $18B |
|
||
| Agriculture | 1 | $17B |
|
||
| Packaging | 1 | $12B |
|
||
Price history
+138.5% since first listed12 events — show timeline
- 2026-04-16 Pending — MIBOR as Distributed by MLS Grid
- 2026-04-10 Price Changed $155,000 MIBOR as Distributed by MLS Grid
- 2026-03-27 Price Changed $169,000 MIBOR as Distributed by MLS Grid
- 2026-02-14 Price Changed $175,000 MIBOR as Distributed by MLS Grid
- 2026-01-22 Listed $185,000 MIBOR as Distributed by MLS Grid
- 2019-04-19 Sold (MLS) $84,000 IRMLS
- 2019-04-19 Sold (MLS) $84,000 MIBOR as Distributed by MLS Grid
- 2018-11-09 Listed $89,900 MIBOR as Distributed by MLS Grid
- 2018-11-09 Listed $89,900 IRMLS
- 2016-12-16 Sold (MLS) $62,500 IRMLS
- 2016-04-22 Listed $62,500 IRMLS
- 2015-07-10 Listed $65,000 IRMLS
Property tax history
+17.0%/yrLatest (2024): $2,154 · +16.8% YoY. Source: county tax records.
Cash-flow waterfall
monthlySold comps — $/sqft
last 12 mo · ≤1 miLoading sold comps…