 Multi-family
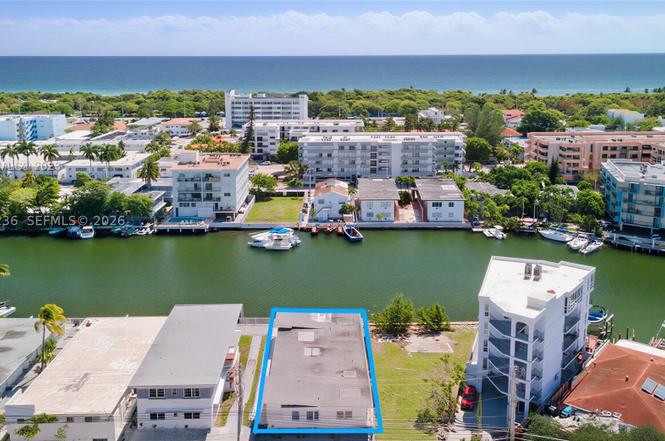
8135 Crespi Blvd · Miami Beach, FL
Flood risk 10/10 · Severe
- FEMA flood zone
- AE
- Chance of flooding over 30 yrs
- 0.99%
- Est. flood insurance / yr
- $1,737 – $8,500
Fire risk 1/10 · Minimal
- Est. fire insurance / yr
- $947 – $1,759
Heat risk 10/10 · Severe
- Hot days now (above 103°F)
- 7 days/yr
- Hot days in 30 yrs
- 28 days/yr
Wind risk 10/10 · Severe
- Chance of severe wind over 30 yrs
- 99.0%
Air-quality risk 2/10 · Minimal
- Unhealthy air days now
- 1 days/yr
- Unhealthy air days in 30 yrs
- 2 days/yr
Risk factors via First Street. Map © Google.
Why this score? — see what drove the B- grade
The composite is a weighted blend of 9 inputs, each scored 0–100. Each bar is that input's sub-score; the figure is the points it added to the 100-point composite (weight × sub-score).
- Cash flow +27.6/30.0
- DSCR +9.7/10.0
- ARV discount +7.5/15.0
- 1% rule +7.2/10.0
- Schools +4.2/10.0
- Livability +4.0/5.0
- Rent growth +2.6/5.0
- Condition / age +2.5/5.0
- Appreciation +0.0/10.0
$1,585,000
🖨 Deal sheet 📄 Offer letter ✓ Due diligence
Multi-family units
County records classify this as Multi-Family (5+ Unit). Listing-text estimate: 1 unit. estimate disagrees with records
5+ unit building — per-unit beds/baths from public records are typically unavailable; the breakdown below (if shown) is an estimate from the listing text.
Listing remarks
This exceptional waterfront multifamily property is ideally located in prime Miami Beach, offering residents highly desirable coastal living with direct proximity to the water. The building consists of five (5) 1-bedroom, 1-bathroom units, all of which are fully occupied, providing immediate and stable cash flow. The property is currently generating $8,300 in monthly rental income, presenting investors with strong in-place revenue and long-term investment stability. Its premier waterfront location offers tenants convenient access to Miami Beach’s renowned beaches, parks, dining, shopping, and entertainment, while still maintaining a quiet and desirable residential atmosphere. With its
Key facts
- Renowned beaches
- Convenient access
- Prime miami beach
Tags
Property features AI
Finance
- Other: Annual tax amount listed (2025)
- Financial info: Rent includes gas, gardener, hot water, and cable TV
Exterior
- Utilities: Public sewer; Cable available
- Home design: Single-story; Effective year built; Flat and tile roof
- Construction: Block construction
- Exterior features: Canal-front waterfront; Quarter to half acre lot; 60 ft frontage
Interior
- Flooring: Terrazzo; Tile
- Heating & cooling: Gas heating; Wall/Window cooling units
- Interior features: Terrazzo flooring; Tile flooring
Neighborhood map
What this means for you Summary
Snapshot
- This is a 5-bed/5.0-bath multifamily listed at $1.58M.
Deal economics
- At list price, monthly cash flow is $4k ($52k/yr) — positive.
- The deal already cash-flows at list — no discount required.
- Meets the 1% rule at list price ($19k rent vs $1.58M).
- Recommended offer: $1.39M (12.0% below list) — sets the bar for market timing.
- Cap rate 9.9% vs local median 1.5% in Miami Beach — top-decile yield for the area; either an underpriced asset or a hidden risk that comps aren't pricing in. Stress-test before assuming the spread holds.
Location & tenants
- Location reads 80/100 on livability (#108 in FL, #1,672 nationally) — a professional / high-income tenant draw. Strengths: crime A+, commute A+, health & safety A+; Watch: housing C-, amenities D-, cost of living F.
- Miami-Dade (suburban): math 45% / reading 54% proficiency, ranked #40 of 73 in FL (top 55%) — families likely to look elsewhere, expect single-tenant / working-renter base with shorter leases; 64% free/reduced lunch — lower-income household profile, screen leases tightly.
- Market conditions: Rents flat; 644 active listings in the ZIP; 18 comparable units currently listed for rent nearby; rentals at typical pace (median 25d on market — plan ~3-4 weeks tenant-placement turnaround); 10,051 units permitted in Miami-Dade County in 2024 (7,758 in 5+ unit buildings).
- At $19,375/mo this rent would consume 338% of the median local household income ($69k/yr) (locally 3521% of renters already pay >50% of income on rent) — very limited rent-growth headroom before tenants either downsize or default.
Forward outlook
- Local home prices are declining (-3.0%/yr); year-one equity from $11k of loan paydown is wiped out by about $48k of value loss. Plan a longer hold.
- Miami-Dade County population projected at +28% by 2050 — long-run rental-demand tailwind backs the buy-and-hold thesis.
Negotiation context
- It's been on market 135 days — a 12% lower offer ($1.39M) is reasonable based on typical stale-listing flexibility.
- 4 sale attempts since 14y ago with the ask held roughly flat each time — persistent listings suggest the price (not the market) is what's stuck; bring a comps-based counter.
- Current owner paid $849k; list at $1.58M implies a 87% gain — meaningful room to come down on a strong offer.
Risks & watch-outs
- Watch-outs: flood insurance adds $427/mo; built in 1950 — expect roof / HVAC / electrical / plumbing capex.
- Climate carrying-cost: in FEMA flood zone AE (mandatory federal flood insurance); severe wind risk, 99% chance of damaging wind over 30y; extreme-heat days projected 7→28/yr by 2055 (HVAC capex compounding) — expect insurance premiums to compound above CPI over the hold.
Questions for the listing agent
- It's been on market 135 days. Have you received any prior offers? Is the seller open to a 12% concession, seller financing, or rate buy-down credit?
- Built in 1950 — when were the roof, HVAC, electrical panel, plumbing, and water heater last replaced?
- What's the actual annual flood-insurance premium (NFIP or private), and is the property in a SFHA with mandatory coverage?
- Why hasn't it sold? Are there any deal-killer items the seller is aware of (foundation, flood, title, zoning, code violations)?
- Is there a deadline driving the sale (1031 exchange, divorce, estate, relocation)? That informs how much negotiation room exists.
- Schools are A-rated — typically a magnet for longer-tenancy family renters. What's the average tenant stay here, and is there a school-zone premium baked into asking?
- What's the average days-on-market for RENTAL listings here right now (not sales)? A rising rental-DOM trend means longer vacancies and softer asking-rent achievability than the comps imply.
- What's the recent tenant-quality profile in this submarket — average credit score on applications, eviction rate, late-payment / NSF rate, and stable-employment percentage? A property-management company in the area should have these aggregated.
- How much new apartment / multifamily construction is in the pipeline within 1–3 miles? Heavy new supply (>2% of stock underway) typically softens rents 12–24 months out; light construction supports rent growth.
Investment metrics
- 1% rule
- 1.22% ✓
- Cap rate
- 9.88%
- Cash-on-cash
- 12.80%
- DSCR
- 1.57
- GRM
- 6.8
CMA / ARV
No comps found within radius.
Projected returns pro-forma
-3.0% appreciation · 0.44% rent growth · sell at horizon
- IRR
- -1.9%
- Equity multiple
- 0.93×
- Total profit
- $-30,856
- Equity at exit
- $236,329
- IRR
- 4.8%
- Equity multiple
- 1.31×
- Total profit
- $137,965
- Equity at exit
- $137,042
Cash invested: $443,800 (down + closing). Projections, not guarantees.
Landlord ↔ Tenant lean methodology
- Overall (STATE)
- 87 Strongly Landlord-Friendly
- State Florida
- 87 Strongly Landlord-Friendly · R+3
- County
- — inherits STATE
- City
- — inherits STATE
ZIP-level market 33141
- Rents YoY
- 0.4%
- Active inventory
- 644
- Price-to-rent
- 34.1×
Monthly cashflow live
- Estimated rent
- $19,375 medium interval (Pro) →
- Mortgage (P&I)
- −$8,312
- Tax from tax record
- −$1,600 /mo · $19,203/yr
- Insurance
- −$660
- Flood insurance flood zone
- −$427 /mo · $5,118/yr
- HOA
- −$0
- Vacancy / Maint / Mgmt
- −$4,069
- Net cashflow
- $4,307
Break-even live
5-unit breakdown (identical units grouped — click to expand)
| Units | Beds | Baths | Est. rent |
|---|---|---|---|
| 5× units | 1 | 1 | $19,375 |
| #1 | 1 | 1 | $3,875 |
| #2 | 1 | 1 | $3,875 |
| #3 | 1 | 1 | $3,875 |
| #4 | 1 | 1 | $3,875 |
| #5 | 1 | 1 | $3,875 |
| Total (5 units) | $19,375 | ||
UW: 25.0% down · 7.5% · 30yr · 1.5% tax · 5.0% vac · 8.0% maint · 8.0% mgmt
Financing live
Cash to close
- Down payment
- $396,250
- Closing costs
- $47,550
- Reserves months
- —
- Total cash needed
- —
Loan-product check · same deal, 3 products live
Conventional
25% down · 7.5% · 30yr
- Down + closing
- —
- Monthly P&I
- —
- Monthly cashflow
- —
- DSCR
- —
- Eligible?
- —
Personal DTI + credit; lowest rate.
DSCR
20% down · 8.5% · 30yr
- Down + closing
- —
- Monthly P&I
- —
- Monthly cashflow
- —
- DSCR
- —
- Eligible?
- —
No personal income docs; deal must DSCR.
Hard money
10% down · 12.0% · 12mo
- Down + closing
- —
- Monthly P&I
- —
- Monthly cashflow
- —
- DSCR
- —
- Eligible?
- —
Short-term bridge; refi at stabilization.
Rent comps 18 comps
| Address | Beds | Baths | Sqft | Rent | $/sqft | DOM | Units | Dist |
|---|---|---|---|---|---|---|---|---|
| 7811 Carlyle Ave Miami Beach, FL | 6.0 | 5.5 | 3405 | $50,000 | $14.68 | 24d | 1 | 0.25mi |
| 1135 N Biscayne Point Rd Miami Beach, FL | 4.0 | 5.0 | 5077 | $30,000 | $5.91 | 24d | 1 | 0.28mi |
| 1055 Stillwater Dr Miami Beach, FL | 6.0 | 5.5 | 4787 | $29,000 | $6.06 | 21d | 1 | 0.41mi |
| 1131 Stillwater Dr Unit SFH Miami Beach, FL | 5.0 | 3.5 | 3980 | $19,000 | $4.77 | 24d | 1 | 0.46mi |
| 1170 S Biscayne Point Rd Unit N/A Miami Beach, FL | 4.0 | 3.5 | 2900 | $36,000 | $12.41 | 24d | 1 | 0.47mi |
| 1151 Stillwater Dr Miami Beach, FL | 5.0 | 3.0 | 3237 | $18,000 | $5.56 | 17d | 1 | 0.47mi |
| 1231 Stillwater Dr Miami Beach, FL | 4.0 | 4.0 | 2664 | $22,000 | $8.26 | 22d | 1 | 0.53mi |
| 1231 Stillwater Dr Unit SFH Miami Beach, FL | 4.0 | 4.0 | 2664 | $22,000 | $8.26 | 18d | 1 | 0.53mi |
| 1249 Biscaya Dr Surfside, FL | 5.0 | 4.5 | 4486 | $26,900 | $6.00 | 24d | 1 | 0.54mi |
| 265 N Shore Dr Miami Beach, FL | 4.0 | 4.0 | 2786 | $30,000 | $10.77 | 22d | 1 | 0.59mi |
| 265 N Shore Dr Miami Beach, FL | 4.0 | 4.0 | 2786 | $27,500 | $9.87 | 3d | 1 | 0.59mi |
| 365 N Shore Dr Miami Beach, FL | 4.0 | 4.0 | 2672 | $25,000 | $9.36 | 24d | 1 | 0.69mi |
| 365 N Shore Dr Miami Beach, FL | 4.0 | 4.0 | 2672 | $25,000 | $9.36 | 3d | 1 | 0.69mi |
| 1625 Daytonia Rd Miami Beach, FL | 5.0 | 3.0 | 2690 | $18,000 | $6.69 | 24d | 1 | 0.77mi |
| 1575 Stillwater Dr Miami Beach, FL | 4.0 | 3.5 | 4645 | $43,000 | $9.26 | 22d | 1 | 0.82mi |
| 7972 Biscayne Point Cir Miami Beach, FL | 5.0 | 5.0 | 3989 | $60,000 | $15.04 | 24d | 1 | 1.11mi |
| 9380 Bay Dr Surfside, FL | 5.0 | 5.0 | 4737 | $35,000 | $7.39 | 24d | 1 | 1.11mi |
| 9501 Collins Ave #1 Surfside, FL | 4.0 | 5.5 | 3606 | $19,770 | $5.48 | 24d | 1 | 1.28mi |
Listing history 26 events
-
2026-06-18days on market $1,585,000 Active 135 DOM
-
2026-06-17days on market $1,585,000 Active 134 DOM
-
2026-06-16days on market $1,585,000 Active 133 DOM
-
2026-06-15days on market $1,585,000 Active 132 DOM
-
2026-06-13days on market $1,585,000 Active 130 DOM
-
2026-06-09days on market $1,585,000 Active 126 DOM
-
2026-06-08days on market $1,585,000 Active 125 DOM
-
2026-06-07days on market $1,585,000 Active 124 DOM
-
2026-06-04days on market $1,585,000 Active 121 DOM
-
2026-06-03days on market $1,585,000 Active 120 DOM
-
2026-06-02days on market $1,585,000 Active 119 DOM
-
2026-06-01days on market $1,585,000 Active 118 DOM
-
2026-05-31days on market $1,585,000 Active 117 DOM
-
2026-03-26price $1,585,000
-
2026-02-03$1,600,000 Active
-
2025-08-07historical $1,500
-
2025-07-26$1,500
-
2022-02-20price $2,359
-
2021-04-01soldstatus $848,800
-
2019-08-13historical
-
2019-06-28price $1,100,000
-
2019-02-13$1,200,000 Active
-
2017-02-10soldstatus $810,000
-
2016-06-30soldstatus $500,000
-
2012-09-02historical
-
2012-04-04$749,000
ⓘ Source: listings_history table (triggers on properties + properties_extension) + one-shot
backfill from property_details.listing_events for pre-trigger history.
Tax reassessment forecast FL · Resets to sale price
- Current annual tax
- $19,203 · $1,600/mo
- Projected year-2 tax
- $19,203 · $1,600/mo
- Expected delta
- $0/yr ($0/mo · 0.0%)
ⓘ Screening estimate from a state-policy table — verify with the county assessor before closing.
Climate risk First Street
- Flood 10/10 Extreme FEMA zone AE · 99% chance over 30 yrs
- Wildfire 1/10 Low
- Heat 10/10 Extreme 7 d/yr ≥103°F today · 28 d/yr by 30 yrs out
- Wind 10/10 Extreme 99% chance of damaging wind over 30 yrs
- Air quality 2/10 Low 1 unhealthy d/yr today · 2 by 30 yrs out
Nearby sold comps map
Loading sold comps map…
Walkable amenities ~0.75 mi
Loading nearby amenities…
Taxation est. · year 1
- Rental income
- $232,500
- − Mortgage interest
- −$88,785
- − Property taxes
- −$19,203
- − Insurance
- −$13,044
- − Repairs & maintenance
- −$18,600
- − Management
- −$18,600
- − Depreciation
- −$46,109
- Taxable income
- $28,160
- Est. tax owed @ 24.0%
- −$6,758
- After-tax cash flow
- $44,927/yr
For passive investors: Depreciation is non-cash, so a rental often shows a tax loss while cash-flowing — sheltering income. Rental losses are passive: they offset passive income freely, and up to $25,000/yr can offset ordinary (W-2) income if you actively participate and your MAGI is under $100k (phasing out to $0 by $150k); unused losses carry forward. On sale, claimed depreciation is recaptured at up to 25%, and gains may owe capital-gains tax (a 1031 exchange can defer both). Figures are a year-1 estimate at your 24.0% rate — not tax advice; consult a CPA.
Schools (NCES district)
- District
- Miami-Dade
- NCES district ID
- 1200390
- Math proficiency
- 45% ▼ -16.00%
- Reading proficiency
- 54% ▼ -5.00%
- Median HH income
- $43,928
- Composite
- 41.76/100
- National rank
- #3397
- State rank
- #40 of 73 in FL
Livability — Miami Beach
- Score
- 80/100
- State rank
- #108
- US rank
- #1672
Category grades
Schools grade is shown separately in the Schools card above.
Census & demographics
- Census place
- Miami Beach, FL
- County
- Miami-Dade County · 2,697,751 people
- City population
- 90,533
- Metro
- Miami-Fort Lauderdale-Pompano Beach, FL
- Population (ZIP)
- 36,438
- Household income
- $68,738
- Rent vs Own
- Severe rent burden
- 3521.0
Population outlook (Miami-Dade County) Hauer SSP2
- Today (2025)
- 3,126,439 people
- By 2030
- 3,325,765 · +6.4%
- By 2040
- 3,697,561 · +18.3%
- By 2050
- 4,012,134 · +28.3%
- By 2075
- 4,605,612 · +47.3%
- By 2100
- 4,866,598 · +55.7%
Race, ethnicity, and origin ACS 2023
- Neighborhood character
- Predominantly Hispanic (67%)
- Race & ethnicity
- Hispanic / Latino 67% Two or more races 36% White 20% Black 4% Asian 3%
- Hispanic origin (detail)
- Mexican 1% Puerto Rican 3% Cuban 27% Salvadoran 6%
- Common ancestry
- Scotch-Irish 2% Romanian 2% Armenian 1%
- Foreign-born
- 62% · Canada, Jamaica, Dominican Republic
- Languages at home
- 18% English-only · Spanish 69% Other Indo-European 4% French/Haitian/Cajun 3%
Political lean MEDSL · Miami-Dade
- 2024 margin
- R (+11.4) · D 43.9% · R 55.4%
- 2008→2024 swing
- -27.6pp toward R · 2008: 16.1pp · 2024: -11.4pp
- All cycles
- 2024: R+11.4 2020: D+7.3 2016: D+29.6 2012: D+23.7 2008: D+16.1
Not yet ingested
- Civics
- —
Market trends
- HPI YoY
- ▼ -472.71%
- Current HPI
- 336.7298
- Rent YoY
- ▲ 0.44%
- Metro
- Miami-Fort Lauderdale-Pompano Beach, FL
- State GDP YoY
- ▲ 3.28%
- F500 in state
- 36
Industry mix (Fortune 500 HQ in FL)
| Industry | F500 HQs | Revenue |
|---|---|---|
| Industrial Technology | 2 | $29B |
|
||
| Insurance | 2 | $17B |
|
||
| Retail | 1 | $60B |
|
||
| Technology Distribution | 1 | $58B |
|
||
| Homebuilding | 1 | $35B |
|
||
| Technology Manufacturing | 1 | $35B |
|
||
Price history
+111.6% since first listed13 events — show timeline
- 2026-03-26 Price Changed $1,585,000 MARMLS
- 2026-02-03 Listed $1,600,000 MARMLS
- 2025-08-07 Rental Removed $1,500 SHOWMOJO
- 2025-07-26 Listed for Rent $1,500 SHOWMOJO
- 2022-02-20 Price Changed $2,359 RENT.
- 2021-04-01 Sold (Public Records) $848,800 Public Records
- 2019-08-13 Listing Removed — MARMLS
- 2019-06-28 Price Changed $1,100,000 MARMLS
- 2019-02-13 Listed $1,200,000 MARMLS
- 2017-02-10 Sold (Public Records) $810,000 Public Records
- 2016-06-30 Sold (Public Records) $500,000 Public Records
- 2012-09-02 Listing Removed — MARMLS
- 2012-04-04 Listed $749,000 MARMLS
Property tax history
+7.7%/yrLatest (2025): $19,203 · +6.1% YoY. Source: county tax records.
Cash-flow waterfall
monthlySold comps — $/sqft
last 12 mo · ≤1 miLoading sold comps…