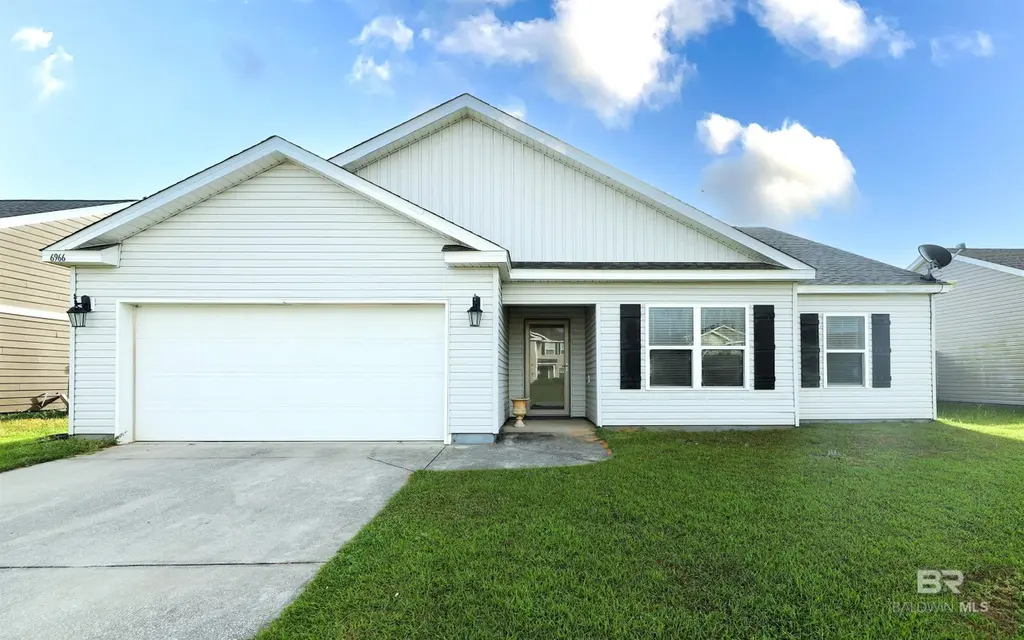
6966 Crimson Ridge St · Gulf Shores, AL
Flood risk 1/10 · Minimal
- FEMA flood zone
- X (unshaded)
- Chance of flooding over 30 yrs
- 0.0%
- Est. flood insurance / yr
- $507 – $1,088
Fire risk 3/10 · Minor
- Est. fire insurance / yr
- $916 – $1,700
Heat risk 10/10 · Severe
- Hot days now (above 105°F)
- 7 days/yr
- Hot days in 30 yrs
- 25 days/yr
Wind risk 10/10 · Severe
- Chance of severe wind over 30 yrs
- 99.0%
Air-quality risk 2/10 · Minimal
- Unhealthy air days now
- 1 days/yr
- Unhealthy air days in 30 yrs
- 1 days/yr
Risk factors via First Street. Map © Google.
Why this score? — see what drove the D+ grade
The composite is a weighted blend of 9 inputs, each scored 0–100. Each bar is that input's sub-score; the figure is the points it added to the 100-point composite (weight × sub-score).
- ARV discount +15.0/15.0
- Cash flow +11.1/30.0
- Schools +5.0/10.0
- Livability +3.5/5.0
- Rent growth +3.4/5.0
- DSCR +3.2/10.0
- Condition / age +2.5/5.0
- 1% rule +2.1/10.0
- Appreciation +0.0/10.0
$329,000
🖨 Deal sheet 📄 Offer letter ✓ Due diligence
Listing remarks MLS
The BOOTH is an OPEN FLOOR PLAN with a LARGE ISLAND in the kitchen facing the family room and LOTS OF STORAGE space. Home has SS App. upgrade. Located in the Gulf Shores School District! A QUALITY GOLD FORTIFIED HOME at an AFFORDABLE PRICE. This community is located between the Foley Beach Express and Highway 59 off of County Road 8 for convenient access to beaches, shopping, entertainment and everything else this coastal community has to offer. Just reduced!!!!
Key facts
- Spacious island
- Private wing
- Backyard
Tags
Property features AI
Finance
- HOA & community: Annual association fee of $225; Community landscaping maintained; No transfer fee
Exterior
- Parking: Attached double garage with automatic garage door (2 covered spaces)
- Utilities: Sewer served by grinder pump; Electric service: Baldwin EMC
- Home design: Single-story home; One level; Resale property
- Construction: Vinyl siding and wood siding; Slab foundation; Composition roof with ridge vent; Built area reported as 1,983 square feet (assessor source)
- Exterior features: Covered patio/porch; Subdivision setting; No waterfront
Interior
- Kitchen: Electric range; Cooktop; Microwave; Dishwasher; Disposal; Refrigerator
- Bedrooms: Primary bedroom on the main level (approx. 16 x 13); Second bedroom (approx. 12 x 11); Third bedroom (approx. 11 x 11); Fourth bedroom (approx. 12 x 10)
- Flooring: Carpet; Vinyl
- Bathrooms: Two full bathrooms; Primary bathroom with double vanity and private water closet
- Heating & cooling: Electric heating; Ceiling fans for cooling
- Interior features: Ceiling fans; En-suite (primary bedroom with attached bath)
- Laundry & utility: Unfurnished (no washer/dryer listed)
Neighborhood map
What this means for you Summary
Snapshot
- This is a 4-bed/2.0-bath single-family listed at $329k.
Deal economics
- At list price, monthly cash flow is $-133 ($-2k/yr) — negative.
- To cash-flow at today's rent, offer at most $306k (7.1% below list).
- To meet the 1% rule (rent ≥ 1% of price), the offer needs to be $232k (29.5% below list).
- Recommended offer: $232k (29.5% below list) — sets the bar for 1% rule.
- Cap rate 5.8% vs local median 0.2% in Gulf Shores — top-decile yield for the area; either an underpriced asset or a hidden risk that comps aren't pricing in. Stress-test before assuming the spread holds.
Location & tenants
- Location reads 69/100 on livability (#61 in AL) — a middle-class / working-renter tenant base. Strengths: health & safety A+, housing B+; Watch: amenities F, commute F.
- Zoned schools: Gulf Shores Elementary School (math 47% / reading 72%, grade B-, #63 of 627 statewide, top 10%, 1,062 students, 44% FRL); Gulf Shores Middle School (math 34% / reading 62%, grade C-, #29 of 257 statewide, top 12%, 589 students, 48% FRL); Gulf Shores High School (math 42% / reading 47%, grade F, #22 of 305 statewide, top 8%, 799 students, 37% FRL).
- Market conditions: Rents rising (+3.7%/yr); 1191 active listings in the ZIP; 13 comparable units currently listed for rent nearby; rentals leasing fast (median 14d on market — plan ~1-2 weeks tenant-placement turnaround); solid renter incomes; 3,883 units permitted in Baldwin County in 2024 (481 in 5+ unit buildings).
- This rent runs 35% of the median local income ($80k/yr) — at the standard rent-burdened threshold; future hikes will face affordability resistance.
Forward outlook
- Local home prices are declining (-3.0%/yr); year-one equity from $2k of loan paydown is wiped out by about $10k of value loss. Plan a longer hold.
- Baldwin County population projected at +42% by 2050 — long-run rental-demand tailwind backs the buy-and-hold thesis.
Negotiation context
- It's been on market 79 days — a 6% lower offer ($309k) is reasonable based on typical stale-listing flexibility.
- 2 sale attempts since 11y ago with the ask held roughly flat each time — persistent listings suggest the price (not the market) is what's stuck; bring a comps-based counter.
- Current owner paid $170k; list at $329k implies a 94% gain — meaningful room to come down on a strong offer.
Risks & watch-outs
- Climate carrying-cost: severe wind risk, 99% chance of damaging wind over 30y; extreme-heat days projected 7→25/yr by 2055 (HVAC capex compounding) — expect insurance premiums to compound above CPI over the hold.
Questions for the listing agent
- What do current leases actually rent for vs. the listed asking? Can we see a recent rent roll and the last 12 months of T-12 income?
- It's been on market 79 days. Have you received any prior offers? Is the seller open to a 29% concession, seller financing, or rate buy-down credit?
- What does the HOA fee cover, when was the last increase, and are there any pending special assessments or reserve-fund shortfalls?
- Why hasn't it sold? Are there any deal-killer items the seller is aware of (foundation, flood, title, zoning, code violations)?
- Is there a deadline driving the sale (1031 exchange, divorce, estate, relocation)? That informs how much negotiation room exists.
- Schools are B-rated — typically a magnet for longer-tenancy family renters. What's the average tenant stay here, and is there a school-zone premium baked into asking?
- The area grade is low — what's the realistic commute time and amenity access for the typical tenant pool here? Any planned neighborhood developments (good or bad) we should know about?
- What's the average days-on-market for RENTAL listings here right now (not sales)? A rising rental-DOM trend means longer vacancies and softer asking-rent achievability than the comps imply.
- What's the recent tenant-quality profile in this submarket — average credit score on applications, eviction rate, late-payment / NSF rate, and stable-employment percentage? A property-management company in the area should have these aggregated.
- How much new for-sale + rental construction is in the pipeline within 1–3 miles? Heavy new supply typically softens prices + rents 12–24 months out; constrained supply supports both.
Investment metrics
- 1% rule
- 0.71% ✗
- Cap rate
- 5.81%
- Cash-on-cash
- -1.73%
- DSCR
- 0.92
- GRM
- 11.8
CMA / ARV
- ARV (on-the-fly)
- $422,379
- Comps found
- 12
Show comp detail 12 sales within ~0.75 mi
| Address | Dist | Beds/Ba | Sqft | Sold | Price | $/sf | Match |
|---|---|---|---|---|---|---|---|
| 165 Preston Way | 0.32mi | 4/2.0 | 2,091 (+5%) | 1mo | $475,000 | $227 | 75 |
| 437 Parkerman Ave | 0.26mi | 4/2.0 | 1,835 (-8%) | 1mo | $393,854 | $215 | 75 |
| 449 Parkerman Ave | 0.26mi | 4/2.0 | 1,835 (-8%) | 1mo | $370,000 | $202 | 74 |
| 436 Parkerman Ave | 0.26mi | 4/2.0 | 1,835 (-8%) | 2mo | $394,854 | $215 | 74 |
| 445 Parkerman Ave | 0.26mi | 4/2.0 | 1,835 (-8%) | 2mo | $390,829 | $213 | 74 |
| 420 Winters Ave | 0.24mi | 4/2.0 | 1,806 (-9%) | 0mo | $380,000 | $210 | 74 |
| 429 Winters Ave | 0.24mi | 4/2.0 | 1,791 (-10%) | 1mo | $360,000 | $201 | 72 |
| 325 Dawson Dr | 0.42mi | 3/2.0 (-1) | 1,797 (-9%) | 0mo | $360,000 | $200 | 59 |
| 107 Preston Way | 0.38mi | 4/2.5 | 2,250 (+14%) | 1mo | $487,900 | $217 | 57 |
| 7332 Raintree Ln | 0.45mi | 3/2.0 (-1) | 1,777 (-10%) | 1mo | $310,000 | $174 | 56 |
| 4241 Grove St | 0.66mi | 3/2.0 (-1) | 1,866 (-6%) | 1mo | $428,000 | $229 | 53 |
| 7037 Rocky Road Loop | 0.47mi | 3/2.0 (-1) | 2,267 (+14%) | 0mo | $475,000 | $210 | 49 |
Match score weights: distance 35% · size 25% · config 20% · recency 20%. Top-matched comps best support the ARV.
Projected returns pro-forma
-3.0% appreciation · 3.71% rent growth · sell at horizon
- IRR
- -18.5%
- Equity multiple
- 0.35×
- Total profit
- $-60,262
- Equity at exit
- $49,055
- IRR
- -9.9%
- Equity multiple
- 0.38×
- Total profit
- $-57,053
- Equity at exit
- $28,446
Cash invested: $92,120 (down + closing). Projections, not guarantees.
Landlord ↔ Tenant lean methodology
- Overall (STATE)
- 90 Strongly Landlord-Friendly
- State Alabama
- 90 Strongly Landlord-Friendly · R+15
- County
- — inherits STATE
- City
- — inherits STATE
ZIP-level market 36542
- Rents YoY
- 3.7%
- Active inventory
- 1191
- Price-to-rent
- 11.8×
Monthly cashflow live
- Estimated rent
- $2,320 high interval (Pro) →
- Mortgage (P&I)
- −$1,725
- Tax from tax record
- −$84 /mo · $1,013/yr
- Insurance
- −$137
- HOA
- −$19
- Vacancy / Maint / Mgmt
- −$487
- Net cashflow
- $-133
Break-even live
UW: 25.0% down · 7.5% · 30yr · 1.5% tax · 5.0% vac · 8.0% maint · 8.0% mgmt
Financing live
Cash to close
- Down payment
- $82,250
- Closing costs
- $9,870
- Reserves months
- —
- Total cash needed
- —
Loan-product check · same deal, 3 products live
Conventional
25% down · 7.5% · 30yr
- Down + closing
- —
- Monthly P&I
- —
- Monthly cashflow
- —
- DSCR
- —
- Eligible?
- —
Personal DTI + credit; lowest rate.
DSCR
20% down · 8.5% · 30yr
- Down + closing
- —
- Monthly P&I
- —
- Monthly cashflow
- —
- DSCR
- —
- Eligible?
- —
No personal income docs; deal must DSCR.
Hard money
10% down · 12.0% · 12mo
- Down + closing
- —
- Monthly P&I
- —
- Monthly cashflow
- —
- DSCR
- —
- Eligible?
- —
Short-term bridge; refi at stabilization.
Rent comps 13 comps
| Address | Beds | Baths | Sqft | Rent | $/sqft | DOM | Units | Dist |
|---|---|---|---|---|---|---|---|---|
| 452 Parkerman Ave Gulf Shores, AL | 4.0 | 2.0 | 1835 | $2,600 | $1.42 | 21d | 1 | 0.27mi |
| 392 Parkerman Ave Gulf Shores, AL | 4.0 | 2.0 | 1835 | $2,600 | $1.42 | 21d | 1 | 0.27mi |
| 417 Parkerman Ave Gulf Shores, AL | 4.0 | 2.0 | 1835 | $2,500 | $1.36 | 13d | 1 | 0.27mi |
| 263 Preston Way Gulf Shores, AL | 4.0 | 2.0 | 1787 | $2,400 | $1.34 | 13d | 1 | 0.37mi |
| 21150 Coastal Gateway Blvd Gulf Shores, AL | 3.0 | 2.5 | 1516 | $1,699 | $1.12 | 21d | 1 | 0.40mi |
| 425 Raley Farms Dr Gulf Shores, AL | 4.0 | 2.5 | 2250 | $2,600 | $1.16 | 21d | 1 | 0.41mi |
| 20215 Edison Ave Foley, AL | 1.0–3.0 | 1.0–2.0 | 1008 | $1,950 | $1.93 | 13d | 53 | 0.85mi |
| 8088 Carmel Cir Foley, AL | 3.0 | 2.0 | 1693 | $2,300 | $1.36 | 13d | 1 | 1.02mi |
| 6870 Foley Bch EXPY Orange Beach, AL | 1.0–3.0 | 1.0–2.0 | 1150 | $1,753 | $1.52 | 21d | 15 | 1.20mi |
| 6870 Foley Bch EXPY Orange Beach, AL | 1.0–3.0 | 1.0–2.0 | 1150 | $1,625 | $1.41 | 13d | 11 | 1.20mi |
| 224 Fulham Ln Foley, AL | 4.0 | 2.0 | 1787 | $2,100 | $1.18 | 13d | 1 | 1.20mi |
| 212 Burnston Way Foley, AL | 4.0 | 2.0 | 1768 | $2,175 | $1.23 | 43d | 1 | 1.20mi |
| 4500 Gulf Shores Pkwy Gulf Shores, AL | 1.0–3.0 | 1.0–3.0 | 1032 | $1,983 | $1.92 | 13d | 10 | 1.29mi |
HOA detail
- Monthly dues
- $19 · $228/yr
Listing history 18 events
-
2026-06-19days on market $329,000 Active 79 DOM
-
2026-06-18days on market $329,000 Active 78 DOM
-
2026-06-17days on market $329,000 Active 77 DOM
-
2026-06-16days on market $329,000 Active 76 DOM
-
2026-06-15days on market $329,000 Active 75 DOM
-
2026-06-14days on market $329,000 Active 73 DOM
-
2026-06-13days on market $329,000 Active 72 DOM
-
2026-06-10days on market $329,000 Active 70 DOM
-
2026-06-09days on market $329,000 Active 69 DOM
-
2026-06-08days on market $329,000 Active 68 DOM
-
2026-06-07days on market $329,000 Active 67 DOM
-
2026-06-02days on market $329,000 Active 62 DOM
-
2026-06-01days on market $329,000 Active 61 DOM
-
2026-05-31days on market $329,000 Active 60 DOM
-
2026-05-30days on market $329,000 Active 59 DOM
-
2026-04-01$329,000 Active
-
2016-02-05soldstatus $169,900 466-char remark
Show marketing remark (466 chars)
The BOOTH is an OPEN FLOOR PLAN with a LARGE ISLAND in the kitchen facing the family room and LOTS OF STORAGE space. Home has SS App. upgrade. Located in the Gulf Shores School District! A QUALITY GOLD FORTIFIED HOME at an AFFORDABLE PRICE. This community is located between the Foley Beach Express and Highway 59 off of County Road 8 for convenient access to beaches, shopping, entertainment and everything else this coastal community has to offer. Just reduced!!!!
-
2015-04-01$169,900 466-char remark
Show marketing remark (466 chars)
The BOOTH is an OPEN FLOOR PLAN with a LARGE ISLAND in the kitchen facing the family room and LOTS OF STORAGE space. Home has SS App. upgrade. Located in the Gulf Shores School District! A QUALITY GOLD FORTIFIED HOME at an AFFORDABLE PRICE. This community is located between the Foley Beach Express and Highway 59 off of County Road 8 for convenient access to beaches, shopping, entertainment and everything else this coastal community has to offer. Just reduced!!!!
ⓘ Source: listings_history table (triggers on properties + properties_extension) + one-shot
backfill from property_details.listing_events for pre-trigger history.
Tax reassessment forecast AL · Resets to sale price
- Current annual tax
- $1,013 · $84/mo
- Projected year-2 tax
- $1,349 · $112/mo
- Expected delta
- +$336/yr (+$28/mo · 33.2%)
ⓘ Screening estimate from a state-policy table — verify with the county assessor before closing.
Climate risk First Street
- Flood 1/10 Low FEMA zone X (unshaded) · 0% chance over 30 yrs
- Wildfire 3/10 Moderate
- Heat 10/10 Extreme 7 d/yr ≥105°F today · 25 d/yr by 30 yrs out
- Wind 10/10 Extreme 99% chance of damaging wind over 30 yrs
- Air quality 2/10 Low 1 unhealthy d/yr today · 1 by 30 yrs out
Nearby sold comps map
Loading sold comps map…
Walkable amenities ~0.75 mi
Loading nearby amenities…
Taxation est. · year 1
- Rental income
- $27,842
- − Mortgage interest
- −$18,429
- − Property taxes
- −$1,013
- − Insurance
- −$1,645
- − Repairs & maintenance
- −$2,227
- − Management
- −$2,227
- − HOA
- −$228
- − Depreciation
- −$9,571
- Taxable loss
- −$7,499
- Est. tax savings @ 24.0%
- +$1,800
- After-tax cash flow
- $205/yr
For passive investors: Depreciation is non-cash, so a rental often shows a tax loss while cash-flowing — sheltering income. Rental losses are passive: they offset passive income freely, and up to $25,000/yr can offset ordinary (W-2) income if you actively participate and your MAGI is under $100k (phasing out to $0 by $150k); unused losses carry forward. On sale, claimed depreciation is recaptured at up to 25%, and gains may owe capital-gains tax (a 1031 exchange can defer both). Figures are a year-1 estimate at your 24.0% rate — not tax advice; consult a CPA.
Schools (NCES district)
No district data.
Livability — Gulf Shores
- Score
- 69/100
- State rank
- #61
- US rank
- #8945
Category grades
Schools grade is shown separately in the Schools card above.
Census & demographics
- Census place
- Gulf Shores, AL
- County
- Baldwin County · 181,514 people
- City population
- 18,906
- Metro
- Daphne-Fairhope-Foley, AL
- Population (ZIP)
- 18,906
- Household income
- $79,639
- Rent vs Own
- Severe rent burden
- 522.0
Population outlook (Baldwin County) Hauer SSP2
- Today (2025)
- 248,264 people
- By 2030
- 270,315 · +8.9%
- By 2040
- 312,967 · +26.1%
- By 2050
- 352,262 · +41.9%
- By 2075
- 438,841 · +76.8%
- By 2100
- 487,736 · +96.5%
Race, ethnicity, and origin ACS 2023
- Neighborhood character
- Predominantly White (87%)
- Race & ethnicity
- White 87% Hispanic / Latino 5% Two or more races 3% Black 2% Asian 1%
- Hispanic origin (detail)
- Mexican 2%
- Common ancestry
- Slovak 3% Lithuanian 3% Italian 1%
- Foreign-born
- 8% · Canada, Jamaica
- Languages at home
- 91% English-only · Spanish 5% Other Indo-European 1% Other Asian/Pacific 1%
Political lean MEDSL · Baldwin
- 2024 margin
- Solid R (+58.2) · D 20.5% · R 78.7%
- 2008→2024 swing
- -6.7pp toward R · 2008: -51.5pp · 2024: -58.2pp
- All cycles
- 2024: R+58.2 2020: R+53.8 2016: R+57.8 2012: R+55.8 2008: R+51.5
Not yet ingested
- Civics
- —
Market trends
- HPI YoY
- ▼ -153.95%
- Current HPI
- 257.6494
- Rent YoY
- ▲ 3.71%
- Metro
- Daphne-Fairhope-Foley, AL
- State GDP YoY
- ▲ 2.94%
- F500 in state
- 4
Industry mix (Fortune 500 HQ in AL)
| Industry | F500 HQs | Revenue |
|---|---|---|
| Financial Services | 1 | $8B |
|
||
| Healthcare | 1 | $5B |
|
||
Price history
+93.6% since first listed3 events — show timeline
- 2026-04-01 Listed $329,000 BCAR
- 2016-02-05 Sold (MLS) $169,900 BCAR
- 2015-04-01 Listed $169,900 BCAR
Property tax history
+23.0%/yrLatest (2025): $1,013 · +23.4% YoY. Source: county tax records.
Cash-flow waterfall
monthlySold comps — $/sqft
last 12 mo · ≤1 miLoading sold comps…