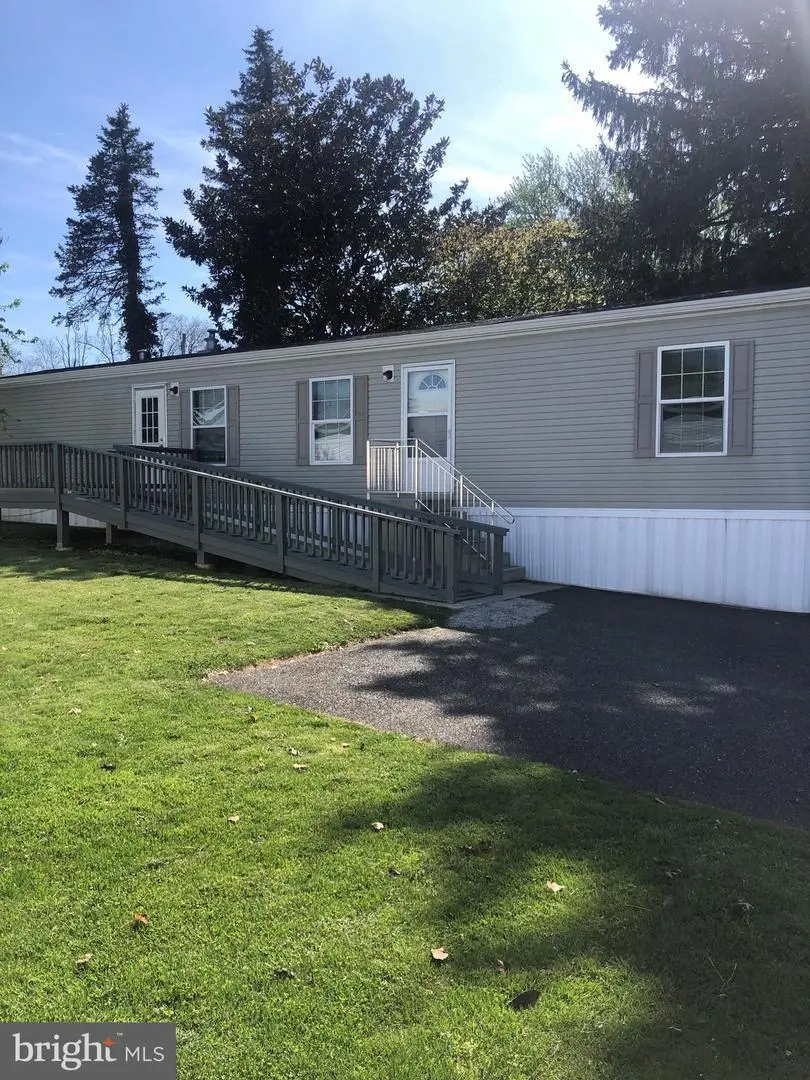
12 Valley View Ct · Richmond, PA
Flood risk 1/10 · Minimal
- FEMA flood zone
- X (unshaded)
- Chance of flooding over 30 yrs
- 0.0%
- Est. flood insurance / yr
- $507 – $1,088
Fire risk 2/10 · Minimal
- Est. fire insurance / yr
- $511 – $949
Heat risk 5/10 · Moderate
- Hot days now (above 97°F)
- 7 days/yr
- Hot days in 30 yrs
- 15 days/yr
Wind risk 4/10 · Minor
- Chance of severe wind over 30 yrs
- 17.0%
Air-quality risk 2/10 · Minimal
- Unhealthy air days now
- 1 days/yr
- Unhealthy air days in 30 yrs
- 2 days/yr
Risk factors via First Street. Map © Google.
Why this score? — see what drove the C+ grade
The composite is a weighted blend of 9 inputs, each scored 0–100. Each bar is that input's sub-score; the figure is the points it added to the 100-point composite (weight × sub-score).
- Cash flow +26.0/30.0
- 1% rule +10.0/10.0
- DSCR +8.7/10.0
- ARV discount +7.5/15.0
- Schools +3.8/10.0
- Rent growth +2.5/5.0
- Livability +2.5/5.0
- Condition / age +2.5/5.0
- Appreciation +0.0/10.0
$69,900
🖨 Deal sheet (PDF) 📄 Offer letter ✓ Due diligence
Listing remarks
Like new two bedroom, two bath mobile home in Valley View Blandon Park, Fleetwood. The one bath is a walk-in-shower. Included in sale are refrigerator, range and shed. HOA Fee of $625 includes lot rent, water, sewer and trash fees. Lawn care and snow removal are responsibility of the owner, but for a nominal fee may be acquired through the community maintenance staff. This property is ideally located to shopping, schools, medical facilities, etc. Pet are allowed upon approval from lot owner.
Key facts
- Hoa fee
- Walk-in-shower
- Shed
Tags
Property features AI
Finance
- Other: Assessed improvement value $16,700
- Financial info: Property manager present; Lease not considered
- HOA & community: Monthly association fee of $625; HOA fee includes water, sewer, and trash
Exterior
- Parking: Off-street parking
- Utilities: Well water; Public septic; Electric service
- Home design: Manufactured home; Single-story (mobile home dimensions: 12 ft wide by 60 ft long); Fee simple ownership; Senior community (55+)
- Construction: Vinyl siding; Above-grade finished area 840 (assessor)
- Exterior features: Off-street parking; Shed on property; Not in a federal flood zone; Located in Valley View park
Interior
- Bedrooms: 2 bedrooms on the main level
- Bathrooms: 2 full bathrooms on the main level; 2 full bathrooms total
- Heating & cooling: Forced air heating; Propane (leased) heating fuel; Electric hot water
- Interior features: No basement; Living area per assessor
Neighborhood map
What this means for you Summary
Snapshot
- This is a 2-bed/2.0-bath manufactured listed at $70k.
Deal economics
- At list price, monthly cash flow is $174 ($2k/yr) — positive.
- The deal already cash-flows at list — no discount required.
- Meets the 1% rule at list price ($2k rent vs $70k).
- Recommended offer: $68k (3.0% below list) — sets the bar for market timing.
Location & tenants
- Location reads: area grade C — affects rentability + tenant quality, not the cash-flow math above.
- Fleetwood Area SD (suburban): math 35% / reading 50% proficiency, ranked #281 of 539 in PA (top 52%) — families likely to look elsewhere, expect single-tenant / working-renter base with shorter leases; only 20% free/reduced lunch — higher-income household profile.
- Zoned schools: Willow Creek El Sch (math 32% / reading 55%, grade F, #866 of 1,518 statewide, top 57%, 542 students, 38% FRL); Fleetwood Ms (math 24% / reading 48%, grade F, #313 of 512 statewide, top 62%, 675 students, 40% FRL); Fleetwood Shs (math 72%, 795 students, 27% FRL) — zoned schools average 35% FRL vs 20% district-wide (15 pts higher); higher-poverty schools than district average — tighter screening recommended.
- Market conditions: 68 active listings in the ZIP; 258 units permitted in Berks County in 2024 (27 in 5+ unit buildings).
Forward outlook
- Local home prices are declining (-3.0%/yr); year-one equity from $483 of loan paydown is wiped out by about $2k of value loss. Plan a longer hold.
- Berks County population projected at +3% by 2050 — modest demand growth; plan on rents tracking national, not racing it.
- At projected returns (-3.0% appreciation + 3.0% rent growth), your $20k cash investment doubles in ~10 years — after that, you're playing with house money.
Negotiation context
- It's been on market 54 days — a 3% lower offer ($68k) is reasonable based on typical stale-listing flexibility.
Risks & watch-outs
- Watch-outs: HOA is 39% of rent.
- Climate carrying-cost: extreme-heat days projected 7→15/yr by 2055 (HVAC capex compounding) — expect insurance premiums to compound above CPI over the hold.
Questions for the listing agent
- It's been on market 54 days. Have you received any prior offers? Is the seller open to a 3% concession, seller financing, or rate buy-down credit?
- What does the HOA fee cover, when was the last increase, and are there any pending special assessments or reserve-fund shortfalls?
- Is there a deadline driving the sale (1031 exchange, divorce, estate, relocation)? That informs how much negotiation room exists.
- What's the average days-on-market for RENTAL listings here right now (not sales)? A rising rental-DOM trend means longer vacancies and softer asking-rent achievability than the comps imply.
- What's the recent tenant-quality profile in this submarket — average credit score on applications, eviction rate, late-payment / NSF rate, and stable-employment percentage? A property-management company in the area should have these aggregated.
- How much new for-sale + rental construction is in the pipeline within 1–3 miles? Heavy new supply typically softens prices + rents 12–24 months out; constrained supply supports both.
Investment metrics
- 1% rule
- 2.28% ✓
- Cap rate
- 9.28%
- Cash-on-cash
- 10.66%
- DSCR
- 1.47
- GRM
- 3.7
CMA / ARV
- ARV (median comp)
- $200,955
- List price
- $69,900
- Delta
- -65.22%
- Verdict
- UNDERPRICED
- Comps
- 8 within 1.0 mi
Show comp detail 1 sale within ~0.75 mi
| Address | Dist | Beds/Ba | Sqft | Sold | Price | $/sf | Match |
|---|---|---|---|---|---|---|---|
| 258 S View Rd | 0.08mi | 2/1.0 | 780 (-7%) | 2mo | $52,000 | $67 | 78 |
Match score weights: distance 35% · size 25% · config 20% · recency 20%. Top-matched comps best support the ARV.
Projected returns pro-forma
-3.0% appreciation · 3.0% rent growth · sell at horizon
- IRR
- 0.2%
- Equity multiple
- 1.01×
- Total profit
- $145
- Equity at exit
- $10,422
- IRR
- 10.3%
- Equity multiple
- 1.82×
- Total profit
- $15,991
- Equity at exit
- $6,044
Cash invested: $19,572 (down + closing). Projections, not guarantees.
Landlord ↔ Tenant lean methodology
- Overall (STATE)
- 62 Landlord-Friendly
- State Pennsylvania
- 62 Landlord-Friendly · EVEN
- County
- — inherits STATE
- City
- — inherits STATE
ZIP-level market 19522
- Home prices YoY
- -19.9%
- Active inventory
- 68
- Price-to-rent
- 3.7×
Monthly cashflow live
- Estimated rent
- $1,593 medium interval (Pro) →
- Mortgage (P&I)
- −$367
- Tax from tax record
- −$64 /mo · $770/yr
- Insurance
- −$29
- HOA
- −$625
- Vacancy / Maint / Mgmt
- −$335
- Net cashflow
- $174
Break-even live
Sensitivity live
| Price | -10% $214 | -5% $194 | +0% $174 | +5% $154 | +10% $134 |
|---|---|---|---|---|---|
| Rent | -10% $48 | -5% $111 | +0% $174 | +5% $237 | +10% $300 |
| Rate | -1.0pp $209 | -0.5pp $192 | base $174 | +0.5pp $156 | +1.0pp $137 |
UW: 25.0% down · 7.5% · 30yr · 1.5% tax · 5.0% vac · 8.0% maint · 8.0% mgmt
Financing live
Cash to close
- Down payment
- $17,475
- Closing costs
- $2,097
- Reserves months
- —
- Total cash needed
- —
Loan-product check · same deal, 3 products live
Conventional
25% down · 7.5% · 30yr
- Down + closing
- —
- Monthly P&I
- —
- Monthly cashflow
- —
- DSCR
- —
- Eligible?
- —
Personal DTI + credit; lowest rate.
DSCR
20% down · 8.5% · 30yr
- Down + closing
- —
- Monthly P&I
- —
- Monthly cashflow
- —
- DSCR
- —
- Eligible?
- —
No personal income docs; deal must DSCR.
Hard money
10% down · 12.0% · 12mo
- Down + closing
- —
- Monthly P&I
- —
- Monthly cashflow
- —
- DSCR
- —
- Eligible?
- —
Short-term bridge; refi at stabilization.
HOA detail
- Monthly dues
- $625 · $7,500/yr
- Likely covers
- watersewertrashlandscapingsnow removal
Listing history 18 events
-
2026-06-21days on market $69,900 Active 54 DOM
-
2026-06-21days on market $69,900 Active 53 DOM
-
2026-06-18days on market $69,900 Active 51 DOM
-
2026-06-17days on market $69,900 Active 50 DOM
-
2026-06-17price $69,900 Active 49 DOM
-
2026-06-16days on market $74,900 Active 49 DOM
-
2026-06-15days on market $74,900 Active 48 DOM
-
2026-06-13days on market $74,900 Active 46 DOM
-
2026-06-12days on market $74,900 Active 45 DOM
-
2026-06-09days on market $74,900 Active 42 DOM
-
2026-06-08days on market $74,900 Active 41 DOM
-
2026-06-08days on market $74,900 Active 40 DOM
-
2026-06-07days on market $74,900 Active 39 DOM
-
2026-06-04days on market $74,900 Active 36 DOM
-
2026-06-02days on market $74,900 Active 35 DOM
-
2026-06-01days on market $74,900 Active 34 DOM
-
2026-05-31days on market $74,900 Active 33 DOM
-
2026-04-28$84,900 Active 497-char remark
ⓘ Source: listings_history table (triggers on properties + properties_extension) + one-shot
backfill from property_details.listing_events for pre-trigger history.
Tax reassessment forecast PA · Partial reset (capped growth)
- Current annual tax
- $770 · $64/mo
- Projected year-2 tax
- $937 · $78/mo
- Expected delta
- +$167/yr (+$14/mo · 21.7%)
ⓘ Screening estimate from a state-policy table — verify with the county assessor before closing.
Climate risk First Street
- Flood 1/10 Low FEMA zone X (unshaded) · 0% chance over 30 yrs
- Wildfire 2/10 Low
- Heat 5/10 Major 7 d/yr ≥97°F today · 15 d/yr by 30 yrs out
- Wind 4/10 Moderate 17% chance of damaging wind over 30 yrs
- Air quality 2/10 Low 1 unhealthy d/yr today · 2 by 30 yrs out
Nearby sold comps map
Loading sold comps map…
Walkable amenities ~0.75 mi
Loading nearby amenities…
Taxation est. · year 1
- Rental income
- $19,121
- − Mortgage interest
- −$3,915
- − Property taxes
- −$770
- − Insurance
- −$350
- − Repairs & maintenance
- −$1,530
- − Management
- −$1,530
- − HOA
- −$7,500
- − Depreciation
- −$2,033
- Taxable income
- $1,493
- Est. tax owed @ 24.0%
- −$358
- After-tax cash flow
- $1,729/yr
For passive investors: Depreciation is non-cash, so a rental often shows a tax loss while cash-flowing — sheltering income. Rental losses are passive: they offset passive income freely, and up to $25,000/yr can offset ordinary (W-2) income if you actively participate and your MAGI is under $100k (phasing out to $0 by $150k); unused losses carry forward. On sale, claimed depreciation is recaptured at up to 25%, and gains may owe capital-gains tax (a 1031 exchange can defer both). Figures are a year-1 estimate at your 24.0% rate — not tax advice; consult a CPA.
Schools (NCES district)
- District
- Fleetwood Area SD
- NCES district ID
- 4209780
- Math proficiency
- 35% ▼ -16.00%
- Reading proficiency
- 50% ▼ -14.00%
- Median HH income
- $64,968
- Composite
- 37.94/100
- National rank
- #4307
- State rank
- #281 of 539 in PA
Livability — Richmond
No livability data for this city. (Only ~50 U.S. cities are tracked.)
Census & demographics
- Census place
- Walnuttown, PA
- Population (ZIP)
- 13,926
Population outlook (Berks County) Hauer SSP2
- Today (2025)
- 425,767 people
- By 2030
- 428,814 · +0.7%
- By 2040
- 433,463 · +1.8%
- By 2050
- 439,426 · +3.2%
- By 2075
- 478,647 · +12.4%
- By 2100
- 518,507 · +21.8%
Race, ethnicity, and origin ACS 2023
- Neighborhood character
- Predominantly White (91%)
- Race & ethnicity
- White 91% Hispanic / Latino 7% Two or more races 4% Black 1%
- Hispanic origin (detail)
- Mexican 3% Puerto Rican 1% Dominican 1%
- Common ancestry
- Polish 5% Romanian 5% Slovak 2%
- Foreign-born
- 4% · Canada
- Languages at home
- 93% English-only · Spanish 3% German/W. Germanic 3% Russian/Polish/Slavic 1%
Political lean MEDSL · Berks
- 2024 margin
- R (+12.2) · D 43.4% · R 55.6%
- 2008→2024 swing
- -21.4pp toward R · 2008: 9.2pp · 2024: -12.2pp
- All cycles
- 2024: R+12.2 2020: R+8.2 2016: R+10.2 2012: R+0.6 2008: D+9.2
Not yet ingested
- Civics
- —
Market trends
- HPI YoY
- ▼ -67.19%
- Current HPI
- 270.0276
- Rent YoY
- —
- Metro
- —
- State GDP YoY
- ▲ 1.68%
- F500 in state
- 34
Industry mix (Fortune 500 HQ in PA)
| Industry | F500 HQs | Revenue |
|---|---|---|
| Healthcare | 2 | $309B |
|
||
| Insurance | 2 | $27B |
|
||
| Telecommunications / Media | 1 | $124B |
|
||
| Industrial Distribution | 1 | $22B |
|
||
| Financial Services | 1 | $20B |
|
||
| Chemicals / Materials | 1 | $18B |
|
||
Price history
-17.7% since first listed3 events — show timeline
- 2026-06-16 Price Changed $69,900 BRIGHT MLS
- 2026-05-26 Price Changed $74,900 BRIGHT MLS
- 2026-04-28 Listed $84,900 BRIGHT MLS
Property tax history
+0.7%/yrLatest (2026): $770 · +0.0% YoY. Source: county tax records.
Cash-flow waterfall
monthlySold comps — $/sqft
last 12 mo · ≤1 miLoading sold comps…