 🏷️ Likely Rental
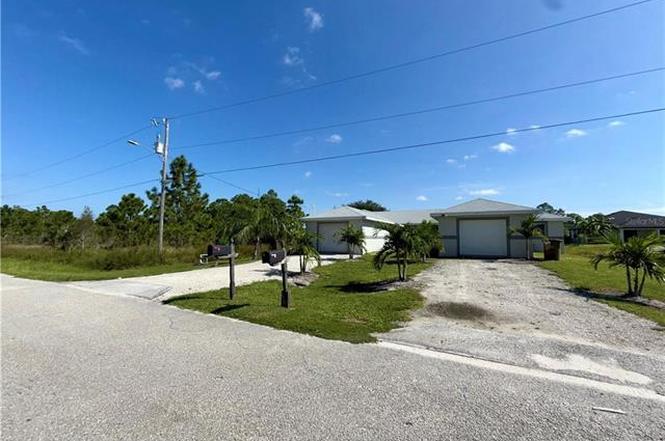
777-779 Bedford Dr · Lehigh Acres, FL
Flood risk 1/10 · Minimal
- FEMA flood zone
- X (unshaded)
- Chance of flooding over 30 yrs
- 0.0%
- Est. flood insurance / yr
- $507 – $1,088
Fire risk 2/10 · Minimal
- Est. fire insurance / yr
- $947 – $1,759
Heat risk 10/10 · Severe
- Hot days now (above 109°F)
- 7 days/yr
- Hot days in 30 yrs
- 27 days/yr
Wind risk 10/10 · Severe
- Chance of severe wind over 30 yrs
- 99.0%
Air-quality risk 2/10 · Minimal
- Unhealthy air days now
- 1 days/yr
- Unhealthy air days in 30 yrs
- 2 days/yr
Risk factors via First Street. Map © Google.
Why this score? — see what drove the C grade
The composite is a weighted blend of 9 inputs, each scored 0–100. Each bar is that input's sub-score; the figure is the points it added to the 100-point composite (weight × sub-score).
- Cash flow +15.3/30.0
- ARV discount +15.0/15.0
- Appreciation +10.0/10.0
- DSCR +4.7/10.0
- Schools +4.1/10.0
- 1% rule +4.0/10.0
- Livability +3.0/5.0
- Condition / age +2.5/5.0
- Rent growth +1.3/5.0
$394,000
🖨 Deal sheet 📄 Offer letter ✓ Due diligence
Multi-family units
County records classify this as Multi-Family (2-4 Unit). Listing-text estimate: 2 units. confirmed
Listing remarks MLS
Headline: Value-Add Duplex in Lehigh Acres | No HOA | High Rental Potential Unlock immediate equity and cash flow at 777–779 Bedford Drive. This versatile duplex features two spacious 3-bedroom, 2-bathroom units, perfectly suited for a savvy investor or an owner-occupant looking to "house hack" and let a tenant pay the mortgage. The Layout: Functional, open-concept floor plans with generous bedroom sizes. The Freedom: Zero HOA fees and no restrictive rental rules—ideal for long-term leases or creative rental strategies. The Location: Prime Lehigh Acres pocket; minutes from dining, shopping, and SR-82, with quick access to RSW International Airport. Priced to reflect condition, offering a unique opportunity to renovate and capture maximum market value. Buyer to conduct all due diligence. Photos are Virtually Staged *
Key facts
- Duplex investment
- Close to dining
- No hoa
Tags
Property features AI
Finance
- Other: Lot size approximately 0.29 acres (0.25–0.49 range); Asphalt road access; Total buildings: 1
- Financial info: Gross income reported: $43,200; Annual net income reported: $13,000; Pro forma rent for unit type listed as $2,000
- HOA & community: No association
Exterior
- Parking: Attached garage; 2 garage spaces
- Utilities: Well water; Septic tank; Electricity connected
- Home design: Residential income property (duplex); Completed condition; Single building containing both units; Zoned RM-2
- Construction: Block and stucco construction; Shingle roof; Slab foundation; Building area approximately 3,048 total (public records)
- Exterior features: Rear porch; Exterior lighting
Interior
- Kitchen: Eat-in kitchen
- Bedrooms: 6 bedrooms total; Unit configuration: 2 apartments (each 3 bedrooms)
- Bathrooms: 2 bathrooms per apartment (total 2 listed under unit type)
- Heating & cooling: Central heating; Central air conditioning
- Interior features: Eat-in kitchen; High ceilings; Open floorplan; Thermostat; Vaulted ceilings
- Laundry & utility: Laundry area located in garage
Neighborhood map
What this means for you Summary
Snapshot
- This is a 2 × 3-bed/2.0-bath units multifamily listed at $394k.
Deal economics
- At list price, monthly cash flow is $145 ($2k/yr) — positive. Per door: $73/mo.
- The deal already cash-flows at list — no discount required.
- To meet the 1% rule (rent ≥ 1% of price), the offer needs to be $354k (10.3% below list).
- Recommended offer: $354k (10.3% below list) — sets the bar for 1% rule.
- Cap rate 6.7% vs local median 4.7% in Lehigh Acres — top-decile yield for the area; either an underpriced asset or a hidden risk that comps aren't pricing in. Stress-test before assuming the spread holds.
Location & tenants
- Location reads 59/100 on livability (#826 in FL) — a working-class tenant base; expect higher turnover. Strengths: cost of living A+, housing A+; Watch: crime C-, employment D+, schools D-.
- Lee (suburban): math 47% / reading 50% proficiency, ranked #42 of 73 in FL (top 58%) — families likely to look elsewhere, expect single-tenant / working-renter base with shorter leases.
- Market conditions: Rents falling (-4.7%/yr); 2460 active listings in the ZIP; 15,411 units permitted in Lee County in 2024 (4,686 in 5+ unit buildings).
- At $3,536/mo this rent would consume 59% of the median local household income ($72k/yr) (locally 434% of renters already pay >50% of income on rent) — very limited rent-growth headroom before tenants either downsize or default.
Forward outlook
- In year one you build about $42k of equity ($3k loan paydown + $39k appreciation (10.0% local appreciation)).
- Lee County population projected at +44% by 2050 — long-run rental-demand tailwind backs the buy-and-hold thesis.
- At projected returns (10.0% appreciation + 0.0% rent growth), your $110k cash investment doubles in ~3 years — after that, you're playing with house money.
- By year 2, paydown + projected appreciation supports a ~$68k cash-out refi (75% LTV) — recoverable capital for the next deal without selling this one.
Negotiation context
- It's been on market 120 days — a 9% lower offer ($359k) is reasonable based on typical stale-listing flexibility.
- 4 sale attempts since 3y ago with the ask held roughly flat each time — persistent listings suggest the price (not the market) is what's stuck; bring a comps-based counter.
Risks & watch-outs
- Climate carrying-cost: severe wind risk, 99% chance of damaging wind over 30y; extreme-heat days projected 7→27/yr by 2055 (HVAC capex compounding) — expect insurance premiums to compound above CPI over the hold.
Questions for the listing agent
- It's been on market 120 days. Have you received any prior offers? Is the seller open to a 10% concession, seller financing, or rate buy-down credit?
- Can we see the unit-by-unit rent roll, current vacancy, and any below-market leases? What's the average tenancy length?
- What capital expenditures (roof, boiler, parking lot, exteriors) have been made in the last 5 years, and what's planned in the next 2?
- Why hasn't it sold? Are there any deal-killer items the seller is aware of (foundation, flood, title, zoning, code violations)?
- Is there a deadline driving the sale (1031 exchange, divorce, estate, relocation)? That informs how much negotiation room exists.
- Schools are D-rated, which usually means shorter tenancies and higher turnover. Who's the typical renter profile here, and what's been the actual vacancy rate?
- What's the average days-on-market for RENTAL listings here right now (not sales)? A rising rental-DOM trend means longer vacancies and softer asking-rent achievability than the comps imply.
- What's the recent tenant-quality profile in this submarket — average credit score on applications, eviction rate, late-payment / NSF rate, and stable-employment percentage? A property-management company in the area should have these aggregated.
- How much new apartment / multifamily construction is in the pipeline within 1–3 miles? Heavy new supply (>2% of stock underway) typically softens rents 12–24 months out; light construction supports rent growth.
Investment metrics
- 1% rule
- 0.90% ✗
- Cap rate
- 6.74%
- Cash-on-cash
- 1.58%
- DSCR
- 1.07
- GRM
- 9.3
CMA / ARV
- ARV (on-the-fly)
- $495,790
- Comps found
- 1
Show comp detail 1 sale within ~0.75 mi
| Address | Dist | Beds/Ba | Sqft | Sold | Price | $/sf | Match |
|---|---|---|---|---|---|---|---|
| 941-943 Jaguar Blvd | 0.23mi | 6/4.0 | 2,386 (+4%) | 21mo | $512,000 | $215 | 66 |
Match score weights: distance 35% · size 25% · config 20% · recency 20%. Top-matched comps best support the ARV.
Projected returns pro-forma
10.0% appreciation · 0.0% rent growth · sell at horizon
- IRR
- 24.4%
- Equity multiple
- 2.94×
- Total profit
- $213,487
- Equity at exit
- $354,946
- IRR
- 20.9%
- Equity multiple
- 6.46×
- Total profit
- $602,862
- Equity at exit
- $765,455
Cash invested: $110,320 (down + closing). Projections, not guarantees.
Landlord ↔ Tenant lean methodology
- Overall (STATE)
- 87 Strongly Landlord-Friendly
- State Florida
- 87 Strongly Landlord-Friendly · R+3
- County
- — inherits STATE
- City
- — inherits STATE
ZIP-level market 33974
- Home prices YoY
- 5.8%
- Rents YoY
- -4.7%
- Active inventory
- 2460
- Price-to-rent
- 18.6×
Monthly cashflow live
- Estimated rent
- $3,536 high interval (Pro) →
- Mortgage (P&I)
- −$2,066
- Tax from tax record
- −$418 /mo · $5,013/yr
- Insurance
- −$164
- HOA
- −$0
- Vacancy / Maint / Mgmt
- −$743
- Net cashflow
- $145
Break-even live
2-unit breakdown (identical units grouped — click to expand)
| Units | Beds | Baths | Est. rent |
|---|---|---|---|
| 2× units | 3 | 2 | $3,536 |
| #1 | 3 | 2 | $1,768 |
| #2 | 3 | 2 | $1,768 |
| Total (2 units) | $3,536 | ||
UW: 25.0% down · 7.5% · 30yr · 1.5% tax · 5.0% vac · 8.0% maint · 8.0% mgmt
Financing live
Cash to close
- Down payment
- $98,500
- Closing costs
- $11,820
- Reserves months
- —
- Total cash needed
- —
Loan-product check · same deal, 3 products live
Conventional
25% down · 7.5% · 30yr
- Down + closing
- —
- Monthly P&I
- —
- Monthly cashflow
- —
- DSCR
- —
- Eligible?
- —
Personal DTI + credit; lowest rate.
DSCR
20% down · 8.5% · 30yr
- Down + closing
- —
- Monthly P&I
- —
- Monthly cashflow
- —
- DSCR
- —
- Eligible?
- —
No personal income docs; deal must DSCR.
Hard money
10% down · 12.0% · 12mo
- Down + closing
- —
- Monthly P&I
- —
- Monthly cashflow
- —
- DSCR
- —
- Eligible?
- —
Short-term bridge; refi at stabilization.
Listing history 20 events
-
2026-06-17days on market $394,000 Active 120 DOM
-
2026-06-16days on market $394,000 Active 119 DOM
-
2026-06-15days on market $394,000 Active 118 DOM
-
2026-06-13days on market $394,000 Active 116 DOM
-
2026-06-10days on market $394,000 Active 113 DOM
-
2026-06-09days on market $394,000 Active 112 DOM
-
2026-06-07days on market $394,000 Active 110 DOM
-
2026-06-02days on market $394,000 Active 105 DOM
-
2026-06-01days on market $394,000 Active 104 DOM
-
2026-06-01remarks 689-char remark
-
2026-06-01pricedays on market $394,000 Active 103 DOM
-
2026-03-04$399,000 Active 852-char remark
Show marketing remark (852 chars)
Headline: Value-Add Duplex in Lehigh Acres | No HOA | High Rental Potential Unlock immediate equity and cash flow at 777–779 Bedford Drive. This versatile duplex features two spacious 3-bedroom, 2-bathroom units, perfectly suited for a savvy investor or an owner-occupant looking to "house hack" and let a tenant pay the mortgage. The Layout: Functional, open-concept floor plans with generous bedroom sizes. The Freedom: Zero HOA fees and no restrictive rental rules—ideal for long-term leases or creative rental strategies. The Location: Prime Lehigh Acres pocket; minutes from dining, shopping, and SR-82, with quick access to RSW International Airport. Priced to reflect condition, offering a unique opportunity to renovate and capture maximum market value. Buyer to conduct all due diligence. Photos are Virtually Staged *
-
2026-02-17$399,000 Active
-
2025-12-17historical
-
2025-10-29$419,000 Active
-
2023-08-28soldstatus $440,500
-
2023-08-23soldstatus $440,500 Closed
-
2023-07-01status Pending
-
2023-06-22$420,000 Active
-
2007-05-22soldstatus $256,000
ⓘ Source: listings_history table (triggers on properties + properties_extension) + one-shot
backfill from property_details.listing_events for pre-trigger history.
Tax reassessment forecast FL · Resets to sale price
- Current annual tax
- $5,013 · $418/mo
- Projected year-2 tax
- $5,013 · $418/mo
- Expected delta
- $0/yr ($0/mo · 0.0%)
ⓘ Screening estimate from a state-policy table — verify with the county assessor before closing.
Climate risk First Street
- Flood 1/10 Low FEMA zone X (unshaded) · 0% chance over 30 yrs
- Wildfire 2/10 Low
- Heat 10/10 Extreme 7 d/yr ≥109°F today · 27 d/yr by 30 yrs out
- Wind 10/10 Extreme 99% chance of damaging wind over 30 yrs
- Air quality 2/10 Low 1 unhealthy d/yr today · 2 by 30 yrs out
Nearby sold comps map
Loading sold comps map…
Walkable amenities ~0.75 mi
Loading nearby amenities…
Taxation est. · year 1
- Rental income
- $42,432
- − Mortgage interest
- −$22,070
- − Property taxes
- −$5,013
- − Insurance
- −$1,970
- − Repairs & maintenance
- −$3,395
- − Management
- −$3,395
- − Depreciation
- −$11,462
- Taxable loss
- −$4,872
- Est. tax savings @ 24.0%
- +$1,169
- After-tax cash flow
- $2,914/yr
For passive investors: Depreciation is non-cash, so a rental often shows a tax loss while cash-flowing — sheltering income. Rental losses are passive: they offset passive income freely, and up to $25,000/yr can offset ordinary (W-2) income if you actively participate and your MAGI is under $100k (phasing out to $0 by $150k); unused losses carry forward. On sale, claimed depreciation is recaptured at up to 25%, and gains may owe capital-gains tax (a 1031 exchange can defer both). Figures are a year-1 estimate at your 24.0% rate — not tax advice; consult a CPA.
Schools (NCES district)
- District
- Lee
- NCES district ID
- 1201080
- Math proficiency
- 47% ▼ -11.00%
- Reading proficiency
- 50% ▼ -4.00%
- Median HH income
- $49,518
- Composite
- 41.49/100
- National rank
- #3458
- State rank
- #42 of 73 in FL
Livability — Lehigh Acres
- Score
- 59/100
- State rank
- #826
- US rank
- #20055
Category grades
Schools grade is shown separately in the Schools card above.
Census & demographics
- Census place
- Lehigh Acres, FL
- County
- Lee County · 788,662 people
- City population
- 130,638
- Metro
- Cape Coral-Fort Myers, FL
- Population (ZIP)
- 19,927
- Household income
- $72,192
- Rent vs Own
- Severe rent burden
- 434.0
Population outlook (Lee County) Hauer SSP2
- Today (2025)
- 871,946 people
- By 2030
- 955,468 · +9.6%
- By 2040
- 1,113,587 · +27.7%
- By 2050
- 1,256,891 · +44.1%
- By 2075
- 1,560,270 · +78.9%
- By 2100
- 1,726,848 · +98.0%
Race, ethnicity, and origin ACS 2023
- Neighborhood character
- Diverse neighborhood (Simpson 0.64)
- Race & ethnicity
- Hispanic / Latino 52% Two or more races 31% White 26% Black 18%
- Hispanic origin (detail)
- Mexican 12% Puerto Rican 7% Cuban 20% Dominican 4%
- Common ancestry
- Hispanic 7% Italian 1% Portuguese 1%
- Foreign-born
- 32% · Canada, Jamaica
- Languages at home
- 48% English-only · Spanish 43% French/Haitian/Cajun 7% Other Indo-European 1%
Political lean MEDSL · Lee
- 2024 margin
- Strong R (+28.4) · D 35.5% · R 63.9%
- 2008→2024 swing
- -18.0pp toward R · 2008: -10.4pp · 2024: -28.4pp
- All cycles
- 2024: R+28.4 2020: R+19.2 2016: R+20.4 2012: R+16.6 2008: R+10.4
Not yet ingested
- Civics
- —
Market trends
- HPI YoY
- ▲ 16.53%
- Current HPI
- 303.3399
- Rent YoY
- ▼ -4.68%
- Metro
- Cape Coral-Fort Myers, FL
- State GDP YoY
- ▲ 3.28%
- F500 in state
- 36
Industry mix (Fortune 500 HQ in FL)
| Industry | F500 HQs | Revenue |
|---|---|---|
| Industrial Technology | 2 | $29B |
|
||
| Insurance | 2 | $17B |
|
||
| Retail | 1 | $60B |
|
||
| Technology Distribution | 1 | $58B |
|
||
| Homebuilding | 1 | $35B |
|
||
| Technology Manufacturing | 1 | $35B |
|
||
Price history
+55.9% since first listed9 events — show timeline
- 2026-03-04 Listed $399,000 NAPLESMLS
- 2026-02-17 Listed $399,000 Stellar MLS as Distributed by MLS Grid
- 2025-12-17 Listing Removed — Stellar MLS as Distributed by MLS Grid
- 2025-10-29 Listed $419,000 Stellar MLS as Distributed by MLS Grid
- 2023-08-28 Sold (Public Records) $440,500 Public Records
- 2023-08-23 Sold (MLS) $440,500 FORTMLS
- 2023-07-01 Pending — FORTMLS
- 2023-06-22 Listed $420,000 FORTMLS
- 2007-05-22 Sold (Public Records) $256,000 Public Records
Property tax history
+6.2%/yrLatest (2025): $5,013 · +4.9% YoY. Source: county tax records.
Cash-flow waterfall
monthlySold comps — $/sqft
last 12 mo · ≤1 miLoading sold comps…