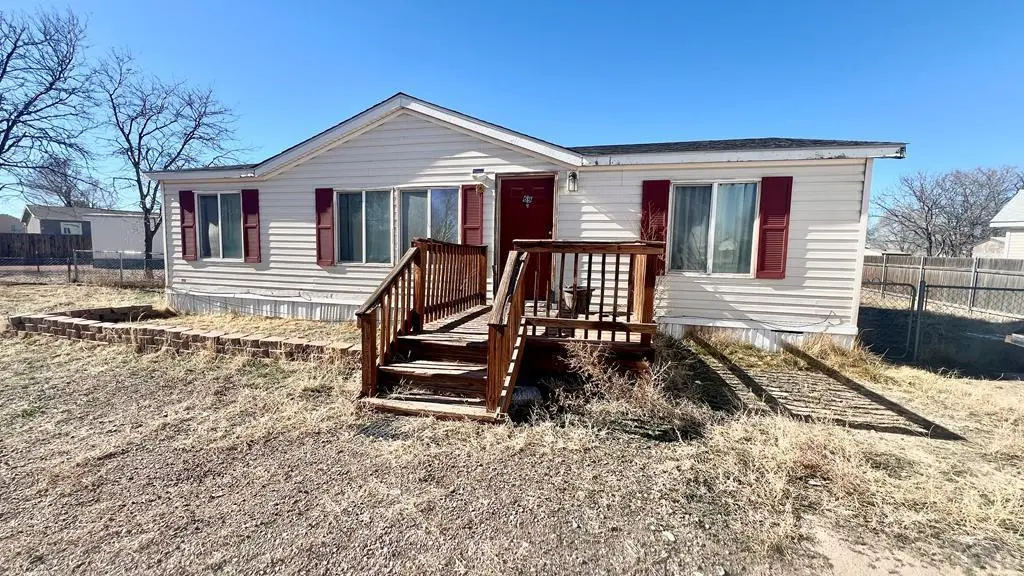
69 E Dante Pl · Pueblo West, CO
Flood risk 1/10 · Minimal
- FEMA flood zone
- X (unshaded)
- Chance of flooding over 30 yrs
- 0.0%
- Est. flood insurance / yr
- $473 – $860
Fire risk 5/10 · Moderate
- Est. fire insurance / yr
- $939 – $1,743
Heat risk 4/10 · Minor
- Hot days now (above 96°F)
- 6 days/yr
- Hot days in 30 yrs
- 17 days/yr
Wind risk 2/10 · Minimal
- Chance of severe wind over 30 yrs
- —
Air-quality risk 1/10 · Minimal
- Unhealthy air days now
- 0 days/yr
- Unhealthy air days in 30 yrs
- 0 days/yr
Risk factors via First Street. Map © Google.
Why this score? — see what drove the D- grade
The composite is a weighted blend of 9 inputs, each scored 0–100. Each bar is that input's sub-score; the figure is the points it added to the 100-point composite (weight × sub-score).
- Cash flow +14.9/30.0
- DSCR +4.6/10.0
- ARV discount +4.0/15.0
- 1% rule +3.2/10.0
- Livability +3.2/5.0
- Schools +3.0/10.0
- Rent growth +2.5/5.0
- Condition / age +2.5/5.0
- Appreciation +0.0/10.0
$225,000
🖨 Deal sheet (PDF) 📄 Offer letter ✓ Due diligence
Listing remarks MLS
New carpet & paint. Bring all offers bank owned home and land are sold as-is, where is, without any warranties or guaranties either written or implied. Pre-qual letter with all offers. Special warranty deed. No seller disclosures given, as is. Additional provisions of purchase contract must be read-home and land are sold as is, where is.
Key facts
- Central location
- Convenient access
- Functional layout
Tags
Property features AI
Finance
- HOA & community: No association amenities
Exterior
- Parking: No garage
- Utilities: Public water; Public sewer
- Home design: Manufactured single-family home; Residential property
- Construction: Vinyl siding; Composition roof; Built above grade (finished area noted)
- Exterior features: Deck; Cul-de-sac lot; Irregular-shaped lot
Interior
- Kitchen: Range; Oven; Dishwasher; Refrigerator
- Bedrooms: 3 bedrooms on the main level
- Flooring: Carpet; Laminate
- Bathrooms: 2 full bathrooms; 1 bathroom on the main level
- Heating & cooling: Natural gas forced-air heating; Ceiling fan cooling
- Interior features: Ceiling fans; Vaulted ceilings; Walk-in closets; Primary bedroom on main level
- Laundry & utility: Washer; Dryer; Laundry on the main level
Neighborhood map
What this means for you Summary
Snapshot
- This is a 3-bed/2.0-bath manufactured listed at $225k.
Deal economics
- At list price, monthly cash flow is $66 ($791/yr) — positive.
- The deal already cash-flows at list — no discount required.
- To meet the 1% rule (rent ≥ 1% of price), the offer needs to be $184k (18.4% below list).
- Recommended offer: $184k (18.4% below list) — sets the bar for 1% rule.
- Cap rate 6.6% vs local median 3.6% in Pueblo West — top-decile yield for the area; either an underpriced asset or a hidden risk that comps aren't pricing in. Stress-test before assuming the spread holds.
Location & tenants
- Location reads 63/100 on livability (#189 in CO) — a middle-class / working-renter tenant base. Strengths: housing A+, employment B+; Watch: health & safety C-, crime F, amenities F.
- Pueblo County School District 70 (suburban): math 24% / reading 43% proficiency, ranked #40 of 86 in CO (top 46%) — families likely to look elsewhere, expect single-tenant / working-renter base with shorter leases.
- Zoned schools: Prairie Winds Elementary School (math 24% / reading 27%, grade F, #594 of 966 statewide, top 62%, 500 students, 47% FRL); Sky View Middle School (math 22% / reading 47%, grade F, #106 of 270 statewide, top 42%, 577 students, 41% FRL); Pueblo West High School (math 23% / reading 52%, grade F, #192 of 381 statewide, top 51%, 1,484 students, 40% FRL).
- Market conditions: Rents soft (-0.1%/yr); 650 active listings in the ZIP; 15 comparable units currently listed for rent nearby; rentals at typical pace (median 15d on market — plan ~3-4 weeks tenant-placement turnaround); solid renter incomes; 269 units permitted in Pueblo County in 2024 (0 in 5+ unit buildings).
Forward outlook
- Local home prices are declining (-3.0%/yr); year-one equity from $2k of loan paydown is wiped out by about $7k of value loss. Plan a longer hold.
- Pueblo County population projected at +10% by 2050 — modest demand growth; plan on rents tracking national, not racing it.
Negotiation context
- It's been on market 73 days — a 6% lower offer ($212k) is reasonable based on typical stale-listing flexibility.
- 2 sale attempts since 19y ago with the ask held roughly flat each time — persistent listings suggest the price (not the market) is what's stuck; bring a comps-based counter.
- Current owner paid $48k; list at $225k implies a 374% gain — meaningful room to come down on a strong offer.
Risks & watch-outs
- Climate carrying-cost: moderate wildfire risk — expect insurance premiums to compound above CPI over the hold.
Questions for the listing agent
- It's been on market 73 days. Have you received any prior offers? Is the seller open to a 18% concession, seller financing, or rate buy-down credit?
- Why hasn't it sold? Are there any deal-killer items the seller is aware of (foundation, flood, title, zoning, code violations)?
- Is there a deadline driving the sale (1031 exchange, divorce, estate, relocation)? That informs how much negotiation room exists.
- Schools are D-rated, which usually means shorter tenancies and higher turnover. Who's the typical renter profile here, and what's been the actual vacancy rate?
- Crime grade is F in this area — have there been break-ins, vandalism, or insurance claims at this property in the last 3 years? What carrier currently insures it and at what premium?
- The area grade is low — what's the realistic commute time and amenity access for the typical tenant pool here? Any planned neighborhood developments (good or bad) we should know about?
- What's the average days-on-market for RENTAL listings here right now (not sales)? A rising rental-DOM trend means longer vacancies and softer asking-rent achievability than the comps imply.
- What's the recent tenant-quality profile in this submarket — average credit score on applications, eviction rate, late-payment / NSF rate, and stable-employment percentage? A property-management company in the area should have these aggregated.
- How much new for-sale + rental construction is in the pipeline within 1–3 miles? Heavy new supply typically softens prices + rents 12–24 months out; constrained supply supports both.
Investment metrics
- 1% rule
- 0.82% ✗
- Cap rate
- 6.64%
- Cash-on-cash
- 1.26%
- DSCR
- 1.06
- GRM
- 10.2
CMA / ARV
- ARV (on-the-fly)
- $208,640
- Comps found
- 12
Show comp detail 12 sales within ~0.75 mi
| Address | Dist | Beds/Ba | Sqft | Sold | Price | $/sf | Match |
|---|---|---|---|---|---|---|---|
| 120 E Kipling Dr | 0.23mi | 3/2.0 | 1,344 (+5%) | 2mo | $259,900 | $193 | 80 |
| 82 E Kipling Dr | 0.21mi | 3/2.0 | 1,220 (-5%) | 13mo | $110,000 | $90 | 72 |
| 129 E Countryside Dr | 0.39mi | 3/2.0 | 1,216 (-5%) | 3mo | $162,000 | $133 | 71 |
| 213 E Homer Dr | 0.37mi | 3/2.0 | 1,372 (+7%) | 3mo | $195,000 | $142 | 68 |
| 312 E George Dr | 0.35mi | 3/2.0 | 1,179 (-8%) | 6mo | $159,000 | $135 | 65 |
| 945 Saki Dr | 0.39mi | 3/2.0 | 1,216 (-5%) | 11mo | $204,000 | $168 | 64 |
| 172 E Countryside Dr | 0.45mi | 3/2.0 | 1,216 (-5%) | 8mo | $170,000 | $140 | 64 |
| 895 S Tolstoi Dr | 0.38mi | 3/2.0 | 1,368 (+7%) | 10mo | $222,500 | $163 | 63 |
| 249 E Dawnview Dr | 0.62mi | 3/2.0 | 1,216 (-5%) | 4mo | $269,900 | $222 | 59 |
| 971 S Silt Dr | 0.56mi | 3/2.0 | 1,169 (-9%) | 1mo | $205,000 | $175 | 59 |
| 208 E Dawnview Dr | 0.62mi | 3/2.0 | 1,344 (+5%) | 7mo | $198,000 | $147 | 57 |
| 813 S Frost Dr | 0.16mi | 4/2.0 (+1) | 1,456 (+14%) | 12mo | $300,000 | $206 | 54 |
Match score weights: distance 35% · size 25% · config 20% · recency 20%. Top-matched comps best support the ARV.
Projected returns pro-forma
-3.0% appreciation · 0.0% rent growth · sell at horizon
- IRR
- -17.4%
- Equity multiple
- 0.40×
- Total profit
- $-37,719
- Equity at exit
- $33,548
- IRR
- -15.6%
- Equity multiple
- 0.23×
- Total profit
- $-48,549
- Equity at exit
- $19,454
Cash invested: $63,000 (down + closing). Projections, not guarantees.
Landlord ↔ Tenant lean methodology
- Overall (STATE)
- 38 Tenant-Leaning
- State Colorado
- 38 Tenant-Leaning · D+4
- County
- — inherits STATE
- City
- — inherits STATE
ZIP-level market 81007
- Home prices YoY
- -22.9%
- Rents YoY
- -0.1%
- Active inventory
- 650
- Price-to-rent
- 10.2×
Monthly cashflow live
- Estimated rent
- $1,837 high interval (Pro) →
- Mortgage (P&I)
- −$1,180
- Tax from tax record
- −$111 /mo · $1,336/yr
- Insurance
- −$94
- HOA
- −$0
- Vacancy / Maint / Mgmt
- −$386
- Net cashflow
- $66
Break-even live
Sensitivity live
| Price | -10% $193 | -5% $130 | +0% $66 | +5% $2 | +10% $-61 |
|---|---|---|---|---|---|
| Rent | -10% $-79 | -5% $-7 | +0% $66 | +5% $138 | +10% $211 |
| Rate | -1.0pp $179 | -0.5pp $123 | base $66 | +0.5pp $8 | +1.0pp $-52 |
UW: 25.0% down · 7.5% · 30yr · 1.5% tax · 5.0% vac · 8.0% maint · 8.0% mgmt
Financing live
Cash to close
- Down payment
- $56,250
- Closing costs
- $6,750
- Reserves months
- —
- Total cash needed
- —
Loan-product check · same deal, 3 products live
Conventional
25% down · 7.5% · 30yr
- Down + closing
- —
- Monthly P&I
- —
- Monthly cashflow
- —
- DSCR
- —
- Eligible?
- —
Personal DTI + credit; lowest rate.
DSCR
20% down · 8.5% · 30yr
- Down + closing
- —
- Monthly P&I
- —
- Monthly cashflow
- —
- DSCR
- —
- Eligible?
- —
No personal income docs; deal must DSCR.
Hard money
10% down · 12.0% · 12mo
- Down + closing
- —
- Monthly P&I
- —
- Monthly cashflow
- —
- DSCR
- —
- Eligible?
- —
Short-term bridge; refi at stabilization.
Rent comps 15 comps
| Address | Beds | Baths | Sqft | Rent | $/sqft | DOM | Units | Dist |
|---|---|---|---|---|---|---|---|---|
| 98 E Byrd Dr Pueblo, CO | 3.0 | 2.0 | 1140 | $1,515 | $1.33 | 15d | 1 | 0.16mi |
| 771 S Sterling Dr Pueblo, CO | 3.0 | 2.0 | 1129 | $1,620 | $1.43 | 15d | 1 | 0.31mi |
| 655 S Inca Dr Pueblo, CO | 3.0 | 2.0 | 1008 | $2,000 | $1.98 | 15d | 1 | 0.42mi |
| 343 E Bond Ct Pueblo, CO | 4.0 | 3.0 | 1149 | $2,300 | $2.00 | 23d | 1 | 0.55mi |
| 512 S Aguilar Dr Pueblo West, CO | 1.0–2.0 | 1.5 | 825 | $1,185 | $1.44 | 15d | 2 | 0.66mi |
| 228 W Palomar Plz Pueblo, CO | 2.0 | 2.0 | 1358 | $1,850 | $1.36 | 15d | 1 | 0.76mi |
| 662 S Burro Dr Pueblo, CO | 3.0 | 2.5 | 1248 | $2,100 | $1.68 | 15d | 1 | 0.76mi |
| 82 W Baldwyn Dr Unit 86 Pueblo West, CO | 3.0 | 2.0 | 1100 | $1,700 | $1.55 | 23d | 1 | 0.78mi |
| 82 W Baldwyn Dr #88 Pueblo, CO | 3.0 | 2.0 | 1100 | $1,700 | $1.55 | 15d | 1 | 0.78mi |
| 251 W Acorn Dr Unit 251 Pueblo West, CO | 3.0 | 2.0 | 1500 | $2,050 | $1.37 | 15d | 1 | 0.94mi |
| 241 W Laurue Ln Pueblo West, CO | 3.0 | 2.0 | 1484 | $2,200 | $1.48 | 15d | 1 | 0.95mi |
| 230 W Elbow Dr Unit 228 Pueblo, CO | 3.0 | 2.5 | 1427 | $2,025 | $1.42 | 15d | 1 | 1.04mi |
| 208 W Palmer Lake Dr Pueblo, CO | 2.0 | 1.0 | 900 | $1,050 | $1.17 | 23d | 1 | 1.17mi |
| 970 S Coral Pl Pueblo West, CO | 3.0 | 2.0 | 1484 | $2,195 | $1.48 | 15d | 1 | 1.22mi |
| 318 W Coral Dr Pueblo West, CO | 2.0 | 2.0 | 1060 | $1,575 | $1.49 | 23d | 1 | 1.22mi |
Listing history 21 events
-
2026-06-21days on market $225,000 Active 73 DOM
-
2026-06-19days on market $225,000 Active 71 DOM
-
2026-06-18days on market $225,000 Active 70 DOM
-
2026-06-17days on market $225,000 Active 69 DOM
-
2026-06-16days on market $225,000 Active 68 DOM
-
2026-06-15days on market $225,000 Active 67 DOM
-
2026-06-14days on market $225,000 Active 65 DOM
-
2026-06-13days on market $225,000 Active 64 DOM
-
2026-06-10days on market $225,000 Active 62 DOM
-
2026-06-09days on market $225,000 Active 61 DOM
-
2026-06-08days on market $225,000 Active 60 DOM
-
2026-06-07days on market $225,000 Active 59 DOM
-
2026-06-05days on market $225,000 Active 56 DOM
-
2026-06-03days on market $225,000 Active 55 DOM
-
2026-06-02days on market $225,000 Active 54 DOM
-
2026-06-01days on market $225,000 Active 53 DOM
-
2026-05-31days on market $225,000 Active 52 DOM
-
2026-05-30days on market $225,000 Active 51 DOM
-
2026-04-09$225,000 Active
-
2007-10-31soldstatus $47,500 345-char remark
Show marketing remark (345 chars)
New carpet & paint. Bring all offers bank owned home and land are sold as-is, where is, without any warranties or guaranties either written or implied. Pre-qual letter with all offers. Special warranty deed. No seller disclosures given, as is. Additional provisions of purchase contract must be read-home and land are sold as is, where is.
-
2007-09-05$49,995 345-char remark
Show marketing remark (345 chars)
New carpet & paint. Bring all offers bank owned home and land are sold as-is, where is, without any warranties or guaranties either written or implied. Pre-qual letter with all offers. Special warranty deed. No seller disclosures given, as is. Additional provisions of purchase contract must be read-home and land are sold as is, where is.
ⓘ Source: listings_history table (triggers on properties + properties_extension) + one-shot
backfill from property_details.listing_events for pre-trigger history.
Tax reassessment forecast CO · Resets to sale price
- Current annual tax
- $1,336 · $111/mo
- Projected year-2 tax
- $1,336 · $111/mo
- Expected delta
- $0/yr ($0/mo · 0.0%)
ⓘ Screening estimate from a state-policy table — verify with the county assessor before closing.
Climate risk First Street
- Flood 1/10 Low FEMA zone X (unshaded) · 0% chance over 30 yrs
- Wildfire 5/10 Major
- Heat 4/10 Moderate 6 d/yr ≥96°F today · 17 d/yr by 30 yrs out
- Wind 2/10 Low
- Air quality 1/10 Low 0 unhealthy d/yr today · 0 by 30 yrs out
Nearby sold comps map
Loading sold comps map…
Walkable amenities ~0.75 mi
Loading nearby amenities…
Taxation est. · year 1
- Rental income
- $22,040
- − Mortgage interest
- −$12,603
- − Property taxes
- −$1,336
- − Insurance
- −$1,125
- − Repairs & maintenance
- −$1,763
- − Management
- −$1,763
- − Depreciation
- −$6,545
- Taxable loss
- −$3,097
- Est. tax savings @ 24.0%
- +$743
- After-tax cash flow
- $1,535/yr
For passive investors: Depreciation is non-cash, so a rental often shows a tax loss while cash-flowing — sheltering income. Rental losses are passive: they offset passive income freely, and up to $25,000/yr can offset ordinary (W-2) income if you actively participate and your MAGI is under $100k (phasing out to $0 by $150k); unused losses carry forward. On sale, claimed depreciation is recaptured at up to 25%, and gains may owe capital-gains tax (a 1031 exchange can defer both). Figures are a year-1 estimate at your 24.0% rate — not tax advice; consult a CPA.
Schools (NCES district)
- District
- Pueblo County School District 70
- NCES district ID
- 0806150
- Math proficiency
- 24% ▼ -4.00%
- Reading proficiency
- 43% ▼ -2.00%
- Median HH income
- $59,438
- Composite
- 29.93/100
- National rank
- #6381
- State rank
- #40 of 86 in CO
Livability — Pueblo West
- Score
- 63/100
- State rank
- #189
- US rank
- #15760
Category grades
Schools grade is shown separately in the Schools card above.
Census & demographics
- Census place
- Pueblo West, CO
- County
- Pueblo County · 151,887 people
- Metro
- Pueblo, CO
- Population (ZIP)
- 35,690
- Household income
- $96,713
- Rent vs Own
- Severe rent burden
- 353.0
Population outlook (Pueblo County) Hauer SSP2
- Today (2025)
- 173,240 people
- By 2030
- 177,716 · +2.6%
- By 2040
- 185,125 · +6.9%
- By 2050
- 190,642 · +10.0%
- By 2075
- 201,611 · +16.4%
- By 2100
- 196,443 · +13.4%
Race, ethnicity, and origin ACS 2023
- Neighborhood character
- Predominantly White (65%)
- Race & ethnicity
- White 65% Hispanic / Latino 29% Two or more races 11% Asian 1% Black 1%
- Hispanic origin (detail)
- Mexican 19%
- Common ancestry
- Romanian 2% Lithuanian 2% Italian 2%
- Foreign-born
- 4% · Canada
- Languages at home
- 92% English-only · Spanish 7%
Political lean MEDSL · Pueblo
- 2024 margin
- Lean R (+5.1) · D 46.2% · R 51.3% · Other 2.5%
- 2008→2024 swing
- -20.1pp toward R · 2008: 15.0pp · 2024: -5.1pp
- All cycles
- 2024: R+5.1 2020: D+1.7 2016: D+0.3 2012: D+13.1 2008: D+15.0
Not yet ingested
- Civics
- —
Market trends
- HPI YoY
- ▼ -82.80%
- Current HPI
- 279.191
- Rent YoY
- ▼ -0.10%
- Metro
- Pueblo, CO
- State GDP YoY
- ▲ 1.95%
- F500 in state
- 14
Industry mix (Fortune 500 HQ in CO)
| Industry | F500 HQs | Revenue |
|---|---|---|
| Technology Distribution | 1 | $31B |
|
||
| Food / Agriculture | 1 | $18B |
|
||
| Packaging | 1 | $14B |
|
||
| Healthcare | 1 | $13B |
|
||
| Energy | 1 | $10B |
|
||
| Technology | 1 | $4B |
|
||
Price history
+350.0% since first listed3 events — show timeline
- 2026-04-09 Listed $225,000 PARMLS
- 2007-10-31 Sold (MLS) $47,500 PARMLS
- 2007-09-05 Listed $49,995 PARMLS
Property tax history
+9.7%/yrLatest (2025): $1,336 · +49.3% YoY. Source: county tax records.
Cash-flow waterfall
monthlySold comps — $/sqft
last 12 mo · ≤1 miLoading sold comps…