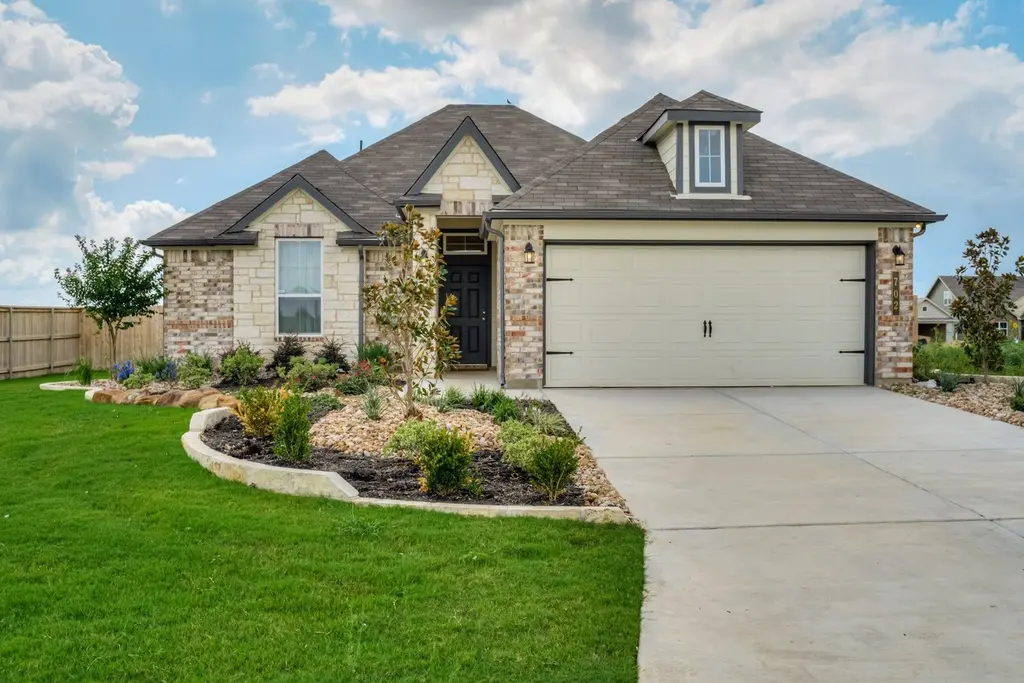
11504 Themis Ct · Waco, TX
Flood risk No data
- FEMA flood zone
- —
- Chance of flooding over 30 yrs
- —
- Est. flood insurance / yr
- —
Fire risk No data
- Est. fire insurance / yr
- —
Heat risk No data
- Hot days now (above threshold)
- —
- Hot days in 30 yrs
- —
Wind risk No data
- Chance of severe wind over 30 yrs
- —
Air-quality risk No data
- Unhealthy air days now
- —
- Unhealthy air days in 30 yrs
- —
Risk factors via First Street. Map © Google.
Why this score? — see what drove the D- grade
The composite is a weighted blend of 9 inputs, each scored 0–100. Each bar is that input's sub-score; the figure is the points it added to the 100-point composite (weight × sub-score).
- Cash flow +11.3/30.0
- ARV discount +7.5/15.0
- Schools +5.2/10.0
- Livability +3.7/5.0
- 1% rule +3.3/10.0
- DSCR +3.3/10.0
- Rent growth +2.5/5.0
- Condition / age +2.5/5.0
- Appreciation +0.0/10.0
$324,900
🖨 Deal sheet (PDF) 📄 Offer letter ✓ Due diligence
Listing remarks
Some images shown may be from a previously built Stylecraft home of similar design. Actual options, colors, and selections may vary. Contact us for details! This four-bedroom, two bath home is a great option for those looking for more bedrooms without a second story! You won't believe your eyes as you walk into the great space that is the open concept living room, dining room, and kitchen. With all of its wonderful features, to include walk-in closets, granite countertops, and corner kitchen with island, you are sure to love this home!
Key facts
- dining room
- Walk-in closets
- kitchen
Tags
Property features AI
Finance
- Financial info: List price reported (see listing for details)
Exterior
- Parking: 2 parking spaces (includes 2-car garage)
- Utilities: Electric heating and central air
- Home design: Spec new-construction plan named "The 1651"
Interior
- Bedrooms: 4 bedrooms
- Bathrooms: 2 full bathrooms
- Heating & cooling: Electric forced-air heating; Central air conditioning
- Interior features: Living area of 1,654 (as reported)
Neighborhood map
What this means for you Summary
Snapshot
- This is a 4-bed/2.0-bath single-family listed at $325k.
Deal economics
- At list price, monthly cash flow is $-118 ($-1k/yr) — negative.
- To cash-flow at today's rent, offer at most $308k (5.3% below list).
- To meet the 1% rule (rent ≥ 1% of price), the offer needs to be $269k (17.1% below list).
- Recommended offer: $269k (17.1% below list) — sets the bar for 1% rule.
- Cap rate 5.9% vs local median 3.9% in Waco — top-decile yield for the area; either an underpriced asset or a hidden risk that comps aren't pricing in. Stress-test before assuming the spread holds.
Location & tenants
- Location reads 74/100 on livability (#166 in TX, #4,378 nationally) — a middle-class / working-renter tenant base. Strengths: cost of living A+, housing A+, health & safety A+; Watch: crime D, commute F, employment D-.
- Midway ISD (other): math 61% / reading 58% proficiency, ranked #56 of 826 in TX (top 7%) — acceptable for families but not a draw, mixed tenant base, ~2y average lease.
- Zoned schools: Castleman Creek El (math 48% / reading 47%, grade D, #989 of 4,322 statewide, top 23%, 585 students, 51% FRL); Midway Middle (math 58% / reading 58%, grade B, #197 of 1,662 statewide, top 12%, 1,075 students, 47% FRL); Midway H S (math 66% / reading 67%, grade B, #186 of 1,632 statewide, top 11%, 2,648 students, 32% FRL) — zoned schools average 43% FRL vs 28% district-wide (16 pts higher); higher-poverty schools than district average — tighter screening recommended.
- Market conditions: 269 active listings in the ZIP; 8 comparable units currently listed for rent nearby; rentals lingering (median 46d on market — plan ~5-8 weeks vacancy on turnover, expect pricing pressure); 75% of comp listings sitting > 30 days — soft ceiling on asking rent; solid renter incomes; 1,014 units permitted in McLennan County in 2024 (200 in 5+ unit buildings).
- This rent runs 32% of the median local income ($100k/yr) — at the standard rent-burdened threshold; future hikes will face affordability resistance.
Forward outlook
- Local home prices are declining (-3.0%/yr); year-one equity from $2k of loan paydown is wiped out by about $10k of value loss. Plan a longer hold.
- McLennan County population projected at +17% by 2050 — long-run rental-demand tailwind backs the buy-and-hold thesis.
Negotiation context
- Only 9 days on market — expect competitive offers; lowballing is unlikely to land.
Questions for the listing agent
- What do current leases actually rent for vs. the listed asking? Can we see a recent rent roll and the last 12 months of T-12 income?
- Is there a deadline driving the sale (1031 exchange, divorce, estate, relocation)? That informs how much negotiation room exists.
- Schools are D-rated, which usually means shorter tenancies and higher turnover. Who's the typical renter profile here, and what's been the actual vacancy rate?
- Crime grade is D in this area — have there been break-ins, vandalism, or insurance claims at this property in the last 3 years? What carrier currently insures it and at what premium?
- The area grade is low — what's the realistic commute time and amenity access for the typical tenant pool here? Any planned neighborhood developments (good or bad) we should know about?
- What's the average days-on-market for RENTAL listings here right now (not sales)? A rising rental-DOM trend means longer vacancies and softer asking-rent achievability than the comps imply.
- What's the recent tenant-quality profile in this submarket — average credit score on applications, eviction rate, late-payment / NSF rate, and stable-employment percentage? A property-management company in the area should have these aggregated.
- How much new for-sale + rental construction is in the pipeline within 1–3 miles? Heavy new supply typically softens prices + rents 12–24 months out; constrained supply supports both.
Investment metrics
- 1% rule
- 0.83% ✗
- Cap rate
- 5.86%
- Cash-on-cash
- -1.56%
- DSCR
- 0.93
- GRM
- 10.1
CMA / ARV
No comps found within radius.
Projected returns pro-forma
-3.0% appreciation · 3.0% rent growth · sell at horizon
- IRR
- -18.9%
- Equity multiple
- 0.34×
- Total profit
- $-60,147
- Equity at exit
- $48,444
- IRR
- -11.3%
- Equity multiple
- 0.32×
- Total profit
- $-61,918
- Equity at exit
- $28,091
Cash invested: $90,972 (down + closing). Projections, not guarantees.
Landlord ↔ Tenant lean methodology
- Overall (STATE)
- 87 Strongly Landlord-Friendly
- State Texas
- 87 Strongly Landlord-Friendly · R+5
- County
- — inherits STATE
- City
- — inherits STATE
ZIP-level market 76655
- Home prices YoY
- -31.3%
- Active inventory
- 269
- Price-to-rent
- 10.1×
Monthly cashflow live
- Estimated rent
- $2,692 high interval (Pro) →
- Mortgage (P&I)
- −$1,704
- Tax est. 1.5%
- −$406 /mo · $4,874/yr
- Insurance
- −$135
- HOA
- −$0
- Vacancy / Maint / Mgmt
- −$565
- Net cashflow
- $-118
Break-even live
Sensitivity live
| Price | -10% $106 | -5% $-6 | +0% $-118 | +5% $-231 | +10% $-343 |
|---|---|---|---|---|---|
| Rent | -10% $-331 | -5% $-225 | +0% $-118 | +5% $-12 | +10% $94 |
| Rate | -1.0pp $45 | -0.5pp $-36 | base $-118 | +0.5pp $-203 | +1.0pp $-288 |
UW: 25.0% down · 7.5% · 30yr · 1.5% tax · 5.0% vac · 8.0% maint · 8.0% mgmt
Financing live
Cash to close
- Down payment
- $81,225
- Closing costs
- $9,747
- Reserves months
- —
- Total cash needed
- —
Loan-product check · same deal, 3 products live
Conventional
25% down · 7.5% · 30yr
- Down + closing
- —
- Monthly P&I
- —
- Monthly cashflow
- —
- DSCR
- —
- Eligible?
- —
Personal DTI + credit; lowest rate.
DSCR
20% down · 8.5% · 30yr
- Down + closing
- —
- Monthly P&I
- —
- Monthly cashflow
- —
- DSCR
- —
- Eligible?
- —
No personal income docs; deal must DSCR.
Hard money
10% down · 12.0% · 12mo
- Down + closing
- —
- Monthly P&I
- —
- Monthly cashflow
- —
- DSCR
- —
- Eligible?
- —
Short-term bridge; refi at stabilization.
Rent comps 8 comps
| Address | Beds | Baths | Sqft | Rent | $/sqft | DOM | Units | Dist |
|---|---|---|---|---|---|---|---|---|
| 3225 Marston Rd Lorena, TX | 4.0 | 2.0 | 1850 | $2,800 | $1.51 | 45d | 1 | 0.55mi |
| 3217 Jackal Dr Lorena, TX | 4.0 | 2.0 | 1840 | $2,400 | $1.30 | 23d | 1 | 0.55mi |
| 3128 Brosnan Rd Lorena, TX | 3.0 | 2.0 | 1717 | $2,350 | $1.37 | 45d | 1 | 0.65mi |
| 3117 Sherco Rd Lorena, TX | 3.0 | 2.0 | 1469 | $2,000 | $1.36 | 45d | 1 | 0.74mi |
| 2809 Keathley Dr Lorena, TX | 3.0 | 2.0 | 1565 | $2,100 | $1.34 | 45d | 1 | 0.87mi |
| 2813 Gilchrist Dr Lorena, TX | 3.0 | 2.0 | 1529 | $2,200 | $1.44 | 45d | 1 | 0.90mi |
| 2701 Skinner Dr Lorena, TX | 3.0 | 2.0 | 1573 | $2,400 | $1.53 | 45d | 1 | 1.04mi |
| 10312 Sierra West Dr Waco, TX | 3.0 | 2.0 | 1560 | $2,300 | $1.47 | 23d | 1 | 1.25mi |
Listing history 9 events
-
2026-06-21days on market $324,900 Active 9 DOM
-
2026-06-21days on market $324,900 Active 8 DOM
-
2026-06-18days on market $324,900 Active 6 DOM
-
2026-06-17days on market $324,900 Active 5 DOM
-
2026-06-16days on market $324,900 Active 4 DOM
-
2026-06-15days on market $324,900 Active 3 DOM
-
2026-06-15days on market $324,900 Active 2 DOM
-
2026-06-12remarks 541-char remark
-
2026-06-12$324,900 Active 1 DOM
ⓘ Source: listings_history table (triggers on properties + properties_extension) + one-shot
backfill from property_details.listing_events for pre-trigger history.
Nearby sold comps map
Loading sold comps map…
Walkable amenities ~0.75 mi
Loading nearby amenities…
Taxation est. · year 1
- Rental income
- $32,308
- − Mortgage interest
- −$18,199
- − Property taxes
- −$4,874
- − Insurance
- −$1,624
- − Repairs & maintenance
- −$2,585
- − Management
- −$2,585
- − Depreciation
- −$9,452
- Taxable loss
- −$7,011
- Est. tax savings @ 24.0%
- +$1,683
- After-tax cash flow
- $262/yr
For passive investors: Depreciation is non-cash, so a rental often shows a tax loss while cash-flowing — sheltering income. Rental losses are passive: they offset passive income freely, and up to $25,000/yr can offset ordinary (W-2) income if you actively participate and your MAGI is under $100k (phasing out to $0 by $150k); unused losses carry forward. On sale, claimed depreciation is recaptured at up to 25%, and gains may owe capital-gains tax (a 1031 exchange can defer both). Figures are a year-1 estimate at your 24.0% rate — not tax advice; consult a CPA.
Schools (NCES district)
- District
- Midway ISD
- NCES district ID
- 4830640
- Math proficiency
- 61% ▼ -8.00%
- Reading proficiency
- 58% ▼ -7.00%
- Median HH income
- $67,076
- Composite
- 52.32/100
- National rank
- #1593
- State rank
- #56 of 826 in TX
Livability — Waco
- Score
- 74/100
- State rank
- #166
- US rank
- #4378
Category grades
Schools grade is shown separately in the Schools card above.
Census & demographics
- Census place
- Waco, TX
- County
- McLennan County · 213,088 people
- City population
- 125,319
- Metro
- Waco, TX
- Population (ZIP)
- 10,603
- Household income
- $99,917
- Rent vs Own
- Severe rent burden
- 62.0
Population outlook (McLennan County) Hauer SSP2
- Today (2025)
- 264,191 people
- By 2030
- 273,578 · +3.6%
- By 2040
- 291,506 · +10.3%
- By 2050
- 308,044 · +16.6%
- By 2075
- 349,648 · +32.3%
- By 2100
- 364,779 · +38.1%
Race, ethnicity, and origin ACS 2023
- Neighborhood character
- Predominantly White (76%)
- Race & ethnicity
- White 76% Hispanic / Latino 17% Two or more races 12% Black 3%
- Hispanic origin (detail)
- Mexican 14%
- Common ancestry
- Lithuanian 3% Slovak 3% Serbian 2%
- Foreign-born
- 2% · Canada
- Languages at home
- 93% English-only · Spanish 5% Arabic 2%
Political lean MEDSL · McLennan
- 2024 margin
- Solid R (+30.9) · D 34.0% · R 64.9% · Other 1.0%
- 2008→2024 swing
- -7.0pp toward R · 2008: -23.9pp · 2024: -30.9pp
- All cycles
- 2024: R+30.9 2020: R+23.4 2016: R+27.1 2012: R+29.8 2008: R+23.9
Not yet ingested
- Civics
- —
Market trends
- HPI YoY
- ▼ -105.10%
- Current HPI
- 230.4333
- Rent YoY
- —
- Metro
- Waco, TX
- State GDP YoY
- ▲ 3.95%
- F500 in state
- 110
Industry mix (Fortune 500 HQ in TX)
| Industry | F500 HQs | Revenue |
|---|---|---|
| Energy | 16 | $1,198B |
|
||
| Technology | 5 | $198B |
|
||
| Engineering / Construction | 4 | $72B |
|
||
| Energy Services | 3 | $60B |
|
||
| Utilities | 3 | $41B |
|
||
| Healthcare | 2 | $330B |
|
||
Cash-flow waterfall
monthlySold comps — $/sqft
last 12 mo · ≤1 miLoading sold comps…