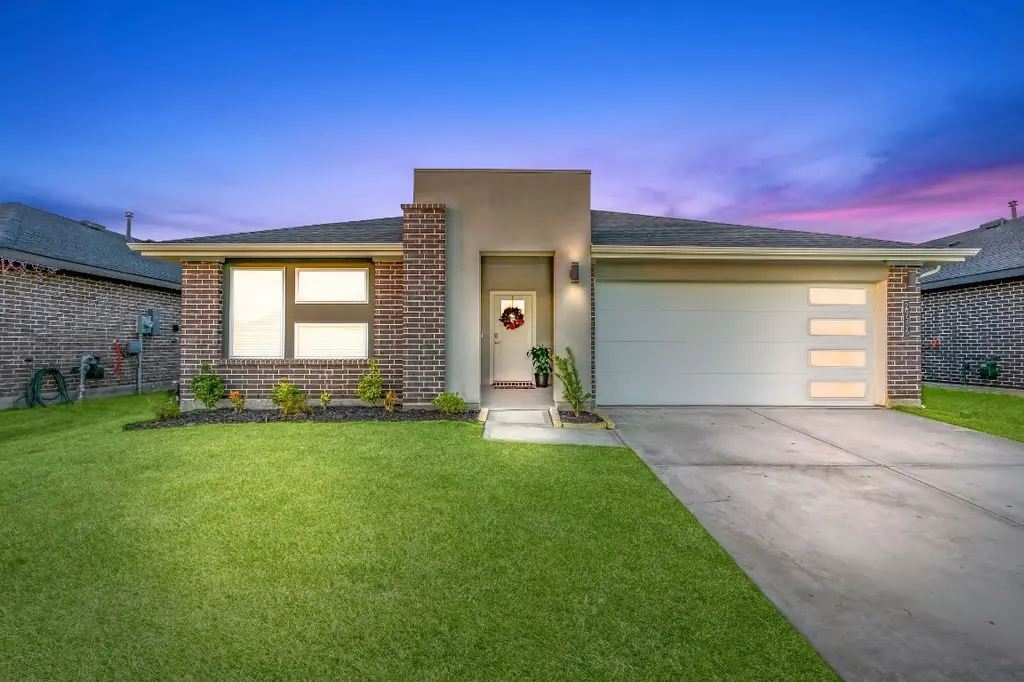
29506 Gordon Sevilla St · Fulshear, TX
Flood risk 3/10 · Minor
- FEMA flood zone
- X (unshaded)
- Chance of flooding over 30 yrs
- 0.2%
- Est. flood insurance / yr
- $507 – $1,088
Fire risk 4/10 · Minor
- Est. fire insurance / yr
- $1,222 – $2,270
Heat risk 8/10 · Major
- Hot days now (above 110°F)
- 7 days/yr
- Hot days in 30 yrs
- 21 days/yr
Wind risk 9/10 · Severe
- Chance of severe wind over 30 yrs
- 99.0%
Air-quality risk 2/10 · Minimal
- Unhealthy air days now
- 1 days/yr
- Unhealthy air days in 30 yrs
- 1 days/yr
Risk factors via First Street. Map © Google.
Why this score? — see what drove the D grade
The composite is a weighted blend of 9 inputs, each scored 0–100. Each bar is that input's sub-score; the figure is the points it added to the 100-point composite (weight × sub-score).
- ARV discount +14.6/15.0
- Cash flow +7.4/30.0
- Schools +4.6/10.0
- 1% rule +4.4/10.0
- Condition / age +4.0/5.0
- Livability +3.5/5.0
- DSCR +1.6/10.0
- Rent growth +1.6/5.0
- Appreciation +0.0/10.0
$290,000
🖨 Deal sheet (PDF) 📄 Offer letter ✓ Due diligence
Listing remarks MLS
Walking distance from the elementary school, tennis courts and park. Highly demanded Kingstone floorplan. This one-story home features 4 bedrooms, 2 baths, and 2 car garage. The entry opens to the guest bedrooms, a bath with a linen closet. The Center kitchen with beautiful countertops and stainless steel appliances that all convey with the property. The open-concept floorplan boasts a large combined family room and dining area. The primary suite features a sloped ceiling and an spacious master bath with dual vanities and a walk-in closet. The back yard features a covered patio.
Key facts
- Tennis courts
- Center kitchen
- Park
Tags
Neighborhood map
What this means for you Summary
Snapshot
- This is a 4-bed/2.0-bath single-family listed at $290k. Condition is rated good.
Deal economics
- At list price, monthly cash flow is $-372 ($-4k/yr) — negative.
- To cash-flow at today's rent, offer at most $224k (22.7% below list).
- To meet the 1% rule (rent ≥ 1% of price), the offer needs to be $274k (5.7% below list).
- Recommended offer: $224k (22.7% below list) — sets the bar for cash-flow.
- Cap rate 4.8% vs local median 3.2% in Fulshear — top-decile yield for the area; either an underpriced asset or a hidden risk that comps aren't pricing in. Stress-test before assuming the spread holds.
Location & tenants
- Location reads 69/100 on livability (#430 in TX) — a middle-class / working-renter tenant base. Strengths: crime A+, employment A+, housing A+; Watch: amenities F, commute F, cost of living F.
- Lamar CISD (suburban): math 50% / reading 53% proficiency, ranked #116 of 826 in TX (top 14%) — acceptable for families but not a draw, mixed tenant base, ~2y average lease.
- Zoned schools: Huggins El (math 61% / reading 63%, grade B, #321 of 4,322 statewide, top 8%, 893 students, 23% FRL); Briscoe J H (math 59% / reading 60%, grade B, #166 of 1,662 statewide, top 11%, 1,914 students, 38% FRL); Foster H S (math 64% / reading 74%, grade B, #141 of 1,632 statewide, top 9%, 2,388 students, 34% FRL).
- Zoned-school proficiency averages 64% at this address vs 52% district-wide (+12 pts) — the actual schools serving this property are materially stronger than the Lamar CISD average implies; a family-tenant draw the district grade alone would hide.
- Market conditions: Rents falling (-3.5%/yr); 1037 active listings in the ZIP; 13 comparable units currently listed for rent nearby; rentals at typical pace (median 15d on market — plan ~3-4 weeks tenant-placement turnaround); high-income renter base; 12,093 units permitted in Fort Bend County in 2024 (815 in 5+ unit buildings).
Forward outlook
- Local home prices are declining (-3.0%/yr); year-one equity from $2k of loan paydown is wiped out by about $9k of value loss. Plan a longer hold.
- Fort Bend County population projected at +75% by 2050 — long-run rental-demand tailwind backs the buy-and-hold thesis.
Negotiation context
- It's been on market 122 days — a 12% lower offer ($255k) is reasonable based on typical stale-listing flexibility.
- 6 sale attempts since 3y ago; this cycle's ask is 11983% above the opening price — seller raised mid-cycle; expect resistance to lowballs.
Risks & watch-outs
- Watch-outs: property tax is 3.2% of price.
- Climate carrying-cost: severe wind risk, 99% chance of damaging wind over 30y; extreme-heat days projected 7→21/yr by 2055 (HVAC capex compounding) — expect insurance premiums to compound above CPI over the hold.
Questions for the listing agent
- What do current leases actually rent for vs. the listed asking? Can we see a recent rent roll and the last 12 months of T-12 income?
- It's been on market 122 days. Have you received any prior offers? Is the seller open to a 23% concession, seller financing, or rate buy-down credit?
- Property tax is high relative to price — has the assessment been appealed recently, and will the sale trigger a re-assessment?
- What does the HOA fee cover, when was the last increase, and are there any pending special assessments or reserve-fund shortfalls?
- Why hasn't it sold? Are there any deal-killer items the seller is aware of (foundation, flood, title, zoning, code violations)?
- Is there a deadline driving the sale (1031 exchange, divorce, estate, relocation)? That informs how much negotiation room exists.
- Schools are A-rated — typically a magnet for longer-tenancy family renters. What's the average tenant stay here, and is there a school-zone premium baked into asking?
- The area grade is low — what's the realistic commute time and amenity access for the typical tenant pool here? Any planned neighborhood developments (good or bad) we should know about?
- What's the average days-on-market for RENTAL listings here right now (not sales)? A rising rental-DOM trend means longer vacancies and softer asking-rent achievability than the comps imply.
- What's the recent tenant-quality profile in this submarket — average credit score on applications, eviction rate, late-payment / NSF rate, and stable-employment percentage? A property-management company in the area should have these aggregated.
- How much new for-sale + rental construction is in the pipeline within 1–3 miles? Heavy new supply typically softens prices + rents 12–24 months out; constrained supply supports both.
Investment metrics
- 1% rule
- 0.94% ✗
- Cap rate
- 4.75%
- Cash-on-cash
- -5.50%
- DSCR
- 0.76
- GRM
- 8.8
CMA / ARV
- ARV (median comp)
- $344,156
- List price
- $290,000
- Delta
- -15.74%
- Verdict
- UNDERPRICED
- Comps
- 20 within 1.0 mi
Show comp detail 12 sales within ~0.75 mi
| Address | Dist | Beds/Ba | Sqft | Sold | Price | $/sf | Match |
|---|---|---|---|---|---|---|---|
| 3814 Lila Lake Ln | 0.27mi | 4/2.0 | 1,824 (-12%) | 2mo | $300,000 | $164 | 65 |
| 30115 Broeder Way Ct | 0.68mi | 4/2.5 | 2,042 (-2%) | 0mo | $314,990 | $154 | 63 |
| 3614 Turnpike Dr | 0.66mi | 4/2.5 | 2,042 (-2%) | 2mo | $322,990 | $158 | 62 |
| 3622 Marino Mile Dr | 0.74mi | 4/2.5 | 2,042 (-2%) | 2mo | $314,990 | $154 | 59 |
| 3722 Daintree Park Ct | 0.41mi | 3/2.0 (-1) | 1,844 (-11%) | 1mo | $325,000 | $176 | 56 |
| 3618 Turnpike Dr | 0.66mi | 4/3.0 | 2,251 (+8%) | 2mo | $328,990 | $146 | 50 |
| 3802 Turnpike Dr | 0.69mi | 4/3.0 | 2,251 (+8%) | 2mo | $334,990 | $149 | 48 |
| 3602 Marino Mile Dr | 0.74mi | 4/3.0 | 2,251 (+8%) | 2mo | $319,990 | $142 | 46 |
| 3642 Marino Mile Dr | 0.74mi | 4/3.0 | 2,251 (+8%) | 2mo | $324,990 | $144 | 46 |
| 3703 Turnpike Dr | 0.64mi | 4/2.0 | 1,778 (-15%) | 2mo | $314,990 | $177 | 44 |
| 3622 Turnpike Dr | 0.66mi | 4/2.0 | 1,778 (-15%) | 1mo | $304,990 | $172 | 44 |
| 30118 Honey Hill Ct | 0.68mi | 4/2.0 | 1,778 (-15%) | 1mo | $314,990 | $177 | 43 |
Match score weights: distance 35% · size 25% · config 20% · recency 20%. Top-matched comps best support the ARV.
Projected returns pro-forma
-3.0% appreciation · 0.0% rent growth · sell at horizon
- IRR
- -30.0%
- Equity multiple
- 0.04×
- Total profit
- $-78,349
- Equity at exit
- $43,240
- IRR
- -59.2%
- Equity multiple
- -0.58×
- Total profit
- $-128,244
- Equity at exit
- $25,074
Cash invested: $81,200 (down + closing). Projections, not guarantees.
Landlord ↔ Tenant lean methodology
- Overall (STATE)
- 87 Strongly Landlord-Friendly
- State Texas
- 87 Strongly Landlord-Friendly · R+5
- County
- — inherits STATE
- City
- — inherits STATE
ZIP-level market 77494
- Home prices YoY
- -32.5%
- Rents YoY
- -3.5%
- Active inventory
- 1037
- Price-to-rent
- 8.8×
Monthly cashflow live
- Estimated rent
- $2,735 high interval (Pro) →
- Mortgage (P&I)
- −$1,521
- Tax from tax record
- −$767 /mo · $9,200/yr
- Insurance
- −$121
- HOA
- −$125
- Vacancy / Maint / Mgmt
- −$574
- Net cashflow
- $-372
Break-even live
Sensitivity live
| Price | -10% $-208 | -5% $-290 | +0% $-372 | +5% $-454 | +10% $-536 |
|---|---|---|---|---|---|
| Rent | -10% $-588 | -5% $-480 | +0% $-372 | +5% $-264 | +10% $-156 |
| Rate | -1.0pp $-226 | -0.5pp $-298 | base $-372 | +0.5pp $-447 | +1.0pp $-524 |
UW: 25.0% down · 7.5% · 30yr · 1.5% tax · 5.0% vac · 8.0% maint · 8.0% mgmt
Financing live
Cash to close
- Down payment
- $72,500
- Closing costs
- $8,700
- Reserves months
- —
- Total cash needed
- —
Loan-product check · same deal, 3 products live
Conventional
25% down · 7.5% · 30yr
- Down + closing
- —
- Monthly P&I
- —
- Monthly cashflow
- —
- DSCR
- —
- Eligible?
- —
Personal DTI + credit; lowest rate.
DSCR
20% down · 8.5% · 30yr
- Down + closing
- —
- Monthly P&I
- —
- Monthly cashflow
- —
- DSCR
- —
- Eligible?
- —
No personal income docs; deal must DSCR.
Hard money
10% down · 12.0% · 12mo
- Down + closing
- —
- Monthly P&I
- —
- Monthly cashflow
- —
- DSCR
- —
- Eligible?
- —
Short-term bridge; refi at stabilization.
Rent comps 13 comps
| Address | Beds | Baths | Sqft | Rent | $/sqft | DOM | Units | Dist |
|---|---|---|---|---|---|---|---|---|
| 29418 Sydney Stone Ln Katy, TX | 4.0 | 3.0 | 2571 | $3,490 | $1.36 | 45d | 1 | 0.21mi |
| 3711 Daintree Park Dr Katy, TX | 3.0 | 2.0 | 1892 | $2,101 | $1.11 | 21d | 1 | 0.53mi |
| 29403 Cayman Canyon Way Katy, TX | 3.0–5.0 | 2.0 | 1679 | $2,292 | $1.37 | 3d | 17 | 0.65mi |
| 4015 Prairie Landing Ln Katy, TX | 4.0 | 3.5 | 2853 | $2,850 | $1.00 | 45d | 1 | 0.79mi |
| 29202 Jarvis Bay Pass Katy, TX | 4.0 | 2.0 | 1563 | $2,200 | $1.41 | 7d | 1 | 0.84mi |
| 29018 Innes Park Pl Katy, TX | 4.0 | 2.5 | 2855 | $2,266 | $0.79 | 14d | 1 | 1.00mi |
| 30131 Ousel Falls Ln Brookshire, TX | 3.0 | 2.0 | 1574 | $2,150 | $1.37 | 45d | 1 | 1.00mi |
| 30375 Centipede Grove Ln Brookshire, TX | 4.0 | 3.0 | 2400 | $2,900 | $1.21 | 45d | 1 | 1.03mi |
| 3551 Shearwater St Katy, TX | 4.0 | 2.5 | 2054 | $2,500 | $1.22 | 45d | 1 | 1.24mi |
| 3714 Sloane Peak Ln Fulshear, TX | 3.0–4.0 | 2.0–2.5 | 1713 | $2,397 | $1.40 | 0d | 24 | 1.25mi |
| 3702 Mirabeau Dr Katy, TX | 2.0–4.0 | 2.5 | 1875 | $3,776 | $2.01 | 0d | 1 | 1.36mi |
| 29655 Jordan Crossing Blvd Brookshire, TX | 1.0–3.0 | 1.0–2.0 | 1044 | $2,434 | $2.33 | 0d | 29 | 1.40mi |
| 4623 Cold Stream Ct Fulshear, TX | 3.0 | 3.0 | 2646 | $3,100 | $1.17 | 7d | 1 | 1.43mi |
HOA detail
- Monthly dues
- $125 · $1,500/yr
Listing history 28 events
-
2026-06-21days on market $290,000 Active 122 DOM
-
2026-06-18days on market $290,000 Active 119 DOM
-
2026-06-17days on market $290,000 Active 118 DOM
-
2026-06-16days on market $290,000 Active 117 DOM
-
2026-06-15days on market $290,000 Active 116 DOM
-
2026-06-13days on market $290,000 Active 114 DOM
-
2026-06-10days on market $290,000 Active 111 DOM
-
2026-06-08days on market $290,000 Active 110 DOM
-
2026-06-07days on market $290,000 Active 109 DOM
-
2026-06-04days on market $290,000 Active 106 DOM
-
2026-06-03days on market $290,000 Active 105 DOM
-
2026-06-02days on market $290,000 Active 104 DOM
-
2026-06-01days on market $290,000 Active 103 DOM
-
2026-05-31days on market $290,000 Active 102 DOM
-
2026-04-20price $290,000 585-char remark
Show marketing remark (585 chars)
Walking distance from the elementary school, tennis courts and park. Highly demanded Kingstone floorplan. This one-story home features 4 bedrooms, 2 baths, and 2 car garage. The entry opens to the guest bedrooms, a bath with a linen closet. The Center kitchen with beautiful countertops and stainless steel appliances that all convey with the property. The open-concept floorplan boasts a large combined family room and dining area. The primary suite features a sloped ceiling and an spacious master bath with dual vanities and a walk-in closet. The back yard features a covered patio.
-
2026-03-13historical $2,400
-
2026-02-19$2,400
-
2026-02-18$339,990 Active 585-char remark
Show marketing remark (585 chars)
Walking distance from the elementary school, tennis courts and park. Highly demanded Kingstone floorplan. This one-story home features 4 bedrooms, 2 baths, and 2 car garage. The entry opens to the guest bedrooms, a bath with a linen closet. The Center kitchen with beautiful countertops and stainless steel appliances that all convey with the property. The open-concept floorplan boasts a large combined family room and dining area. The primary suite features a sloped ceiling and an spacious master bath with dual vanities and a walk-in closet. The back yard features a covered patio.
-
2024-09-03historical $2,380
-
2024-09-02historical
-
2024-08-29price $2,380
-
2024-08-14status Active
-
2024-08-10historical
-
2024-08-09price $349,000
-
2024-07-11$360,000 Active
-
2024-06-09$2,600
-
2024-02-02historical $2,800
-
2023-12-16$2,800
ⓘ Source: listings_history table (triggers on properties + properties_extension) + one-shot
backfill from property_details.listing_events for pre-trigger history.
Tax reassessment forecast TX · Resets to sale price
- Current annual tax
- $9,200 · $767/mo
- Projected year-2 tax
- $9,200 · $767/mo
- Expected delta
- $0/yr ($0/mo · 0.0%)
ⓘ Screening estimate from a state-policy table — verify with the county assessor before closing.
Climate risk First Street
- Flood 3/10 Moderate FEMA zone X (unshaded) · 20% chance over 30 yrs
- Wildfire 4/10 Moderate
- Heat 8/10 Severe 7 d/yr ≥110°F today · 21 d/yr by 30 yrs out
- Wind 9/10 Extreme 99% chance of damaging wind over 30 yrs
- Air quality 2/10 Low 1 unhealthy d/yr today · 1 by 30 yrs out
Nearby sold comps map
Loading sold comps map…
Walkable amenities ~0.75 mi
Loading nearby amenities…
Taxation est. · year 1
- Rental income
- $32,826
- − Mortgage interest
- −$16,245
- − Property taxes
- −$9,200
- − Insurance
- −$1,450
- − Repairs & maintenance
- −$2,626
- − Management
- −$2,626
- − HOA
- −$1,500
- − Depreciation
- −$8,436
- Taxable loss
- −$9,257
- Est. tax savings @ 24.0%
- +$2,222
- After-tax cash flow
- $-2,245/yr
For passive investors: Depreciation is non-cash, so a rental often shows a tax loss while cash-flowing — sheltering income. Rental losses are passive: they offset passive income freely, and up to $25,000/yr can offset ordinary (W-2) income if you actively participate and your MAGI is under $100k (phasing out to $0 by $150k); unused losses carry forward. On sale, claimed depreciation is recaptured at up to 25%, and gains may owe capital-gains tax (a 1031 exchange can defer both). Figures are a year-1 estimate at your 24.0% rate — not tax advice; consult a CPA.
Condition & rehab AI · 6 photos
This single-family home in Katy, TX, is in good condition with a modern kitchen and bathrooms. It's well-maintained and ready for a new owner, with minor cosmetic improvements that could further enhance its value.
Value-add opportunities
- Both Paint exterior walls — Enhances curb appeal and can increase both resale and rental value.
- Both Clean gutters — Improves drainage and can prevent water damage, enhancing both resale and rental value.
Renovation cost estimate screening
Value-add ROI direction
- Both Paint exterior walls — Enhances curb appeal and can increase both resale and rental value. ↑
- Both Clean gutters — Improves drainage and can prevent water damage, enhancing both resale and rental value. ↑
ⓘ Cost ranges are severity-bucket heuristics (US national rule-of-thumb). Get contractor quotes + a written scope before underwriting a rehab budget.
Schools (NCES district)
- District
- Lamar CISD
- NCES district ID
- 4826580
- Math proficiency
- 50% ▼ -12.00%
- Reading proficiency
- 53% ▼ -4.00%
- Median HH income
- $75,213
- Composite
- 46.43/100
- National rank
- #2452
- State rank
- #116 of 826 in TX
Livability — Fulshear
- Score
- 69/100
- State rank
- #430
- US rank
- #8901
Category grades
Schools grade is shown separately in the Schools card above.
Census & demographics
- County
- Fort Bend County · 836,777 people
- City population
- 41,324
- Metro
- Houston-The Woodlands-Sugar Land, TX
- Population (ZIP)
- 140,157
- Household income
- $148,720
- Rent vs Own
- Severe rent burden
- 3390.0
Population outlook (Fort Bend County) Hauer SSP2
- Today (2025)
- 1,004,526 people
- By 2030
- 1,153,104 · +14.8%
- By 2040
- 1,453,718 · +44.7%
- By 2050
- 1,753,781 · +74.6%
- By 2075
- 2,455,772 · +144.5%
- By 2100
- 2,930,528 · +191.7%
Race, ethnicity, and origin ACS 2023
- Neighborhood character
- Highly diverse neighborhood (Simpson 0.73)
- Race & ethnicity
- White 39% Hispanic / Latino 25% Asian 24% Two or more races 18% Black 8%
- Hispanic origin (detail)
- Mexican 8% Cuban 1%
- Common ancestry
- Romanian 2% Lithuanian 2% Italian 2%
- Foreign-born
- 39% · Canada, China, Vietnam
- Languages at home
- 54% English-only · Spanish 20% Other Indo-European 8% Other Asian/Pacific 5%
Political lean MEDSL · Fort Bend
- 2024 margin
- Toss-up / Even · D 49.5% · R 47.9% · Other 2.6%
- 2008→2024 swing
- +4.0pp toward D · 2008: -2.4pp · 2024: 1.6pp
- All cycles
- 2024: D+1.6 2020: D+10.6 2016: D+6.6 2012: R+6.8 2008: R+2.4
Not yet ingested
- Civics
- —
Market trends
- HPI YoY
- ▼ -110.62%
- Current HPI
- 229.7189
- Rent YoY
- ▼ -3.53%
- Metro
- Houston-The Woodlands-Sugar Land, TX
- State GDP YoY
- ▲ 3.95%
- F500 in state
- 110
Industry mix (Fortune 500 HQ in TX)
| Industry | F500 HQs | Revenue |
|---|---|---|
| Energy | 16 | $1,198B |
|
||
| Technology | 5 | $198B |
|
||
| Engineering / Construction | 4 | $72B |
|
||
| Energy Services | 3 | $60B |
|
||
| Utilities | 3 | $41B |
|
||
| Healthcare | 2 | $330B |
|
||
Price history
+10257.1% since first listed14 events — show timeline
- 2026-04-20 Price Changed $290,000 HARMLS
- 2026-03-13 Rental Removed $2,400 HARMLS
- 2026-02-19 Listed for Rent $2,400 HARMLS
- 2026-02-18 Listed $339,990 HARMLS
- 2024-09-03 Rental Removed $2,380 HARMLS
- 2024-09-02 Listing Removed — HARMLS
- 2024-08-29 Price Changed $2,380 HARMLS
- 2024-08-14 Relisted — HARMLS
- 2024-08-10 Listing Removed — HARMLS
- 2024-08-09 Price Changed $349,000 HARMLS
- 2024-07-11 Listed $360,000 HARMLS
- 2024-06-09 Listed for Rent $2,600 HARMLS
- 2024-02-02 Rental Removed $2,800 HARMLS
- 2023-12-16 Listed for Rent $2,800 HARMLS
Property tax history
+119.5%/yrLatest (2025): $9,200 · -3.5% YoY. Source: county tax records.
Cash-flow waterfall
monthlySold comps — $/sqft
last 12 mo · ≤1 miLoading sold comps…