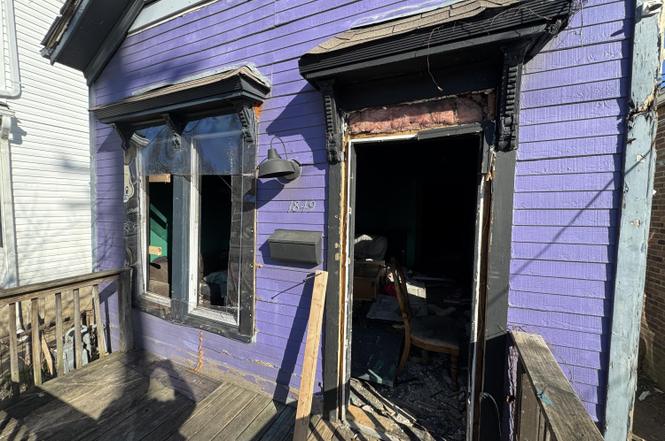
1849 Bank St · Louisville, KY
Flood risk 1/10 · Minimal
- FEMA flood zone
- X (unshaded)
- Chance of flooding over 30 yrs
- 0.0%
- Est. flood insurance / yr
- $507 – $1,088
Fire risk 1/10 · Minimal
- Est. fire insurance / yr
- $839 – $1,559
Heat risk 5/10 · Moderate
- Hot days now (above 105°F)
- 7 days/yr
- Hot days in 30 yrs
- 20 days/yr
Wind risk 2/10 · Minimal
- Chance of severe wind over 30 yrs
- 1.0%
Air-quality risk 2/10 · Minimal
- Unhealthy air days now
- 1 days/yr
- Unhealthy air days in 30 yrs
- 2 days/yr
Risk factors via First Street. Map © Google.
Why this score? — see what drove the D grade
The composite is a weighted blend of 9 inputs, each scored 0–100. Each bar is that input's sub-score; the figure is the points it added to the 100-point composite (weight × sub-score).
- Cash flow +15.0/30.0
- ARV discount +7.5/15.0
- 1% rule +5.0/10.0
- DSCR +5.0/10.0
- Rent growth +3.4/5.0
- Livability +3.2/5.0
- Condition / age +2.5/5.0
- Schools +2.3/10.0
- Appreciation +0.0/10.0
$19,333
🖨 Deal sheet (PDF) 📄 Offer letter ✓ Due diligence
Listing remarks MLS
Looking for a fixer upper or investment property?? This one would make a great home. Potential 4 bedroom home. Seller has done many updates and with a few more you could have a great home here. New roof in 2013, New electric panel approx 2012, new pex piping and heat taped, and more. Call today for your showing.
Key facts
- First floor laundry
- 2,640 sq ft lot
- Built 1900
Tags
Neighborhood map
What this means for you Summary
Snapshot
- This is a 3-bed/1.0-bath single-family listed at $19k.
Deal economics
- At list price, monthly cash flow is $814 ($10k/yr) — positive.
- The deal already cash-flows at list — no discount required.
- Meets the 1% rule at list price ($1k rent vs $19k).
- Cap rate 56.8% vs local median 5.0% in Louisville — top-decile yield for the area; either an underpriced asset or a hidden risk that comps aren't pricing in. Stress-test before assuming the spread holds.
Location & tenants
- Location reads 63/100 on livability (#333 in KY) — a middle-class / working-renter tenant base. Strengths: cost of living A+, housing A+; Watch: employment C-, health & safety D+, schools D-.
- Jefferson County (urban): math 19% / reading 35% proficiency, ranked #121 of 165 in KY (top 73%) — low school quality limits family demand, transient renter base, plan for 1-2y turnover.
- Market conditions: Rents rising (+3.7%/yr); 115 active listings in the ZIP; 15 comparable units currently listed for rent nearby; rentals at typical pace (median 25d on market — plan ~3-4 weeks tenant-placement turnaround); lower-income renter base — watch delinquency; 2,836 units permitted in Jefferson County in 2024 (1,558 in 5+ unit buildings).
- At $1,227/mo this rent would consume 48% of the median local household income ($31k/yr) (locally 1603% of renters already pay >50% of income on rent) — very limited rent-growth headroom before tenants either downsize or default.
Forward outlook
- Local home prices are declining (-3.0%/yr); year-one equity from $134 of loan paydown is wiped out by about $580 of value loss. Plan a longer hold.
- Jefferson County population projected at +13% by 2050 — modest demand growth; plan on rents tracking national, not racing it.
- At projected returns (-3.0% appreciation + 3.7% rent growth), your $5k cash investment doubles in ~1 year — after that, you're playing with house money.
Negotiation context
- Only 8 days on market — expect competitive offers; lowballing is unlikely to land.
- 6 sale attempts since 22y ago with the ask held roughly flat each time — persistent listings suggest the price (not the market) is what's stuck; bring a comps-based counter.
Risks & watch-outs
- Watch-outs: property tax is 2.9% of price; built in 1900 — expect roof / HVAC / electrical / plumbing capex.
- Climate carrying-cost: extreme-heat days projected 7→20/yr by 2055 (HVAC capex compounding) — expect insurance premiums to compound above CPI over the hold.
Questions for the listing agent
- Built in 1900 — when were the roof, HVAC, electrical panel, plumbing, and water heater last replaced?
- Property tax is high relative to price — has the assessment been appealed recently, and will the sale trigger a re-assessment?
- Is there a deadline driving the sale (1031 exchange, divorce, estate, relocation)? That informs how much negotiation room exists.
- Schools are D-rated, which usually means shorter tenancies and higher turnover. Who's the typical renter profile here, and what's been the actual vacancy rate?
- Crime grade is F in this area — have there been break-ins, vandalism, or insurance claims at this property in the last 3 years? What carrier currently insures it and at what premium?
- The area grade is low — what's the realistic commute time and amenity access for the typical tenant pool here? Any planned neighborhood developments (good or bad) we should know about?
- What's the average days-on-market for RENTAL listings here right now (not sales)? A rising rental-DOM trend means longer vacancies and softer asking-rent achievability than the comps imply.
- What's the recent tenant-quality profile in this submarket — average credit score on applications, eviction rate, late-payment / NSF rate, and stable-employment percentage? A property-management company in the area should have these aggregated.
- How much new for-sale + rental construction is in the pipeline within 1–3 miles? Heavy new supply typically softens prices + rents 12–24 months out; constrained supply supports both.
Investment metrics
- 1% rule
- 6.35% ✓
- Cap rate
- 56.80%
- Cash-on-cash
- 180.40%
- DSCR
- 9.03
- GRM
- 1.3
CMA / ARV
- ARV (on-the-fly)
- $106,600
- Comps found
- 12
Show comp detail 12 sales within ~0.75 mi
| Address | Dist | Beds/Ba | Sqft | Sold | Price | $/sf | Match |
|---|---|---|---|---|---|---|---|
| 320 N 18th St | 0.12mi | 3/2.0 | 1,508 (-8%) | 1mo | $147,900 | $98 | 76 |
| 2024 Portland Ave | 0.21mi | 3/1.0 | 1,518 (-7%) | 5mo | $83,750 | $55 | 73 |
| 2429 Griffiths Ave | 0.49mi | 3/2.0 | 1,645 (+0%) | 4mo | $90,000 | $55 | 70 |
| 207 N 19th St | 0.23mi | 3/1.0 | 1,464 (-11%) | 7mo | $60,000 | $41 | 66 |
| 2010 St Xavier St | 0.14mi | 4/1.5 (+1) | 1,780 (+8%) | 11mo | $75,000 | $42 | 63 |
| 1909 Owen St | 0.12mi | 4/2.0 (+1) | 1,496 (-9%) | 15mo | $97,000 | $65 | 59 |
| 2333 Duncan St | 0.48mi | 3/1.0 | 1,480 (-10%) | 5mo | $83,750 | $57 | 57 |
| 1807 Bank St | 0.10mi | 3/1.5 | 1,410 (-14%) | 23mo | $150,000 | $106 | 51 |
| 1924 Rowan St | 0.28mi | 3/2.0 | 1,844 (+12%) | 22mo | $119,900 | $65 | 44 |
| 218 S 25th St | 0.74mi | 3/2.0 | 1,523 (-7%) | 10mo | $130,000 | $85 | 41 |
| 1825 W Muhammad Ali Blvd | 0.71mi | 3/2.5 | 1,817 (+11%) | 6mo | $195,000 | $107 | 38 |
| 2223 Cedar St | 0.71mi | 4/3.0 (+1) | 1,564 (-5%) | 12mo | $190,000 | $121 | 36 |
Match score weights: distance 35% · size 25% · config 20% · recency 20%. Top-matched comps best support the ARV.
Projected returns pro-forma
-3.0% appreciation · 3.73% rent growth · sell at horizon
- IRR
- —
- Equity multiple
- 10.17×
- Total profit
- $49,637
- Equity at exit
- $2,883
- IRR
- —
- Equity multiple
- 22.04×
- Total profit
- $113,873
- Equity at exit
- $1,672
Cash invested: $5,413 (down + closing). Projections, not guarantees.
Landlord ↔ Tenant lean methodology
- Overall (STATE)
- 83 Strongly Landlord-Friendly
- State Kentucky
- 83 Strongly Landlord-Friendly · R+16
- County
- — inherits STATE
- City
- — inherits STATE
ZIP-level market 40203
- Home prices YoY
- -13.8%
- Rents YoY
- 3.7%
- Active inventory
- 115
- Price-to-rent
- 1.3×
Monthly cashflow live
- Estimated rent
- $1,227 high interval (Pro) →
- Mortgage (P&I)
- −$101
- Tax from tax record
- −$46 /mo · $553/yr
- Insurance
- −$8
- HOA
- −$0
- Vacancy / Maint / Mgmt
- −$258
- Net cashflow
- $814
Break-even live
Sensitivity live
| Price | -10% $825 | -5% $819 | +0% $814 | +5% $808 | +10% $803 |
|---|---|---|---|---|---|
| Rent | -10% $717 | -5% $765 | +0% $814 | +5% $862 | +10% $911 |
| Rate | -1.0pp $824 | -0.5pp $819 | base $814 | +0.5pp $809 | +1.0pp $804 |
UW: 25.0% down · 7.5% · 30yr · 1.5% tax · 5.0% vac · 8.0% maint · 8.0% mgmt
Financing live
Cash to close
- Down payment
- $4,833
- Closing costs
- $580
- Reserves months
- —
- Total cash needed
- —
Loan-product check · same deal, 3 products live
Conventional
25% down · 7.5% · 30yr
- Down + closing
- —
- Monthly P&I
- —
- Monthly cashflow
- —
- DSCR
- —
- Eligible?
- —
Personal DTI + credit; lowest rate.
DSCR
20% down · 8.5% · 30yr
- Down + closing
- —
- Monthly P&I
- —
- Monthly cashflow
- —
- DSCR
- —
- Eligible?
- —
No personal income docs; deal must DSCR.
Hard money
10% down · 12.0% · 12mo
- Down + closing
- —
- Monthly P&I
- —
- Monthly cashflow
- —
- DSCR
- —
- Eligible?
- —
Short-term bridge; refi at stabilization.
Rent comps 15 comps
| Address | Beds | Baths | Sqft | Rent | $/sqft | DOM | Units | Dist |
|---|---|---|---|---|---|---|---|---|
| 409 N 20th St Louisville, KY | 3.0 | 1.0 | 1200 | $1,050 | $0.88 | 4d | 1 | 0.11mi |
| 1919 Baird St Louisville, KY | 3.0 | 1.0 | 1500 | $1,100 | $0.73 | 17d | 1 | 0.14mi |
| 120 N 20th St Louisville, KY | 3.0 | 1.5 | 1300 | $1,400 | $1.08 | 25d | 1 | 0.30mi |
| 212 N 25th St Louisville, KY | 3.0 | 1.0 | 1104 | $895 | $0.81 | 25d | 1 | 0.61mi |
| 2508 W Main St Louisville, KY | 3.0 | 1.0 | 1327 | $1,500 | $1.13 | 25d | 1 | 0.69mi |
| 2529 W Main St #2 Louisville, KY | 3.0 | 1.0 | 1404 | $1,200 | $0.85 | 25d | 1 | 0.72mi |
| 2506 Montgomery St Louisville, KY | 3.0 | 2.0 | 1081 | $1,295 | $1.20 | 4d | 4 | 0.75mi |
| 353 N 27th St Louisville, KY | 2.0 | 1.0 | 1100 | $1,100 | $1.00 | 25d | 1 | 0.77mi |
| 2319 W Muhammad Ali Blvd Louisville, KY | 4.0 | 1.0 | 1644 | $1,300 | $0.79 | 17d | 1 | 0.83mi |
| 430 S 24th St Louisville, KY | 3.0 | 1.5 | 1288 | $1,400 | $1.09 | 25d | 1 | 0.85mi |
| 1810 Magazine St Louisville, KY | 3.0 | 1.5 | 1248 | $1,450 | $1.16 | 11d | 1 | 0.97mi |
| 980 W Liberty St Louisville, KY | 1.0–3.0 | 1.0–1.5 | 1026 | $1,535 | $1.50 | 25d | 133 | 1.03mi |
| 2906 Montgomery St Unit B Louisville, KY | 3.0 | 1.0 | 1152 | $1,060 | $0.92 | 25d | 1 | 1.06mi |
| 652 N 29th St Louisville, KY | 3.0 | 1.0 | 1127 | $1,350 | $1.20 | 18d | 1 | 1.07mi |
| 848 S 23rd St Louisville, KY | 3.0 | 1.5 | 1050 | $1,450 | $1.38 | 25d | 1 | 1.42mi |
Listing history 16 events
-
2026-01-15status Pending
-
2026-01-06$19,333 Active
-
2025-07-24price $74,000
-
2025-07-01price $75,000
-
2021-05-26soldstatus $43,900 Closed 313-char remark
Show marketing remark (313 chars)
Looking for a fixer upper or investment property?? This one would make a great home. Potential 4 bedroom home. Seller has done many updates and with a few more you could have a great home here. New roof in 2013, New electric panel approx 2012, new pex piping and heat taped, and more. Call today for your showing.
-
2021-05-24status Pending 313-char remark
Show marketing remark (313 chars)
Looking for a fixer upper or investment property?? This one would make a great home. Potential 4 bedroom home. Seller has done many updates and with a few more you could have a great home here. New roof in 2013, New electric panel approx 2012, new pex piping and heat taped, and more. Call today for your showing.
-
2021-05-17$43,900 Active 313-char remark
Show marketing remark (313 chars)
Looking for a fixer upper or investment property?? This one would make a great home. Potential 4 bedroom home. Seller has done many updates and with a few more you could have a great home here. New roof in 2013, New electric panel approx 2012, new pex piping and heat taped, and more. Call today for your showing.
-
2012-07-13soldstatus $9,000
-
2012-05-02$9,990
-
2008-06-04historical
-
2008-04-23$59,900
-
2005-04-22soldstatus $25,000
-
2005-04-11soldstatus $25,000
-
2004-11-15historical
-
2004-11-15$29,995
-
2004-03-07$39,950
ⓘ Source: listings_history table (triggers on properties + properties_extension) + one-shot
backfill from property_details.listing_events for pre-trigger history.
Tax reassessment forecast KY · Resets to sale price
- Current annual tax
- $553 · $46/mo
- Projected year-2 tax
- $553 · $46/mo
- Expected delta
- $0/yr ($0/mo · 0.0%)
ⓘ Screening estimate from a state-policy table — verify with the county assessor before closing.
Climate risk First Street
- Flood 1/10 Low FEMA zone X (unshaded) · 0% chance over 30 yrs
- Wildfire 1/10 Low
- Heat 5/10 Major 7 d/yr ≥105°F today · 20 d/yr by 30 yrs out
- Wind 2/10 Low 100% chance of damaging wind over 30 yrs
- Air quality 2/10 Low 1 unhealthy d/yr today · 2 by 30 yrs out
Nearby sold comps map
Loading sold comps map…
Walkable amenities ~0.75 mi
Loading nearby amenities…
Taxation est. · year 1
- Rental income
- $14,724
- − Mortgage interest
- −$1,083
- − Property taxes
- −$553
- − Insurance
- −$97
- − Repairs & maintenance
- −$1,178
- − Management
- −$1,178
- − Depreciation
- −$562
- Taxable income
- $10,073
- Est. tax owed @ 24.0%
- −$2,417
- After-tax cash flow
- $7,348/yr
For passive investors: Depreciation is non-cash, so a rental often shows a tax loss while cash-flowing — sheltering income. Rental losses are passive: they offset passive income freely, and up to $25,000/yr can offset ordinary (W-2) income if you actively participate and your MAGI is under $100k (phasing out to $0 by $150k); unused losses carry forward. On sale, claimed depreciation is recaptured at up to 25%, and gains may owe capital-gains tax (a 1031 exchange can defer both). Figures are a year-1 estimate at your 24.0% rate — not tax advice; consult a CPA.
Schools (NCES district)
- District
- Jefferson County
- NCES district ID
- 2102990
- Math proficiency
- 19% ▼ -17.00%
- Reading proficiency
- 35% ▼ -11.00%
- Median HH income
- $47,885
- Composite
- 23.45/100
- National rank
- #7884
- State rank
- #121 of 165 in KY
Livability — Louisville
- Score
- 63/100
- State rank
- #333
- US rank
- #15887
Category grades
Schools grade is shown separately in the Schools card above.
Census & demographics
- Census place
- Louisville, KY
- County
- Jefferson County · 790,184 people
- City population
- 769,292
- Metro
- Louisville/Jefferson County, KY-IN
- Population (ZIP)
- 17,742
- Household income
- $30,794
- Rent vs Own
- Severe rent burden
- 1603.0
Population outlook (Jefferson County) Hauer SSP2
- Today (2025)
- 823,112 people
- By 2030
- 849,343 · +3.2%
- By 2040
- 895,696 · +8.8%
- By 2050
- 933,630 · +13.4%
- By 2075
- 1,028,262 · +24.9%
- By 2100
- 1,072,675 · +30.3%
Race, ethnicity, and origin ACS 2023
- Neighborhood character
- Diverse neighborhood (Simpson 0.56)
- Race & ethnicity
- Black 49% White 44% Two or more races 4% Hispanic / Latino 3%
- Common ancestry
- Slovak 2% Lithuanian 2% Romanian 1%
- Foreign-born
- 3% · Canada
- Languages at home
- 97% English-only · Spanish 2%
Political lean MEDSL · Jefferson
- 2024 margin
- D (+16.6) · D 57.4% · R 40.9% · Other 1.7%
- 2008→2024 swing
- +4.5pp toward D · 2008: 12.0pp · 2024: 16.6pp
- All cycles
- 2024: D+16.6 2020: D+20.1 2016: D+13.3 2012: D+11.1 2008: D+12.0
Not yet ingested
- Civics
- —
Market trends
- HPI YoY
- ▼ -64.74%
- Current HPI
- 405.1872
- Rent YoY
- ▲ 3.73%
- Metro
- Louisville/Jefferson County, KY-IN
- State GDP YoY
- ▲ 1.81%
- F500 in state
- 4
Industry mix (Fortune 500 HQ in KY)
| Industry | F500 HQs | Revenue |
|---|---|---|
| Healthcare | 1 | $118B |
|
||
| Food / Beverage | 1 | $7B |
|
||
Price history
-51.6% since first listed16 events — show timeline
- 2026-01-15 Pending — Metro Search MLS
- 2026-01-06 Listed $19,333 Metro Search MLS
- 2025-07-24 Price Changed $74,000 Metro Search MLS
- 2025-07-01 Price Changed $75,000 Metro Search MLS
- 2021-05-26 Sold (MLS) $43,900 Metro Search MLS
- 2021-05-24 Pending — Metro Search MLS
- 2021-05-17 Listed $43,900 Metro Search MLS
- 2012-07-13 Sold (MLS) $9,000 Metro Search MLS
- 2012-05-02 Listed $9,990 Metro Search MLS
- 2008-06-04 Listing Removed — Metro Search MLS
- 2008-04-23 Listed $59,900 Metro Search MLS
- 2005-04-22 Sold (Public Records) $25,000 Public Records
- 2005-04-11 Sold (MLS) $25,000 Metro Search MLS
- 2004-11-15 Listed $29,995 Metro Search MLS
- 2004-11-15 Listing Removed — Metro Search MLS
- 2004-03-07 Listed $39,950 Metro Search MLS
Property tax history
+12.9%/yrLatest (2025): $553 · -1.9% YoY. Source: county tax records.
Cash-flow waterfall
monthlySold comps — $/sqft
last 12 mo · ≤1 miLoading sold comps…