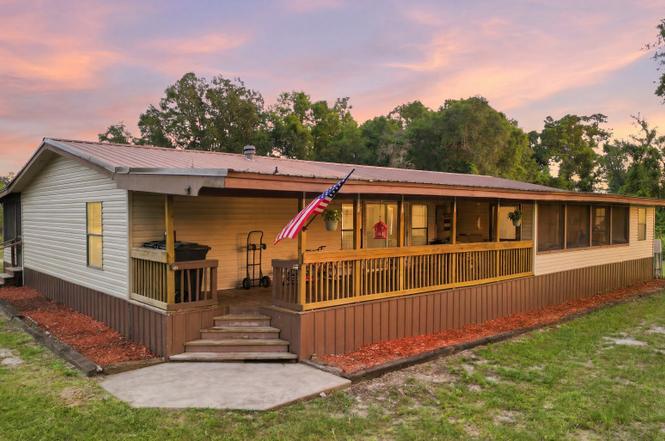
3362 220th Pl · Branford, FL
Flood risk 1/10 · Minimal
- FEMA flood zone
- X (unshaded)
- Chance of flooding over 30 yrs
- 0.0%
- Est. flood insurance / yr
- $507 – $1,088
Fire risk 9/10 · Severe
- Est. fire insurance / yr
- $947 – $1,759
Heat risk 8/10 · Major
- Hot days now (above 108°F)
- 7 days/yr
- Hot days in 30 yrs
- 20 days/yr
Wind risk 9/10 · Severe
- Chance of severe wind over 30 yrs
- 99.0%
Air-quality risk 3/10 · Minor
- Unhealthy air days now
- 3 days/yr
- Unhealthy air days in 30 yrs
- 3 days/yr
Risk factors via First Street. Map © Google.
Why this score? — see what drove the D grade
The composite is a weighted blend of 9 inputs, each scored 0–100. Each bar is that input's sub-score; the figure is the points it added to the 100-point composite (weight × sub-score).
- Appreciation +10.0/10.0
- Cash flow +9.0/30.0
- ARV discount +7.5/15.0
- Schools +3.7/10.0
- Livability +3.1/5.0
- DSCR +2.5/10.0
- Rent growth +2.5/5.0
- Condition / age +2.5/5.0
- 1% rule +1.8/10.0
$269,000
🖨 Deal sheet (PDF) 📄 Offer letter ✓ Due diligence
Listing remarks MLS
Welcome Home! 4 bedroom/2bath doublewide on 5 fenced acres. Wooded with pines, very quiet. Screened front and back porches, new utility room, updated master bath. Door from master leads onto the pool deck. Large open rooms. Bonus room off the living room could be office space, workout room or extra living space! Come take a look!
Key facts
- Private oasis
- Spacious deck
- Screened porches
Tags
Property features AI
Exterior
- Parking: 3-car garage
- Utilities: Private well water
- Home design: Manufactured home; Residential property; Zoned A-1; 5-acre lot (approx.); Lot dimensions roughly 336 x 629
- Construction: Frame construction; Metal roof
- Exterior features: Screened patio/porch; Shed(s); Private maintained road
Interior
- Kitchen: Dishwasher; Electric cooktop; Refrigerator
- Flooring: Laminate; Vinyl
- Bathrooms: 2 full bathrooms
- Heating & cooling: Central heating (electric); Central air; Ceiling fans
- Interior features: Insulated windows
- Laundry & utility: Washer; Dryer
Neighborhood map
What this means for you Summary
Snapshot
- This is a 3-bed/2.0-bath manufactured listed at $269k.
Deal economics
- At list price, monthly cash flow is $-210 ($-3k/yr) — negative.
- To cash-flow at today's rent, offer at most $232k (13.8% below list).
- To meet the 1% rule (rent ≥ 1% of price), the offer needs to be $183k (32.0% below list).
- Recommended offer: $183k (32.0% below list) — sets the bar for 1% rule.
- Cap rate 5.4% vs local median 2.7% in Branford — top-decile yield for the area; either an underpriced asset or a hidden risk that comps aren't pricing in. Stress-test before assuming the spread holds.
Location & tenants
- Location reads 62/100 on livability (#748 in FL) — a middle-class / working-renter tenant base. Strengths: cost of living A+, housing A-; Watch: crime D, amenities F, commute F.
- Suwannee (town): math 45% / reading 44% proficiency, ranked #52 of 73 in FL (top 71%) — families likely to look elsewhere, expect single-tenant / working-renter base with shorter leases.
- Zoned schools: Suwannee Middle School (math 43% / reading 38%, grade F, #360 of 571 statewide, top 64%, 989 students, 64% FRL) — zoned schools at 64% FRL track the district average.
- Market conditions: 206 active listings in the ZIP; 138 units permitted in Suwannee County in 2024 (0 in 5+ unit buildings).
Forward outlook
- In year one you build about $29k of equity ($2k loan paydown + $27k appreciation (10.0% local appreciation)).
- By year 2, paydown + projected appreciation supports a ~$46k cash-out refi (75% LTV) — recoverable capital for the next deal without selling this one.
Negotiation context
- Only 5 days on market — expect competitive offers; lowballing is unlikely to land.
- 2 sale attempts since 10y ago with the ask held roughly flat each time — persistent listings suggest the price (not the market) is what's stuck; bring a comps-based counter.
- Current owner paid $133k; list at $269k implies a 103% gain — meaningful room to come down on a strong offer.
Risks & watch-outs
- Climate carrying-cost: severe wind risk, 99% chance of damaging wind over 30y; severe wildfire risk; extreme-heat days projected 7→20/yr by 2055 (HVAC capex compounding) — expect insurance premiums to compound above CPI over the hold.
Questions for the listing agent
- What do current leases actually rent for vs. the listed asking? Can we see a recent rent roll and the last 12 months of T-12 income?
- Is there a deadline driving the sale (1031 exchange, divorce, estate, relocation)? That informs how much negotiation room exists.
- Crime grade is D in this area — have there been break-ins, vandalism, or insurance claims at this property in the last 3 years? What carrier currently insures it and at what premium?
- The area grade is low — what's the realistic commute time and amenity access for the typical tenant pool here? Any planned neighborhood developments (good or bad) we should know about?
- What's the average days-on-market for RENTAL listings here right now (not sales)? A rising rental-DOM trend means longer vacancies and softer asking-rent achievability than the comps imply.
- What's the recent tenant-quality profile in this submarket — average credit score on applications, eviction rate, late-payment / NSF rate, and stable-employment percentage? A property-management company in the area should have these aggregated.
- How much new for-sale + rental construction is in the pipeline within 1–3 miles? Heavy new supply typically softens prices + rents 12–24 months out; constrained supply supports both.
Investment metrics
- 1% rule
- 0.68% ✗
- Cap rate
- 5.36%
- Cash-on-cash
- -3.34%
- DSCR
- 0.85
- GRM
- 12.3
CMA / ARV
No comps found within radius.
Projected returns pro-forma
10.0% appreciation · 3.0% rent growth · sell at horizon
- IRR
- 21.9%
- Equity multiple
- 2.77×
- Total profit
- $133,056
- Equity at exit
- $242,337
- IRR
- 19.7%
- Equity multiple
- 6.34×
- Total profit
- $402,133
- Equity at exit
- $522,608
Cash invested: $75,320 (down + closing). Projections, not guarantees.
Landlord ↔ Tenant lean methodology
- Overall (STATE)
- 87 Strongly Landlord-Friendly
- State Florida
- 87 Strongly Landlord-Friendly · R+3
- County
- — inherits STATE
- City
- — inherits STATE
ZIP-level market 32024
- Home prices YoY
- 7.6%
- Active inventory
- 206
- Price-to-rent
- 12.3×
Monthly cashflow live
- Estimated rent
- $1,830 medium interval (Pro) →
- Mortgage (P&I)
- −$1,411
- Tax from tax record
- −$132 /mo · $1,589/yr
- Insurance
- −$112
- HOA
- −$0
- Vacancy / Maint / Mgmt
- −$384
- Net cashflow
- $-210
Break-even live
Sensitivity live
| Price | -10% $-57 | -5% $-133 | +0% $-210 | +5% $-286 | +10% $-362 |
|---|---|---|---|---|---|
| Rent | -10% $-354 | -5% $-282 | +0% $-210 | +5% $-137 | +10% $-65 |
| Rate | -1.0pp $-74 | -0.5pp $-141 | base $-210 | +0.5pp $-279 | +1.0pp $-350 |
UW: 25.0% down · 7.5% · 30yr · 1.5% tax · 5.0% vac · 8.0% maint · 8.0% mgmt
Financing live
Cash to close
- Down payment
- $67,250
- Closing costs
- $8,070
- Reserves months
- —
- Total cash needed
- —
Loan-product check · same deal, 3 products live
Conventional
25% down · 7.5% · 30yr
- Down + closing
- —
- Monthly P&I
- —
- Monthly cashflow
- —
- DSCR
- —
- Eligible?
- —
Personal DTI + credit; lowest rate.
DSCR
20% down · 8.5% · 30yr
- Down + closing
- —
- Monthly P&I
- —
- Monthly cashflow
- —
- DSCR
- —
- Eligible?
- —
No personal income docs; deal must DSCR.
Hard money
10% down · 12.0% · 12mo
- Down + closing
- —
- Monthly P&I
- —
- Monthly cashflow
- —
- DSCR
- —
- Eligible?
- —
Short-term bridge; refi at stabilization.
Listing history 4 events
-
2026-06-22days on market $269,000 Active 5 DOM
-
2026-06-19days on market $269,000 Active 2 DOM
-
2026-06-17remarks 699-char remark
-
2026-06-17$269,000 Active 1 DOM
ⓘ Source: listings_history table (triggers on properties + properties_extension) + one-shot
backfill from property_details.listing_events for pre-trigger history.
Tax reassessment forecast FL · Resets to sale price
- Current annual tax
- $1,589 · $132/mo
- Projected year-2 tax
- $2,233 · $186/mo
- Expected delta
- +$644/yr (+$54/mo · 40.5%)
ⓘ Screening estimate from a state-policy table — verify with the county assessor before closing.
Climate risk First Street
- Flood 1/10 Low FEMA zone X (unshaded) · 0% chance over 30 yrs
- Wildfire 9/10 Extreme
- Heat 8/10 Severe 7 d/yr ≥108°F today · 20 d/yr by 30 yrs out
- Wind 9/10 Extreme 99% chance of damaging wind over 30 yrs
- Air quality 3/10 Moderate 3 unhealthy d/yr today · 3 by 30 yrs out
Nearby sold comps map
Loading sold comps map…
Walkable amenities ~0.75 mi
Loading nearby amenities…
Taxation est. · year 1
- Rental income
- $21,958
- − Mortgage interest
- −$15,068
- − Property taxes
- −$1,589
- − Insurance
- −$1,345
- − Repairs & maintenance
- −$1,757
- − Management
- −$1,757
- − Depreciation
- −$7,825
- Taxable loss
- −$7,383
- Est. tax savings @ 24.0%
- +$1,772
- After-tax cash flow
- $-743/yr
For passive investors: Depreciation is non-cash, so a rental often shows a tax loss while cash-flowing — sheltering income. Rental losses are passive: they offset passive income freely, and up to $25,000/yr can offset ordinary (W-2) income if you actively participate and your MAGI is under $100k (phasing out to $0 by $150k); unused losses carry forward. On sale, claimed depreciation is recaptured at up to 25%, and gains may owe capital-gains tax (a 1031 exchange can defer both). Figures are a year-1 estimate at your 24.0% rate — not tax advice; consult a CPA.
Schools (NCES district)
- District
- Suwannee
- NCES district ID
- 1201830
- Math proficiency
- 45% ▼ -4.00%
- Reading proficiency
- 44% ▼ -5.00%
- Median HH income
- $37,785
- Composite
- 37.07/100
- National rank
- #4503
- State rank
- #52 of 73 in FL
Livability — Branford
- Score
- 62/100
- State rank
- #748
- US rank
- #16225
Category grades
Schools grade is shown separately in the Schools card above.
Census & demographics
- Population (ZIP)
- 20,644
Population outlook (Suwannee County) Hauer SSP2
- Today (2025)
- 45,226 people
- By 2030
- 45,833 · +1.3%
- By 2040
- 46,631 · +3.1%
- By 2050
- 46,544 · +2.9%
- By 2075
- 43,635 · -3.5%
- By 2100
- 34,318 · -24.1%
Race, ethnicity, and origin ACS 2023
- Neighborhood character
- Predominantly White (78%)
- Race & ethnicity
- White 78% Hispanic / Latino 10% Two or more races 7% Black 6% Asian 2%
- Hispanic origin (detail)
- Mexican 2% Puerto Rican 3%
- Common ancestry
- Italian 2% Portuguese 1% Lithuanian 1%
- Foreign-born
- 5% · Canada, Jamaica
- Languages at home
- 91% English-only · Spanish 8% Vietnamese 1%
Political lean MEDSL · Suwannee
- 2024 margin
- Solid R (+61.0) · D 19.3% · R 80.2%
- 2008→2024 swing
- -17.8pp toward R · 2008: -43.1pp · 2024: -61.0pp
- All cycles
- 2024: R+61.0 2020: R+56.6 2016: R+55.3 2012: R+45.0 2008: R+43.1
Not yet ingested
- Civics
- —
Market trends
- HPI YoY
- ▲ 19.05%
- Current HPI
- 269.4659
- Rent YoY
- —
- Metro
- —
- State GDP YoY
- ▲ 3.28%
- F500 in state
- 36
Industry mix (Fortune 500 HQ in FL)
| Industry | F500 HQs | Revenue |
|---|---|---|
| Industrial Technology | 2 | $29B |
|
||
| Insurance | 2 | $17B |
|
||
| Retail | 1 | $60B |
|
||
| Technology Distribution | 1 | $58B |
|
||
| Homebuilding | 1 | $35B |
|
||
| Technology Manufacturing | 1 | $35B |
|
||
Price history
+52.8% since first listed7 events — show timeline
- 2026-06-17 Listed $269,000 NFMLS
- 2019-05-02 Sold (Public Records) $132,600 Public Records
- 2019-03-17 Sold (MLS) $132,600 NFMLS
- 2016-10-10 Listing Removed — Stellar MLS as Distributed by MLS Grid
- 2016-04-10 Listed $137,500 Stellar MLS as Distributed by MLS Grid
- 2005-06-06 Sold (Public Records) $90,000 Public Records
- 2005-05-02 Sold (Public Records) $176,000 Public Records
Property tax history
+6.9%/yrLatest (2025): $1,589 · +5.1% YoY. Source: county tax records.
Cash-flow waterfall
monthlySold comps — $/sqft
last 12 mo · ≤1 miLoading sold comps…