 Multi-family
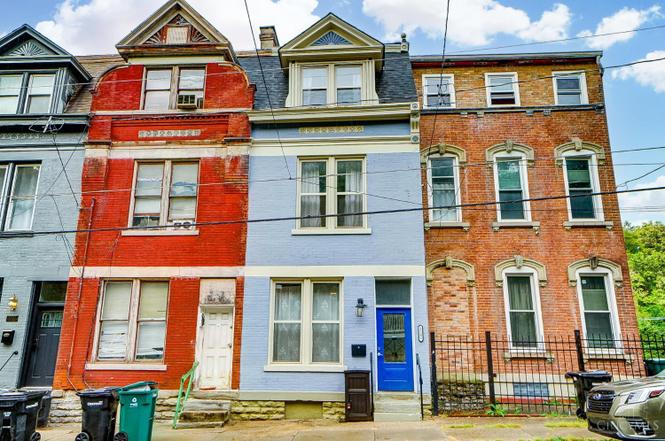
2241 Loth St · Cincinnati, OH
Flood risk 1/10 · Minimal
- FEMA flood zone
- X (unshaded)
- Chance of flooding over 30 yrs
- 0.0%
- Est. flood insurance / yr
- $473 – $860
Fire risk 1/10 · Minimal
- Est. fire insurance / yr
- $713 – $1,323
Heat risk 4/10 · Minor
- Hot days now (above 103°F)
- 7 days/yr
- Hot days in 30 yrs
- 18 days/yr
Wind risk 2/10 · Minimal
- Chance of severe wind over 30 yrs
- 1.0%
Air-quality risk 3/10 · Minor
- Unhealthy air days now
- 2 days/yr
- Unhealthy air days in 30 yrs
- 3 days/yr
Risk factors via First Street. Map © Google.
Why this score? — see what drove the B grade
The composite is a weighted blend of 9 inputs, each scored 0–100. Each bar is that input's sub-score; the figure is the points it added to the 100-point composite (weight × sub-score).
- Cash flow +29.0/30.0
- ARV discount +14.8/15.0
- DSCR +10.0/10.0
- 1% rule +8.7/10.0
- Livability +4.0/5.0
- Rent growth +3.0/5.0
- Schools +2.5/10.0
- Condition / age +2.5/5.0
- Appreciation +0.0/10.0
$290,000
🖨 Deal sheet 📄 Offer letter ✓ Due diligence
Multi-family units
County records classify this as Multi-Family (2-4 Unit). Listing-text estimate: 1 unit. estimate disagrees with records
Listing remarks MLS
Classic Cincinnati Victorian rowhouse renovated from top to bottom with stylish, modern finishes that seamlessly blend with the original character. Entire 2nd fl is primary ensuite with gorgeous primary bath, dressing area and laundry. Third floor is private oasis for children or guests. Single Family living in the city!
Key facts
- Primary ensuite
- Private oasis
- 1,176 sq ft lot
Tags
Property features AI
Finance
- Other: Residential zoning; Public transportation available; Property located on a city street (Cross street: Mulberry, Suburb: Mt. Auburn)
- HOA & community: No HOA
Exterior
- Parking: On-street parking
- Utilities: Public water; Public sewer; Natural gas
- Home design: Single family home; Italianate/Victorian architectural style; Three+ levels; Stone foundation
- Construction: Brick and wood siding exterior; Membrane roof
- Exterior features: Deck; Patio; Privacy fencing; One fireplace (inoperable)
Interior
- Kitchen: Galley kitchen with counter bar; Tile floor; Walkout; Marble/Granite/Slate countertops
- Bedrooms: Two bedrooms total; Primary bedroom ~14 x 14 (Level 2); Second bedroom ~14 x 14 (Level 3)
- Flooring: Wood floors in dining and living areas; Tile in kitchen
- Bathrooms: Two full bathrooms; One half bathroom; Primary bathroom with shower and tub; One full bath on level 2; One full bath on level 3; Half bath on level 1
- Heating & cooling: Forced air heating (gas); Central air conditioning; Gas water heating
- Interior features: 9-foot+ ceilings; Crown molding; Skylight; Ceiling fan
- Laundry & utility: Washer and dryer included; Dishwasher; Gas cooktop; Oven/Range; Refrigerator
Neighborhood map
What this means for you Summary
Snapshot
- This is a 3-bed/2.0-bath multifamily listed at $290k.
Deal economics
- At list price, monthly cash flow is $993 ($12k/yr) — positive.
- The deal already cash-flows at list — no discount required.
- Meets the 1% rule at list price ($4k rent vs $290k).
- Recommended offer: $273k (6.0% below list) — sets the bar for market timing.
- Cap rate 10.4% vs local median 3.9% in Cincinnati — top-decile yield for the area; either an underpriced asset or a hidden risk that comps aren't pricing in. Stress-test before assuming the spread holds.
Location & tenants
- Location reads 80/100 on livability (#130 in OH, #1,856 nationally) — a professional / high-income tenant draw. Strengths: amenities A+, commute A+, cost of living A+; Watch: employment D, crime F.
- Cincinnati Public Schools (urban): math 25% / reading 36% proficiency, ranked #581 of 656 in OH (top 89%) — families likely to look elsewhere, expect single-tenant / working-renter base with shorter leases; 70% free/reduced lunch — lower-income household profile, screen leases tightly.
- Market conditions: Rents rising (+2.1%/yr); 71 active listings in the ZIP; 40 comparable units currently listed for rent nearby; rentals at typical pace (median 20d on market — plan ~3-4 weeks tenant-placement turnaround); lower-income renter base — watch delinquency; 801 units permitted in Hamilton County in 2024 (190 in 5+ unit buildings).
- At $3,980/mo this rent would consume 134% of the median local household income ($36k/yr) (locally 2461% of renters already pay >50% of income on rent) — very limited rent-growth headroom before tenants either downsize or default.
Forward outlook
- Local home prices are declining (-3.0%/yr); year-one equity from $2k of loan paydown is wiped out by about $9k of value loss. Plan a longer hold.
- At projected returns (-3.0% appreciation + 2.1% rent growth), your $81k cash investment doubles in ~9 years — after that, you're playing with house money.
Negotiation context
- It's been on market 84 days — a 6% lower offer ($273k) is reasonable based on typical stale-listing flexibility.
- 7 sale attempts since 24y ago with the ask held roughly flat each time — persistent listings suggest the price (not the market) is what's stuck; bring a comps-based counter.
Risks & watch-outs
- Watch-outs: built in 1880 — expect roof / HVAC / electrical / plumbing capex.
Questions for the listing agent
- It's been on market 84 days. Have you received any prior offers? Is the seller open to a 6% concession, seller financing, or rate buy-down credit?
- Built in 1880 — when were the roof, HVAC, electrical panel, plumbing, and water heater last replaced?
- Why hasn't it sold? Are there any deal-killer items the seller is aware of (foundation, flood, title, zoning, code violations)?
- Is there a deadline driving the sale (1031 exchange, divorce, estate, relocation)? That informs how much negotiation room exists.
- Schools are B-rated — typically a magnet for longer-tenancy family renters. What's the average tenant stay here, and is there a school-zone premium baked into asking?
- Crime grade is F in this area — have there been break-ins, vandalism, or insurance claims at this property in the last 3 years? What carrier currently insures it and at what premium?
- What's the average days-on-market for RENTAL listings here right now (not sales)? A rising rental-DOM trend means longer vacancies and softer asking-rent achievability than the comps imply.
- What's the recent tenant-quality profile in this submarket — average credit score on applications, eviction rate, late-payment / NSF rate, and stable-employment percentage? A property-management company in the area should have these aggregated.
- How much new apartment / multifamily construction is in the pipeline within 1–3 miles? Heavy new supply (>2% of stock underway) typically softens rents 12–24 months out; light construction supports rent growth.
Investment metrics
- 1% rule
- 1.37% ✓
- Cap rate
- 10.40%
- Cash-on-cash
- 14.67%
- DSCR
- 1.65
- GRM
- 6.1
CMA / ARV
- ARV (on-the-fly)
- $346,560
- Comps found
- 8
Show comp detail 8 sales within ~0.75 mi
| Address | Dist | Beds/Ba | Sqft | Sold | Price | $/sf | Match |
|---|---|---|---|---|---|---|---|
| 318 Mohawk St | 0.59mi | 3/2.0 | 2,226 (-2%) | 2mo | $380,000 | $171 | 67 |
| 2226 Ravine St | 0.64mi | 4/2.0 (+1) | 2,270 (-0%) | 0mo | $297,500 | $131 | 64 |
| 133 Parker St | 0.27mi | 4/2.5 (+1) | 2,433 (+7%) | 10mo | $370,000 | $152 | 61 |
| 2025 Burnet Ave | 0.64mi | 4/3.0 (+1) | 2,252 (-1%) | 5mo | $242,500 | $108 | 54 |
| 1606 Elm St | 0.63mi | 3/3.0 | 2,592 (+14%) | 1mo | $135,000 | $52 | 43 |
| 1624 Pleasant St | 0.59mi | 3/3.0 | 2,496 (+10%) | 21mo | $535,000 | $214 | 35 |
| 2158 Stratford Ave | 0.50mi | 3/2.5 | 2,620 (+15%) | 22mo | $382,000 | $146 | 32 |
| 434 Liberty Hl | 0.73mi | 3/— | 2,525 (+11%) | 21mo | $725,000 | $287 | 30 |
Match score weights: distance 35% · size 25% · config 20% · recency 20%. Top-matched comps best support the ARV.
Projected returns pro-forma
-3.0% appreciation · 2.07% rent growth · sell at horizon
- IRR
- 4.1%
- Equity multiple
- 1.16×
- Total profit
- $12,705
- Equity at exit
- $43,240
- IRR
- 12.7%
- Equity multiple
- 1.96×
- Total profit
- $78,242
- Equity at exit
- $25,074
Cash invested: $81,200 (down + closing). Projections, not guarantees.
Landlord ↔ Tenant lean methodology
- Overall (STATE)
- 73 Landlord-Friendly
- State Ohio
- 73 Landlord-Friendly · R+6
- County
- — inherits STATE
- City
- — inherits STATE
ZIP-level market 45219
- Home prices YoY
- -28.3%
- Rents YoY
- 2.1%
- Active inventory
- 71
- Price-to-rent
- 18.2×
Monthly cashflow live
- Estimated rent
- $3,980 high interval (Pro) →
- Mortgage (P&I)
- −$1,521
- Tax from tax record
- −$510 /mo · $6,116/yr
- Insurance
- −$121
- HOA
- −$0
- Vacancy / Maint / Mgmt
- −$836
- Net cashflow
- $993
Break-even live
3-unit breakdown (identical units grouped — click to expand)
| Units | Beds | Baths | Est. rent |
|---|---|---|---|
| 3× units | 2 | 2.5 | $3,978 |
| #1 | 2 | 2.5 | $1,326 |
| #2 | 2 | 2.5 | $1,326 |
| #3 | 2 | 2.5 | $1,326 |
| Total (3 units) | $3,980 | ||
UW: 25.0% down · 7.5% · 30yr · 1.5% tax · 5.0% vac · 8.0% maint · 8.0% mgmt
Financing live
Cash to close
- Down payment
- $72,500
- Closing costs
- $8,700
- Reserves months
- —
- Total cash needed
- —
Loan-product check · same deal, 3 products live
Conventional
25% down · 7.5% · 30yr
- Down + closing
- —
- Monthly P&I
- —
- Monthly cashflow
- —
- DSCR
- —
- Eligible?
- —
Personal DTI + credit; lowest rate.
DSCR
20% down · 8.5% · 30yr
- Down + closing
- —
- Monthly P&I
- —
- Monthly cashflow
- —
- DSCR
- —
- Eligible?
- —
No personal income docs; deal must DSCR.
Hard money
10% down · 12.0% · 12mo
- Down + closing
- —
- Monthly P&I
- —
- Monthly cashflow
- —
- DSCR
- —
- Eligible?
- —
Short-term bridge; refi at stabilization.
Rent comps 40 comps
| Address | Beds | Baths | Sqft | Rent | $/sqft | DOM | Units | Dist |
|---|---|---|---|---|---|---|---|---|
| 2271 Vine St Cincinnati, OH | 4.0 | 2.0 | 2268 | $1,525 | $0.67 | 4d | 1 | 0.09mi |
| 55 Mulberry St Cincinnati, OH | 3.0 | 3.0 | 2500 | $3,500 | $1.40 | 23d | 1 | 0.29mi |
| 107 E Clifton Ave Unit 1234537P Cincinnati, OH | 2.0–3.0 | 1.0–2.0 | 2260 | $6,619 | $2.93 | 14d | 2 | 0.31mi |
| 216 Gilman Ave Unit 1363975P Cincinnati, OH | 3.0 | 1.0 | 1776 | $3,474 | $1.96 | 2d | 1 | 0.34mi |
| 236 Gilman Ave Cincinnati, OH | 3.0 | 2.5 | 1699 | $2,200 | $1.29 | 12d | 1 | 0.38mi |
| 1826 Republic St Unit 1056093P Cincinnati, OH | 2.0 | 1.0 | 1614 | $2,812 | $1.74 | 14d | 1 | 0.42mi |
| 328 Mulberry St Cincinnati, OH | 3.0 | 3.5 | 2640 | $5,500 | $2.08 | 14d | 1 | 0.50mi |
| 328 Mulberry St Cincinnati, OH | 3.0 | 3.5 | 2640 | $5,500 | $2.08 | 23d | 1 | 0.50mi |
| 2386 Wheeler St Cincinnati, OH | 4.0 | 1.0 | 1740 | $2,700 | $1.55 | 23d | 1 | 0.50mi |
| 2388 Wheeler St Cincinnati, OH | 4.0 | 2.0 | 1740 | $2,700 | $1.55 | 23d | 1 | 0.50mi |
| 2332 Chickasaw St Unit 1 Cincinnati, OH | 3.0 | 1.0 | 2000 | $1,800 | $0.90 | 23d | 1 | 0.51mi |
| 111 W Elder St Unit 1056044P Cincinnati, OH | 1.0–4.0 | 1.0–4.0 | 1835 | $5,561 | $3.03 | 10d | 2 | 0.54mi |
| 2235 Victor St Cincinnati, OH | 4.0 | 2.0 | 2043 | $2,250 | $1.10 | 23d | 1 | 0.57mi |
| 2231 Flora St Cincinnati, OH | 4.0 | 2.0 | 1728 | $1,500 | $0.87 | 23d | 1 | 0.61mi |
| 2105 Burnet Ave Unit 1056017P Cincinnati, OH | 4.0 | 2.0 | 2960 | $7,384 | $2.49 | 1d | 1 | 0.62mi |
| 1610 Pleasant St Unit 1056041P Cincinnati, OH | 3.0–4.0 | 2.0–3.0 | 2960 | $4,370 | $1.48 | 10d | 2 | 0.64mi |
| 1610 Sycamore St Cincinnati, OH | 2.0 | 2.0 | 1600 | $1,900 | $1.19 | 10d | 1 | 0.64mi |
| 1537 Republic St Unit 1058850P Cincinnati, OH | 4.0 | 3.0 | 2421 | $10,677 | $4.41 | 21d | 1 | 0.66mi |
| 21 E 15th St Unit 1512946P Cincinnati, OH | 3.0 | 2.0 | 2852 | $12,830 | $4.50 | 23d | 1 | 0.69mi |
| 2800 Jefferson Ave Cincinnati, OH | 4.0 | 2.0 | 2500 | $625 | $0.25 | 19d | 1 | 0.70mi |
| 472 Dayton St Cincinnati, OH | 2.0 | 1.5 | 2519 | $1,500 | $0.60 | 4d | 1 | 0.72mi |
| 1354 Broadway Unit 1056136P Cincinnati, OH | 4.0 | 3.0 | 2529 | $7,307 | $2.89 | 2d | 1 | 0.72mi |
| 1424 Pleasant St Unit 1056038P Cincinnati, OH | 4.0 | 3.0 | 2960 | $7,167 | $2.42 | 14d | 1 | 0.78mi |
| 2813 Gerard St Unit 1540075P Cincinnati, OH | 4.0 | 3.0 | 2152 | $6,281 | $2.92 | 20d | 1 | 0.82mi |
| 120 E 13th St Unit 1056091P Cincinnati, OH | 4.0 | 2.0 | 3229 | $10,667 | $3.30 | 21d | 1 | 0.83mi |
| 1304 Broadway Unit 1056130P Cincinnati, OH | 1.0–5.0 | 1.0–4.0 | 2072 | $5,808 | $2.80 | 10d | 2 | 0.84mi |
| 516 E 12th St Unit 1314562P Cincinnati, OH | 4.0 | 2.0 | 2023 | $10,170 | $5.03 | 23d | 1 | 0.92mi |
| 242 Stetson St Unit NA Cincinnati, OH | 3.0 | 2.5 | 2300 | $3,500 | $1.52 | 21d | 1 | 1.04mi |
| 651 William Howard Taft Rd Cincinnati, OH | 2.0 | 2.5 | 1637 | $3,070 | $1.88 | 23d | 1 | 1.04mi |
| 2517 May St Cincinnati, OH | 3.0 | 3.5 | 2014 | $3,420 | $1.70 | 21d | 1 | 1.05mi |
| 2704 W McMicken Ave Unit 2 Cincinnati, OH | 3.0 | 1.0 | 1760 | $1,500 | $0.85 | 23d | 1 | 1.06mi |
| 1287 Ida St Cincinnati, OH | 3.0 | 2.5 | 2494 | $4,700 | $1.88 | 17d | 1 | 1.07mi |
| 2601 May St Cincinnati, OH | 2.0–3.0 | 2.5–3.5 | 1737 | $3,325 | $1.91 | 1d | 12 | 1.07mi |
| 2611 May St Cincinnati, OH | 2.0 | 2.5 | 1637 | $3,070 | $1.88 | 13d | 1 | 1.10mi |
| 923 Paradrome St Cincinnati, OH | 3.0 | 2.5 | 2098 | $3,000 | $1.43 | 23d | 1 | 1.18mi |
| 623 Riddle Rd Cincinnati, OH | 3.0 | 2.0 | 2028 | $1,800 | $0.89 | 23d | 1 | 1.19mi |
| 918 Windsor St Cincinnati, OH | 3.0 | 1.0 | 2583 | $1,675 | $0.65 | 23d | 1 | 1.22mi |
| 19 Garfield Pl Cincinnati, OH | 1.0–2.0 | 1.0–2.0 | 1680 | $2,260 | $1.34 | 1d | 11 | 1.23mi |
| 634 Sycamore St Cincinnati, OH | 2.0 | 1.0–1.5 | 1261 | $2,615 | $2.07 | 4d | 9 | 1.26mi |
| 345 E 7th St Cincinnati, OH | 2.0 | 1.0–2.0 | 1184 | $4,300 | $3.63 | 3d | 18 | 1.27mi |
Listing history 21 events
-
2026-06-01days on market $290,000 Active 84 DOM
-
2026-05-31days on market $290,000 Active 83 DOM
-
2026-04-17price $290,000
-
2026-03-06$300,000 Active
-
2025-11-19historical 322-char remark
Show marketing remark (322 chars)
Classic Cincinnati Victorian rowhouse renovated from top to bottom with stylish, modern finishes that seamlessly blend with the original character. Entire 2nd fl is primary ensuite with gorgeous primary bath, dressing area and laundry. Third floor is private oasis for children or guests. Single Family living in the city!
-
2025-10-29price $310,000 322-char remark
Show marketing remark (322 chars)
Classic Cincinnati Victorian rowhouse renovated from top to bottom with stylish, modern finishes that seamlessly blend with the original character. Entire 2nd fl is primary ensuite with gorgeous primary bath, dressing area and laundry. Third floor is private oasis for children or guests. Single Family living in the city!
-
2025-10-15price $315,000 322-char remark
Show marketing remark (322 chars)
Classic Cincinnati Victorian rowhouse renovated from top to bottom with stylish, modern finishes that seamlessly blend with the original character. Entire 2nd fl is primary ensuite with gorgeous primary bath, dressing area and laundry. Third floor is private oasis for children or guests. Single Family living in the city!
-
2025-09-24$330,000 Active 322-char remark
Show marketing remark (322 chars)
Classic Cincinnati Victorian rowhouse renovated from top to bottom with stylish, modern finishes that seamlessly blend with the original character. Entire 2nd fl is primary ensuite with gorgeous primary bath, dressing area and laundry. Third floor is private oasis for children or guests. Single Family living in the city!
-
2022-02-28soldstatus $280,000 Sold 19-char remark
Show marketing remark (19 chars)
Pending Before Sent
-
2022-02-07Contingency Pending 19-char remark
Show marketing remark (19 chars)
Pending Before Sent
-
2022-02-07$280,000 19-char remark
Show marketing remark (19 chars)
Pending Before Sent
-
2020-10-27historical
-
2020-09-09$239,900 Active
-
2020-09-02historical
-
2020-08-18price $264,500
-
2020-07-21$280,000 Active
-
2003-04-22soldstatus $33,000
-
2002-05-22$51,500
-
1998-12-03soldstatus $80,000
-
1993-10-01soldstatus $14,500
-
1990-09-25soldstatus $35,000
ⓘ Source: listings_history table (triggers on properties + properties_extension) + one-shot
backfill from property_details.listing_events for pre-trigger history.
Tax reassessment forecast OH · Partial reset (capped growth)
- Current annual tax
- $6,116 · $510/mo
- Projected year-2 tax
- $6,116 · $510/mo
- Expected delta
- $0/yr ($0/mo · 0.0%)
ⓘ Screening estimate from a state-policy table — verify with the county assessor before closing.
Climate risk First Street
- Flood 1/10 Low FEMA zone X (unshaded) · 0% chance over 30 yrs
- Wildfire 1/10 Low
- Heat 4/10 Moderate 7 d/yr ≥103°F today · 18 d/yr by 30 yrs out
- Wind 2/10 Low 100% chance of damaging wind over 30 yrs
- Air quality 3/10 Moderate 2 unhealthy d/yr today · 3 by 30 yrs out
Nearby sold comps map
Loading sold comps map…
Walkable amenities ~0.75 mi
Loading nearby amenities…
Taxation est. · year 1
- Rental income
- $47,760
- − Mortgage interest
- −$16,245
- − Property taxes
- −$6,116
- − Insurance
- −$1,450
- − Repairs & maintenance
- −$3,821
- − Management
- −$3,821
- − Depreciation
- −$8,436
- Taxable income
- $7,871
- Est. tax owed @ 24.0%
- −$1,889
- After-tax cash flow
- $10,026/yr
For passive investors: Depreciation is non-cash, so a rental often shows a tax loss while cash-flowing — sheltering income. Rental losses are passive: they offset passive income freely, and up to $25,000/yr can offset ordinary (W-2) income if you actively participate and your MAGI is under $100k (phasing out to $0 by $150k); unused losses carry forward. On sale, claimed depreciation is recaptured at up to 25%, and gains may owe capital-gains tax (a 1031 exchange can defer both). Figures are a year-1 estimate at your 24.0% rate — not tax advice; consult a CPA.
Schools (NCES district)
- District
- Cincinnati Public Schools
- NCES district ID
- 3904375
- Math proficiency
- 25% ▼ -19.00%
- Reading proficiency
- 36% ▼ -14.00%
- Median HH income
- $35,743
- Composite
- 25.21/100
- National rank
- #7508
- State rank
- #581 of 656 in OH
Livability — Cincinnati
- Score
- 80/100
- State rank
- #130
- US rank
- #1856
Category grades
Schools grade is shown separately in the Schools card above.
Census & demographics
- Census place
- Cincinnati, OH
- County
- Hamilton County · 701,295 people
- City population
- 505,555
- Metro
- Cincinnati, OH-KY-IN
- Population (ZIP)
- 20,012
- Household income
- $35,657
- Rent vs Own
- Severe rent burden
- 2461.0
Population outlook (Hamilton County) Hauer SSP2
- Today (2025)
- 826,054 people
- By 2030
- 830,947 · +0.6%
- By 2040
- 832,319 · +0.8%
- By 2050
- 822,428 · -0.4%
- By 2075
- 788,688 · -4.5%
- By 2100
- 710,674 · -14.0%
Race, ethnicity, and origin ACS 2023
- Neighborhood character
- Predominantly White (67%)
- Race & ethnicity
- White 67% Black 16% Asian 7% Two or more races 6% Hispanic / Latino 4%
- Common ancestry
- Romanian 3% Italian 2% Slovak 1%
- Foreign-born
- 10% · China, Canada
- Languages at home
- 88% English-only · Chinese 3% Spanish 2% Other Indo-European 2%
Political lean MEDSL · Hamilton
- 2024 margin
- D (+14.9) · D 57.0% · R 42.1%
- 2008→2024 swing
- +7.9pp toward D · 2008: 7.0pp · 2024: 14.9pp
- All cycles
- 2024: D+14.9 2020: D+15.9 2016: D+9.5 2012: D+4.9 2008: D+7.0
Not yet ingested
- Civics
- —
Market trends
- HPI YoY
- ▼ -134.46%
- Current HPI
- 340.1262
- Rent YoY
- ▲ 2.07%
- Metro
- Cincinnati, OH-KY-IN
- State GDP YoY
- ▲ 1.98%
- F500 in state
- 48
Industry mix (Fortune 500 HQ in OH)
| Industry | F500 HQs | Revenue |
|---|---|---|
| Insurance | 3 | $145B |
|
||
| Industrial Machinery | 3 | $49B |
|
||
| Financial Services | 3 | $24B |
|
||
| Consumer Goods | 2 | $93B |
|
||
| Aerospace / Defense | 2 | $47B |
|
||
| Utilities | 2 | $33B |
|
||
Price history
+728.6% since first listed19 events — show timeline
- 2026-04-17 Price Changed $290,000 Cincy MLS
- 2026-03-06 Listed $300,000 Cincy MLS
- 2025-11-19 Listing Removed — Cincy MLS
- 2025-10-29 Price Changed $310,000 Cincy MLS
- 2025-10-15 Price Changed $315,000 Cincy MLS
- 2025-09-24 Listed $330,000 Cincy MLS
- 2022-02-28 Sold (MLS) $280,000 Cincy MLS
- 2022-02-07 Listed — Cincy MLS
- 2022-02-07 Listed $280,000 Cincy MLS
- 2020-10-27 Listing Removed — Cincy MLS
- 2020-09-09 Listed $239,900 Cincy MLS
- 2020-09-02 Listing Removed — Cincy MLS
- 2020-08-18 Price Changed $264,500 Cincy MLS
- 2020-07-21 Listed $280,000 Cincy MLS
- 2003-04-22 Sold (MLS) $33,000 Cincy MLS
- 2002-05-22 Listed $51,500 Cincy MLS
- 1998-12-03 Sold (Public Records) $80,000 Public Records
- 1993-10-01 Sold (Public Records) $14,500 Public Records
- 1990-09-25 Sold (Public Records) $35,000 Public Records
Property tax history
+20.3%/yrLatest (2025): $6,116 · +1.7% YoY. Source: county tax records.
Cash-flow waterfall
monthlySold comps — $/sqft
last 12 mo · ≤1 miLoading sold comps…