3305 Granada Dr · Cameron Park, CA
Flood risk 6/10 · Moderate
- FEMA flood zone
- X (unshaded)
- Chance of flooding over 30 yrs
- 0.74%
- Est. flood insurance / yr
- $507 – $1,088
Fire risk 10/10 · Severe
- Est. fire insurance / yr
- $659 – $1,223
Heat risk 6/10 · Moderate
- Hot days now (above 101°F)
- 7 days/yr
- Hot days in 30 yrs
- 16 days/yr
Wind risk 1/10 · Minimal
- Chance of severe wind over 30 yrs
- —
Air-quality risk 10/10 · Severe
- Unhealthy air days now
- 26 days/yr
- Unhealthy air days in 30 yrs
- 31 days/yr
Risk factors via First Street. Map © Google.
Why this score? — see what drove the D+ grade
The composite is a weighted blend of 9 inputs, each scored 0–100. Each bar is that input's sub-score; the figure is the points it added to the 100-point composite (weight × sub-score).
- ARV discount +15.0/15.0
- Cash flow +12.0/30.0
- Schools +6.0/10.0
- DSCR +3.6/10.0
- Rent growth +3.2/5.0
- Livability +2.8/5.0
- 1% rule +2.6/10.0
- Condition / age +2.5/5.0
- Appreciation +0.0/10.0
$460,000
🖨 Deal sheet (PDF) 📄 Offer letter ✓ Due diligence
Listing remarks
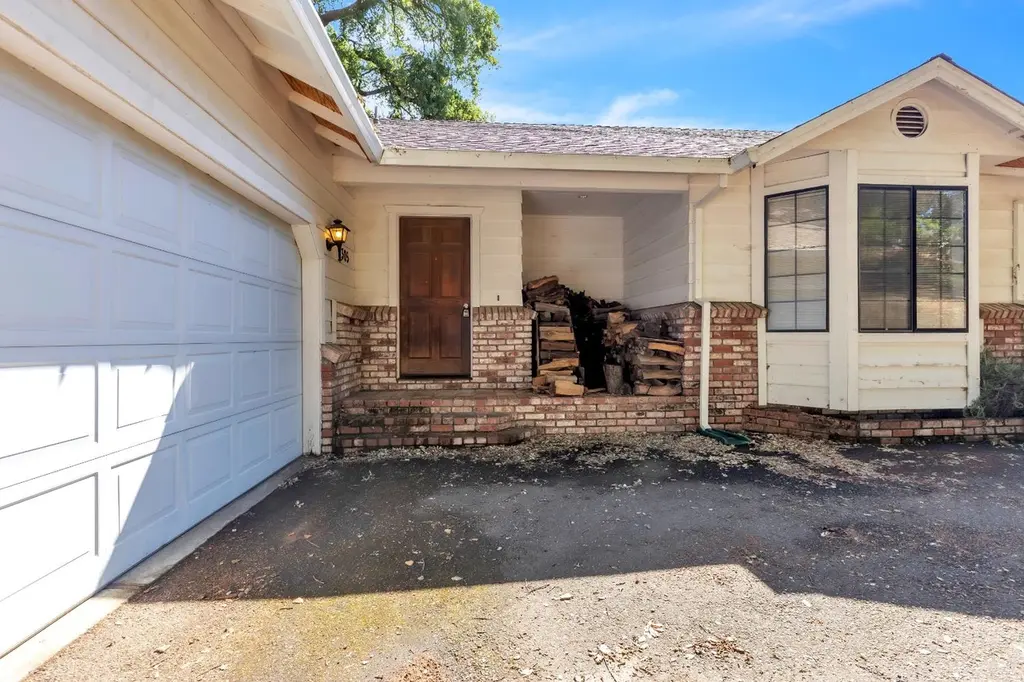
Come take a look at this wonderful opportunity to build some equity. With a little work this could be a gem. This home lives like a single story. Livingroom, kitchen, baths, all bedrooms and garage are on the main level. Down stairs in the bonus room and half bath. The bonus room also leads out to the back yard.
Key facts
- Back yard
- Bonus room
- Single story
Tags
Property features AI
Finance
- Other: Property listed as residential single-family detached; Located at 3305 Granada Dr, Cameron Park, CA 95682
- HOA & community: No homeowners association; Not a senior community
Exterior
- Parking: Attached garage facing front with 2 garage spaces
- Utilities: 220 Volt electric service; Public water; Public sewer; No irrigation source
- Home design: Detached single-family residence; Two stories; One- and two-level layout; Built in 1987
- Construction: Composition roof; Built in 1987; Detached construction
- Exterior features: Lot with other features; No horses allowed; No private pool or spa
Interior
- Kitchen: Island; Dishwasher; Microwave; Electric cook top
- Bedrooms: 3 bedrooms (located on one or two levels)
- Flooring: Carpet; Linoleum
- Bathrooms: 2 full bathrooms and 1 half bathroom; Bathtub with shower over
- Heating & cooling: Central heating; Wood stove heating; Central cooling; Ceiling fans
- Interior features: Great room living area; Front porch; 1 wood stove fireplace
- Laundry & utility: Indoor laundry room with hookups and utility sink
Neighborhood map
What this means for you Summary
Snapshot
- This is a 3-bed/2.5-bath single-family listed at $460k.
Deal economics
- At list price, monthly cash flow is $-106 ($-1k/yr) — negative.
- To cash-flow at today's rent, offer at most $441k (4.1% below list).
- To meet the 1% rule (rent ≥ 1% of price), the offer needs to be $349k (24.0% below list).
- Recommended offer: $349k (24.0% below list) — sets the bar for 1% rule.
- Cap rate 6.0% vs local median 2.7% in Cameron Park — top-decile yield for the area; either an underpriced asset or a hidden risk that comps aren't pricing in. Stress-test before assuming the spread holds.
Location & tenants
- Location reads 55/100 on livability (#832 in CA) — a working-class tenant base; expect higher turnover. Strengths: employment A+, housing B+; Watch: crime D+, amenities F, commute F.
- Rescue Union Elementary (suburban): math 61% / reading 69% proficiency, ranked #56 of 517 in CA (top 11%) — acceptable for families but not a draw, mixed tenant base, ~2y average lease; only 11% free/reduced lunch — higher-income household profile.
- Zoned schools: Rescue Elementary (math 72% / reading 67%, grade A-, #147 of 1,571 statewide, top 10%, 497 students, 21% FRL); Pleasant Grove Middle (math 49% / reading 64%, grade B, #71 of 498 statewide, top 14%, 476 students, 23% FRL); Ponderosa High (math 62% / reading 82%, grade B+, #92 of 1,170 statewide, top 8%, 1,648 students, 16% FRL).
- Market conditions: Rents rising (+2.9%/yr); 237 active listings in the ZIP; 4 comparable units currently listed for rent nearby; rentals leasing fast (median 5d on market — plan ~1-2 weeks tenant-placement turnaround); high-income renter base; 437 units permitted in El Dorado County in 2024 (0 in 5+ unit buildings).
- This rent runs 34% of the median local income ($122k/yr) — at the standard rent-burdened threshold; future hikes will face affordability resistance.
Forward outlook
- Local home prices are declining (-3.0%/yr); year-one equity from $3k of loan paydown is wiped out by about $14k of value loss. Plan a longer hold.
- El Dorado County population projected to shrink 3% by 2050 — rents likely to lag national; underwrite the cash flow, not the appreciation.
Negotiation context
- It's been on market 22 days — a 2% lower offer ($453k) is reasonable based on typical stale-listing flexibility.
- Current owner paid $19k; list at $460k implies a 2321% gain — meaningful room to come down on a strong offer.
Risks & watch-outs
- Climate carrying-cost: major flood risk; severe wildfire risk; extreme-heat days projected 7→16/yr by 2055 (HVAC capex compounding) — expect insurance premiums to compound above CPI over the hold.
Questions for the listing agent
- What do current leases actually rent for vs. the listed asking? Can we see a recent rent roll and the last 12 months of T-12 income?
- Is there a deadline driving the sale (1031 exchange, divorce, estate, relocation)? That informs how much negotiation room exists.
- Schools are B-rated — typically a magnet for longer-tenancy family renters. What's the average tenant stay here, and is there a school-zone premium baked into asking?
- Crime grade is D in this area — have there been break-ins, vandalism, or insurance claims at this property in the last 3 years? What carrier currently insures it and at what premium?
- The area grade is low — what's the realistic commute time and amenity access for the typical tenant pool here? Any planned neighborhood developments (good or bad) we should know about?
- What's the average days-on-market for RENTAL listings here right now (not sales)? A rising rental-DOM trend means longer vacancies and softer asking-rent achievability than the comps imply.
- What's the recent tenant-quality profile in this submarket — average credit score on applications, eviction rate, late-payment / NSF rate, and stable-employment percentage? A property-management company in the area should have these aggregated.
- How much new for-sale + rental construction is in the pipeline within 1–3 miles? Heavy new supply typically softens prices + rents 12–24 months out; constrained supply supports both.
Investment metrics
- 1% rule
- 0.76% ✗
- Cap rate
- 6.02%
- Cash-on-cash
- -0.99%
- DSCR
- 0.96
- GRM
- 11.0
CMA / ARV
- ARV (on-the-fly)
- $759,330
- Comps found
- 12
Show comp detail 12 sales within ~0.75 mi
| Address | Dist | Beds/Ba | Sqft | Sold | Price | $/sf | Match |
|---|---|---|---|---|---|---|---|
| 3126 Oxford Rd | 0.08mi | 4/2.5 (+1) | 2,259 (-2%) | 3mo | $540,000 | $239 | 86 |
| 3060 Knollwood Dr | 0.49mi | 3/2.5 | 2,225 (-3%) | 2mo | $580,000 | $261 | 69 |
| 3208 Bonanza Dr | 0.30mi | 4/2.5 (+1) | 2,498 (+9%) | 4mo | $1,150,000 | $460 | 63 |
| 3180 Woodleigh | 0.49mi | 4/2.0 (+1) | 2,231 (-3%) | 4mo | $954,000 | $428 | 62 |
| 3374 Sage Dr | 0.55mi | 4/2.0 (+1) | 2,351 (+2%) | 5mo | $790,000 | $336 | 60 |
| 3619 Montclair Rd | 0.75mi | 3/3.0 | 2,341 (+2%) | 2mo | $995,000 | $425 | 58 |
| 3505 Fairway Dr | 0.48mi | 4/4.5 (+1) | 2,363 (+3%) | 3mo | $780,000 | $330 | 58 |
| 3120 Woodleigh Ln | 0.60mi | 3/2.5 | 2,104 (-9%) | 1mo | $715,000 | $340 | 57 |
| 3590 Montclair Rd | 0.67mi | 3/3.0 | 2,472 (+7%) | 3mo | $728,800 | $295 | 52 |
| 2779 Osborne Rd | 0.67mi | 4/3.5 (+1) | 2,392 (+4%) | 3mo | $735,000 | $307 | 51 |
| 2980 Calido Ct | 0.55mi | 3/2.0 | 1,990 (-14%) | 3mo | $558,000 | $280 | 47 |
| 3261 Sandhurst Ct | 0.72mi | 4/3.0 (+1) | 2,056 (-11%) | 5mo | $654,000 | $318 | 38 |
Match score weights: distance 35% · size 25% · config 20% · recency 20%. Top-matched comps best support the ARV.
Projected returns pro-forma
-3.0% appreciation · 2.86% rent growth · sell at horizon
- IRR
- -18.1%
- Equity multiple
- 0.36×
- Total profit
- $-81,935
- Equity at exit
- $68,587
- IRR
- -10.7%
- Equity multiple
- 0.36×
- Total profit
- $-82,634
- Equity at exit
- $39,772
Cash invested: $128,800 (down + closing). Projections, not guarantees.
Landlord ↔ Tenant lean methodology
- Overall (STATE)
- 18 Strongly Tenant-Friendly
- State California
- 18 Strongly Tenant-Friendly · D+13
- County
- — inherits STATE
- City
- — inherits STATE
ZIP-level market 95682
- Rents YoY
- 2.9%
- Active inventory
- 237
- Price-to-rent
- 11.0×
Monthly cashflow live
- Estimated rent
- $3,494 medium interval (Pro) →
- Mortgage (P&I)
- −$2,412
- Tax from tax record
- −$263 /mo · $3,153/yr
- Insurance
- −$192
- HOA
- −$0
- Vacancy / Maint / Mgmt
- −$734
- Net cashflow
- $-106
Break-even live
Sensitivity live
| Price | -10% $154 | -5% $24 | +0% $-106 | +5% $-236 | +10% $-367 |
|---|---|---|---|---|---|
| Rent | -10% $-382 | -5% $-244 | +0% $-106 | +5% $32 | +10% $170 |
| Rate | -1.0pp $125 | -0.5pp $11 | base $-106 | +0.5pp $-225 | +1.0pp $-347 |
UW: 25.0% down · 7.5% · 30yr · 1.5% tax · 5.0% vac · 8.0% maint · 8.0% mgmt
Financing live
Cash to close
- Down payment
- $115,000
- Closing costs
- $13,800
- Reserves months
- —
- Total cash needed
- —
Loan-product check · same deal, 3 products live
Conventional
25% down · 7.5% · 30yr
- Down + closing
- —
- Monthly P&I
- —
- Monthly cashflow
- —
- DSCR
- —
- Eligible?
- —
Personal DTI + credit; lowest rate.
DSCR
20% down · 8.5% · 30yr
- Down + closing
- —
- Monthly P&I
- —
- Monthly cashflow
- —
- DSCR
- —
- Eligible?
- —
No personal income docs; deal must DSCR.
Hard money
10% down · 12.0% · 12mo
- Down + closing
- —
- Monthly P&I
- —
- Monthly cashflow
- —
- DSCR
- —
- Eligible?
- —
Short-term bridge; refi at stabilization.
Rent comps 4 comps
| Address | Beds | Baths | Sqft | Rent | $/sqft | DOM | Units | Dist |
|---|---|---|---|---|---|---|---|---|
| 3561 Castlebrook Rd Cameron Park, CA | 3.0 | 2.0 | 1623 | $3,100 | $1.91 | 4d | 1 | 0.66mi |
| 637 Lincoln Ct El Dorado Hills, CA | 4.0 | 3.5 | 3295 | $5,200 | $1.58 | 9d | 1 | 1.16mi |
| 4032 Barbary Way El Dorado Hills, CA | 4.0 | 3.0 | 2370 | $3,150 | $1.33 | 0d | 1 | 1.43mi |
| 7015 Talmage Ct El Dorado Hills, CA | 4.0 | 3.0 | 2617 | $3,800 | $1.45 | 4d | 1 | 1.47mi |
Listing history 4 events
-
2026-06-13statusdays on market $460,000 Pending 22 DOM
-
2026-06-09days on market $460,000 Active 19 DOM
-
2026-06-08status $460,000 Active 18 DOM
-
1977-02-28soldstatus $19,000
ⓘ Source: listings_history table (triggers on properties + properties_extension) + one-shot
backfill from property_details.listing_events for pre-trigger history.
Tax reassessment forecast CA · Resets to sale price
- Current annual tax
- $3,153 · $263/mo
- Projected year-2 tax
- $3,496 · $291/mo
- Expected delta
- +$343/yr (+$29/mo · 10.9%)
ⓘ Screening estimate from a state-policy table — verify with the county assessor before closing.
Climate risk First Street
- Flood 6/10 Major FEMA zone X (unshaded) · 74% chance over 30 yrs
- Wildfire 10/10 Extreme
- Heat 6/10 Major 7 d/yr ≥101°F today · 16 d/yr by 30 yrs out
- Wind 1/10 Low
- Air quality 10/10 Extreme 26 unhealthy d/yr today · 31 by 30 yrs out
Nearby sold comps map
Loading sold comps map…
Walkable amenities ~0.75 mi
Loading nearby amenities…
Taxation est. · year 1
- Rental income
- $41,932
- − Mortgage interest
- −$25,767
- − Property taxes
- −$3,153
- − Insurance
- −$2,300
- − Repairs & maintenance
- −$3,355
- − Management
- −$3,355
- − Depreciation
- −$13,382
- Taxable loss
- −$9,379
- Est. tax savings @ 24.0%
- +$2,251
- After-tax cash flow
- $977/yr
For passive investors: Depreciation is non-cash, so a rental often shows a tax loss while cash-flowing — sheltering income. Rental losses are passive: they offset passive income freely, and up to $25,000/yr can offset ordinary (W-2) income if you actively participate and your MAGI is under $100k (phasing out to $0 by $150k); unused losses carry forward. On sale, claimed depreciation is recaptured at up to 25%, and gains may owe capital-gains tax (a 1031 exchange can defer both). Figures are a year-1 estimate at your 24.0% rate — not tax advice; consult a CPA.
Schools (NCES district)
- District
- Rescue Union Elementary
- NCES district ID
- 0632310
- Math proficiency
- 61% ▼ -4.00%
- Reading proficiency
- 69% ▼ -5.00%
- Median HH income
- $98,351
- Composite
- 59.82/100
- National rank
- #895
- State rank
- #56 of 517 in CA
Livability — Cameron Park
- Score
- 55/100
- State rank
- #832
- US rank
- #23166
Category grades
Schools grade is shown separately in the Schools card above.
Census & demographics
- Census place
- Cameron Park, CA
- County
- El Dorado County · 144,198 people
- Metro
- Sacramento-Roseville-Folsom, CA
- Population (ZIP)
- 30,065
- Household income
- $122,436
- Rent vs Own
- Severe rent burden
- 634.0
Population outlook (El Dorado County) Hauer SSP2
- Today (2025)
- 191,666 people
- By 2030
- 193,662 · +1.0%
- By 2040
- 192,583 · +0.5%
- By 2050
- 185,904 · -3.0%
- By 2075
- 169,543 · -11.5%
- By 2100
- 139,623 · -27.2%
Race, ethnicity, and origin ACS 2023
- Neighborhood character
- Predominantly White (80%)
- Race & ethnicity
- White 80% Hispanic / Latino 13% Two or more races 8% Asian 2%
- Hispanic origin (detail)
- Mexican 9%
- Common ancestry
- Lithuanian 3% Portuguese 3% Italian 3%
- Foreign-born
- 5% · Canada, China
- Languages at home
- 93% English-only · Spanish 3% German/W. Germanic 1% Chinese 1%
Political lean MEDSL · El Dorado
- 2024 margin
- R (+12.0) · D 42.6% · R 54.6% · Other 2.8%
- 2008→2024 swing
- -1.5pp toward R · 2008: -10.5pp · 2024: -12.0pp
- All cycles
- 2024: R+12.0 2020: R+8.8 2016: R+13.9 2012: R+18.2 2008: R+10.5
Not yet ingested
- Civics
- —
Market trends
- HPI YoY
- ▼ -417.68%
- Current HPI
- 279.3817
- Rent YoY
- ▲ 2.86%
- Metro
- Sacramento-Roseville-Folsom, CA
- State GDP YoY
- ▲ 3.21%
- F500 in state
- 116
Industry mix (Fortune 500 HQ in CA)
| Industry | F500 HQs | Revenue |
|---|---|---|
| Technology | 27 | $1,492B |
|
||
| Financial Services | 3 | $174B |
|
||
| Retail | 3 | $44B |
|
||
| Insurance | 3 | $26B |
|
||
| Media / Entertainment | 2 | $115B |
|
||
| Pharmaceuticals / Biotech | 2 | $62B |
|
||
Price history
1 event — show timeline
- 1977-02-28 Sold (Public Records) $19,000 Public Records
Property tax history
+1.8%/yrLatest (2025): $3,153 · +2.2% YoY. Source: county tax records.
Cash-flow waterfall
monthlySold comps — $/sqft
last 12 mo · ≤1 miLoading sold comps…