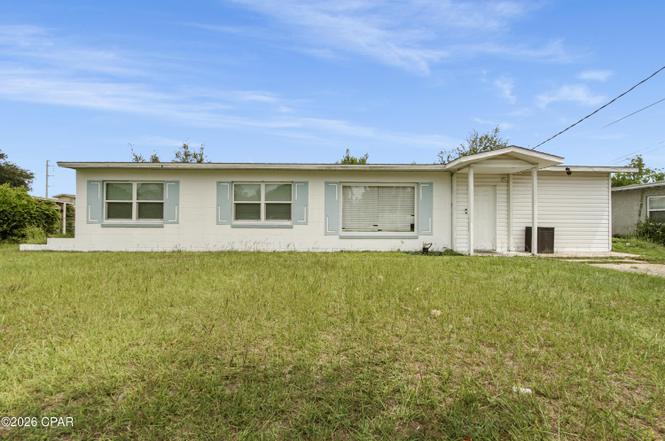
2500 W 20th St · Panama City, FL
Flood risk 1/10 · Minimal
- FEMA flood zone
- X (unshaded)
- Chance of flooding over 30 yrs
- 0.0%
- Est. flood insurance / yr
- $507 – $1,088
Fire risk 1/10 · Minimal
- Est. fire insurance / yr
- $947 – $1,759
Heat risk 10/10 · Severe
- Hot days now (above 106°F)
- 7 days/yr
- Hot days in 30 yrs
- 21 days/yr
Wind risk 9/10 · Severe
- Chance of severe wind over 30 yrs
- 99.0%
Air-quality risk 1/10 · Minimal
- Unhealthy air days now
- 0 days/yr
- Unhealthy air days in 30 yrs
- 0 days/yr
Risk factors via First Street. Map © Google.
Why this score? — see what drove the D+ grade
The composite is a weighted blend of 9 inputs, each scored 0–100. Each bar is that input's sub-score; the figure is the points it added to the 100-point composite (weight × sub-score).
- Cash flow +14.8/30.0
- ARV discount +13.1/15.0
- DSCR +4.5/10.0
- Schools +4.3/10.0
- 1% rule +3.6/10.0
- Livability +3.6/5.0
- Rent growth +2.8/5.0
- Condition / age +2.5/5.0
- Appreciation +0.0/10.0
$225,000
🖨 Deal sheet (PDF) 📄 Offer letter ✓ Due diligence
Listing remarks
Charming, Move-In Ready Block Home in Central Panama City! Welcome to this beautifully updated 4-bedroom, 2-bathroom single-family ranch home, offering the perfect blend of mid-century character and modern peace of mind. Nestled in an established, central neighborhood with no HOA, this turnkey property sits on a generous 0.27-acre lot and is completely ready for its next chapter. Centrally located with effortless access to local schools, shopping, and popular restaurants. Best of all, you are just a short drive away from the beautiful waters of St. Andrews and only 15 minutes from the world-famous white sand beaches of Panama City Beach! Whether you are looking for a move-in-ready primary r
Key facts
- Central neighborhood
- Access to shopping
- Move in ready
Tags
Property features AI
Finance
- HOA & community: Short-term rentals allowed
Exterior
- Utilities: Electricity available; Public sewer
- Home design: Single-story home; Slab foundation; Block construction
- Construction: Built with block construction; Slab foundation
- Exterior features: Patio; Paved lot
Interior
- Kitchen: Electric range
- Bedrooms: Primary bedroom on main level; Additional bedrooms on main level (three bedrooms noted)
- Bathrooms: 2 full bathrooms; Full bath on main level
- Heating & cooling: Central heating (electric); Central air conditioning; Ceiling fans
- Interior features: Double vanity; Main level primary bedroom; Tub with shower; Entrance foyer; Utility room; 12 total rooms including foyer, living room, dining room and Florida room
- Laundry & utility: Utility room; Electric water heater
Neighborhood map
What this means for you Summary
Snapshot
- This is a 4-bed/2.0-bath single-family listed at $225k.
Deal economics
- At list price, monthly cash flow is $63 ($755/yr) — positive.
- The deal already cash-flows at list — no discount required.
- To meet the 1% rule (rent ≥ 1% of price), the offer needs to be $194k (13.9% below list).
- Recommended offer: $194k (13.9% below list) — sets the bar for 1% rule.
- Cap rate 6.6% vs local median 4.7% in Panama City — top-decile yield for the area; either an underpriced asset or a hidden risk that comps aren't pricing in. Stress-test before assuming the spread holds.
Location & tenants
- Location reads 72/100 on livability (#350 in FL) — a middle-class / working-renter tenant base. Strengths: cost of living A+, housing A+, health & safety A+; Watch: crime F, amenities F, commute F.
- Bay (suburban): math 51% / reading 51% proficiency, ranked #29 of 73 in FL (top 40%) — acceptable for families but not a draw, mixed tenant base, ~2y average lease.
- Zoned schools: Lucille Moore Elementary School (math 24% / reading 30%, grade F, #1,969 of 2,144 statewide, top 94%, 503 students, 71% FRL); Jinks Middle School (math 41% / reading 42%, grade F, #348 of 571 statewide, top 62%, 570 students, 70% FRL); Bay High School (math 37% / reading 34%, grade F, #367 of 667 statewide, top 57%, 1,255 students, 53% FRL) — zoned schools average 65% FRL vs 48% district-wide (16 pts higher); higher-poverty schools than district average — tighter screening recommended.
- Zoned-school proficiency averages 35% at this address vs 51% district-wide (-16 pts) — the specific schools serving this property underperform the Bay average; the district grade overstates school quality for this exact location.
- Market conditions: Rents rising (+1.2%/yr); 380 active listings in the ZIP; 7 comparable units currently listed for rent nearby; rentals at typical pace (median 23d on market — plan ~3-4 weeks tenant-placement turnaround); 2,473 units permitted in Bay County in 2024 (559 in 5+ unit buildings).
Forward outlook
- Local home prices are declining (-3.0%/yr); year-one equity from $2k of loan paydown is wiped out by about $7k of value loss. Plan a longer hold.
- Bay County population projected at +24% by 2050 — long-run rental-demand tailwind backs the buy-and-hold thesis.
Negotiation context
- Only 3 days on market — expect competitive offers; lowballing is unlikely to land.
- 5 sale attempts since 7y ago with the ask held roughly flat each time — persistent listings suggest the price (not the market) is what's stuck; bring a comps-based counter.
- Current owner paid $148k; list at $225k implies a 52% gain — meaningful room to come down on a strong offer.
Risks & watch-outs
- Watch-outs: built in 1957 — expect roof / HVAC / electrical / plumbing capex.
- Climate carrying-cost: severe wind risk, 99% chance of damaging wind over 30y; extreme-heat days projected 7→21/yr by 2055 (HVAC capex compounding) — expect insurance premiums to compound above CPI over the hold.
Questions for the listing agent
- Built in 1957 — when were the roof, HVAC, electrical panel, plumbing, and water heater last replaced?
- Is there a deadline driving the sale (1031 exchange, divorce, estate, relocation)? That informs how much negotiation room exists.
- Schools are B-rated — typically a magnet for longer-tenancy family renters. What's the average tenant stay here, and is there a school-zone premium baked into asking?
- Crime grade is F in this area — have there been break-ins, vandalism, or insurance claims at this property in the last 3 years? What carrier currently insures it and at what premium?
- The area grade is low — what's the realistic commute time and amenity access for the typical tenant pool here? Any planned neighborhood developments (good or bad) we should know about?
- What's the average days-on-market for RENTAL listings here right now (not sales)? A rising rental-DOM trend means longer vacancies and softer asking-rent achievability than the comps imply.
- What's the recent tenant-quality profile in this submarket — average credit score on applications, eviction rate, late-payment / NSF rate, and stable-employment percentage? A property-management company in the area should have these aggregated.
- How much new for-sale + rental construction is in the pipeline within 1–3 miles? Heavy new supply typically softens prices + rents 12–24 months out; constrained supply supports both.
Investment metrics
- 1% rule
- 0.86% ✗
- Cap rate
- 6.63%
- Cash-on-cash
- 1.20%
- DSCR
- 1.05
- GRM
- 9.7
CMA / ARV
- ARV (on-the-fly)
- $257,040
- Comps found
- 12
Show comp detail 12 sales within ~0.75 mi
| Address | Dist | Beds/Ba | Sqft | Sold | Price | $/sf | Match |
|---|---|---|---|---|---|---|---|
| 1812 Foster Ave | 0.22mi | 3/2.0 (-1) | 1,318 (-3%) | 3mo | $220,000 | $167 | 78 |
| 2200 W 20th St | 0.19mi | 3/1.0 (-1) | 1,412 (+4%) | 1mo | $115,000 | $81 | 75 |
| 1712 Foster Ave | 0.34mi | 3/2.0 (-1) | 1,368 (+1%) | 4mo | $325,000 | $238 | 75 |
| 1910 Chestnut Ave | 0.24mi | 3/2.0 (-1) | 1,456 (+7%) | 8mo | $275,000 | $189 | 66 |
| 2502 W 20th St | 0.02mi | 3/2.0 (-1) | 1,552 (+14%) | 9mo | $230,000 | $148 | 63 |
| 1717 Arthur Ave | 0.32mi | 3/1.5 (-1) | 1,224 (-10%) | 1mo | $128,000 | $105 | 60 |
| 2703 W 18th St | 0.35mi | 3/2.0 (-1) | 1,219 (-10%) | 7mo | $246,000 | $202 | 56 |
| 2400 W 16th St | 0.54mi | 3/2.0 (-1) | 1,480 (+9%) | 6mo | $255,000 | $172 | 50 |
| 2326 Pretty Bayou Dr | 0.63mi | 3/2.0 (-1) | 1,440 (+6%) | 10mo | $307,000 | $213 | 48 |
| 2333 Cincinnati Ave | 0.62mi | 3/2.5 (-1) | 1,489 (+10%) | 2mo | $325,000 | $218 | 46 |
| 1409 Hickory Ave | 0.74mi | 3/2.0 (-1) | 1,282 (-6%) | 6mo | $225,000 | $176 | 46 |
| 1705 Lake Ave | 0.64mi | 3/2.0 (-1) | 1,254 (-8%) | 9mo | $249,000 | $199 | 45 |
Match score weights: distance 35% · size 25% · config 20% · recency 20%. Top-matched comps best support the ARV.
Projected returns pro-forma
-3.0% appreciation · 1.24% rent growth · sell at horizon
- IRR
- -16.3%
- Equity multiple
- 0.43×
- Total profit
- $-35,846
- Equity at exit
- $33,548
- IRR
- -11.3%
- Equity multiple
- 0.37×
- Total profit
- $-39,502
- Equity at exit
- $19,454
Cash invested: $63,000 (down + closing). Projections, not guarantees.
Landlord ↔ Tenant lean methodology
- Overall (STATE)
- 87 Strongly Landlord-Friendly
- State Florida
- 87 Strongly Landlord-Friendly · R+3
- County
- — inherits STATE
- City
- — inherits STATE
ZIP-level market 32405
- Rents YoY
- 1.2%
- Active inventory
- 380
- Price-to-rent
- 9.7×
Monthly cashflow live
- Estimated rent
- $1,936 high interval (Pro) →
- Mortgage (P&I)
- −$1,180
- Tax from tax record
- −$193 /mo · $2,317/yr
- Insurance
- −$94
- HOA
- −$0
- Vacancy / Maint / Mgmt
- −$407
- Net cashflow
- $63
Break-even live
Sensitivity live
| Price | -10% $190 | -5% $127 | +0% $63 | +5% $-1 | +10% $-64 |
|---|---|---|---|---|---|
| Rent | -10% $-90 | -5% $-14 | +0% $63 | +5% $139 | +10% $216 |
| Rate | -1.0pp $176 | -0.5pp $120 | base $63 | +0.5pp $5 | +1.0pp $-55 |
UW: 25.0% down · 7.5% · 30yr · 1.5% tax · 5.0% vac · 8.0% maint · 8.0% mgmt
Financing live
Cash to close
- Down payment
- $56,250
- Closing costs
- $6,750
- Reserves months
- —
- Total cash needed
- —
Loan-product check · same deal, 3 products live
Conventional
25% down · 7.5% · 30yr
- Down + closing
- —
- Monthly P&I
- —
- Monthly cashflow
- —
- DSCR
- —
- Eligible?
- —
Personal DTI + credit; lowest rate.
DSCR
20% down · 8.5% · 30yr
- Down + closing
- —
- Monthly P&I
- —
- Monthly cashflow
- —
- DSCR
- —
- Eligible?
- —
No personal income docs; deal must DSCR.
Hard money
10% down · 12.0% · 12mo
- Down + closing
- —
- Monthly P&I
- —
- Monthly cashflow
- —
- DSCR
- —
- Eligible?
- —
Short-term bridge; refi at stabilization.
Rent comps 7 comps
| Address | Beds | Baths | Sqft | Rent | $/sqft | DOM | Units | Dist |
|---|---|---|---|---|---|---|---|---|
| 1804 Arthur Ave Panama City, FL | 3.0 | 1.5 | 1044 | $1,795 | $1.72 | 23d | 1 | 0.26mi |
| 1710 Drake Ave Panama City, FL | 3.0 | 2.0 | 1130 | $1,850 | $1.64 | 23d | 1 | 0.36mi |
| 3722 Burnham Way Panama City, FL | 3.0 | 2.0 | 1040 | $1,600 | $1.54 | 23d | 1 | 0.83mi |
| 2602 W 12th St Panama City, FL | 3.0 | 2.0 | 1400 | $2,095 | $1.50 | 23d | 1 | 1.03mi |
| 4105 W 22nd St Unit 4105 Panama City, FL | 3.0 | 2.0 | 1000 | $1,395 | $1.40 | 23d | 1 | 1.06mi |
| 1827 Balboa Ave Panama City, FL | 3.0 | 2.5 | 1440 | $1,800 | $1.25 | 15d | 1 | 1.28mi |
| 4324 W 20th St Panama City, FL | 1.0–3.0 | 1.0–2.5 | 1000 | $1,630 | $1.63 | 15d | 12 | 1.35mi |
Listing history 3 events
-
2026-06-21days on market $225,000 Active 3 DOM
-
2026-06-18remarks 699-char remark
-
2026-06-18$225,000 Active 1 DOM
ⓘ Source: listings_history table (triggers on properties + properties_extension) + one-shot
backfill from property_details.listing_events for pre-trigger history.
Tax reassessment forecast FL · Resets to sale price
- Current annual tax
- $2,317 · $193/mo
- Projected year-2 tax
- $2,317 · $193/mo
- Expected delta
- $0/yr ($0/mo · 0.0%)
ⓘ Screening estimate from a state-policy table — verify with the county assessor before closing.
Climate risk First Street
- Flood 1/10 Low FEMA zone X (unshaded) · 0% chance over 30 yrs
- Wildfire 1/10 Low
- Heat 10/10 Extreme 7 d/yr ≥106°F today · 21 d/yr by 30 yrs out
- Wind 9/10 Extreme 99% chance of damaging wind over 30 yrs
- Air quality 1/10 Low 0 unhealthy d/yr today · 0 by 30 yrs out
Nearby sold comps map
Loading sold comps map…
Walkable amenities ~0.75 mi
Loading nearby amenities…
Taxation est. · year 1
- Rental income
- $23,236
- − Mortgage interest
- −$12,603
- − Property taxes
- −$2,317
- − Insurance
- −$1,125
- − Repairs & maintenance
- −$1,859
- − Management
- −$1,859
- − Depreciation
- −$6,545
- Taxable loss
- −$3,073
- Est. tax savings @ 24.0%
- +$737
- After-tax cash flow
- $1,493/yr
For passive investors: Depreciation is non-cash, so a rental often shows a tax loss while cash-flowing — sheltering income. Rental losses are passive: they offset passive income freely, and up to $25,000/yr can offset ordinary (W-2) income if you actively participate and your MAGI is under $100k (phasing out to $0 by $150k); unused losses carry forward. On sale, claimed depreciation is recaptured at up to 25%, and gains may owe capital-gains tax (a 1031 exchange can defer both). Figures are a year-1 estimate at your 24.0% rate — not tax advice; consult a CPA.
Schools (NCES district)
- District
- Bay
- NCES district ID
- 1200090
- Math proficiency
- 51% ▼ -8.00%
- Reading proficiency
- 51% ▼ -7.00%
- Median HH income
- $47,740
- Composite
- 43.41/100
- National rank
- #3014
- State rank
- #29 of 73 in FL
Livability — Panama City
- Score
- 72/100
- State rank
- #350
- US rank
- #5823
Category grades
Schools grade is shown separately in the Schools card above.
Census & demographics
- Census place
- Panama City, FL
- County
- Bay County · 163,593 people
- City population
- 91,445
- Metro
- Panama City, FL
- Population (ZIP)
- 29,984
- Household income
- $73,373
- Rent vs Own
- Severe rent burden
- 1008.0
Population outlook (Bay County) Hauer SSP2
- Today (2025)
- 206,264 people
- By 2030
- 217,740 · +5.6%
- By 2040
- 238,738 · +15.7%
- By 2050
- 255,545 · +23.9%
- By 2075
- 288,295 · +39.8%
- By 2100
- 288,638 · +39.9%
Race, ethnicity, and origin ACS 2023
- Neighborhood character
- Predominantly White (67%)
- Race & ethnicity
- White 67% Black 17% Two or more races 8% Hispanic / Latino 7% Native American 1%
- Hispanic origin (detail)
- Mexican 2% Puerto Rican 3%
- Common ancestry
- Slovak 4% Lithuanian 2% Romanian 2%
- Foreign-born
- 7% · Canada
- Languages at home
- 89% English-only · Spanish 6% Arabic 1% French/Haitian/Cajun 1%
Political lean MEDSL · Bay
- 2024 margin
- Solid R (+47.4) · D 25.8% · R 73.1% · Other 1.1%
- 2008→2024 swing
- -6.6pp toward R · 2008: -40.7pp · 2024: -47.4pp
- All cycles
- 2024: R+47.4 2020: R+43.5 2016: R+46.3 2012: R+43.6 2008: R+40.7
Not yet ingested
- Civics
- —
Market trends
- HPI YoY
- ▼ -217.88%
- Current HPI
- 262.7854
- Rent YoY
- ▲ 1.24%
- Metro
- Panama City, FL
- State GDP YoY
- ▲ 3.28%
- F500 in state
- 36
Industry mix (Fortune 500 HQ in FL)
| Industry | F500 HQs | Revenue |
|---|---|---|
| Industrial Technology | 2 | $29B |
|
||
| Insurance | 2 | $17B |
|
||
| Retail | 1 | $60B |
|
||
| Technology Distribution | 1 | $58B |
|
||
| Homebuilding | 1 | $35B |
|
||
| Technology Manufacturing | 1 | $35B |
|
||
Price history
+40.7% since first listed10 events — show timeline
- 2026-06-15 Listed $225,000 CPARMLS
- 2024-09-30 Listing Removed — CPARMLS
- 2024-05-28 Listed $210,000 CPARMLS
- 2021-12-28 Sold (Public Records) $148,000 Public Records
- 2021-12-09 Listing Removed — CPARMLS
- 2021-12-08 Sold (MLS) $148,000 CPARMLS
- 2021-11-09 Listed $175,000 CPARMLS
- 2020-03-10 Listing Removed — CPARMLS
- 2020-02-17 Listed $159,000 CPARMLS
- 2019-11-06 Listed $159,900 CPARMLS
Property tax history
+8.6%/yrLatest (2025): $2,317 · +3.4% YoY. Source: county tax records.
Cash-flow waterfall
monthlySold comps — $/sqft
last 12 mo · ≤1 miLoading sold comps…