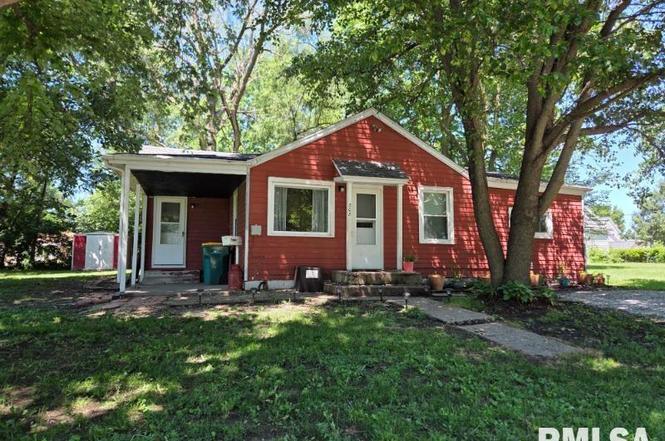
308 S Bonham St · Macomb, IL
Flood risk 1/10 · Minimal
- FEMA flood zone
- —
- Chance of flooding over 30 yrs
- 0.0%
- Est. flood insurance / yr
- —
Fire risk 1/10 · Minimal
- Est. fire insurance / yr
- $804 – $1,492
Heat risk 3/10 · Minor
- Hot days now (above 107°F)
- 7 days/yr
- Hot days in 30 yrs
- 17 days/yr
Wind risk 2/10 · Minimal
- Chance of severe wind over 30 yrs
- —
Air-quality risk 2/10 · Minimal
- Unhealthy air days now
- 1 days/yr
- Unhealthy air days in 30 yrs
- 1 days/yr
Risk factors via First Street. Map © Google.
Why this score? — see what drove the C+ grade
The composite is a weighted blend of 9 inputs, each scored 0–100. Each bar is that input's sub-score; the figure is the points it added to the 100-point composite (weight × sub-score).
- Cash flow +27.2/30.0
- DSCR +9.5/10.0
- 1% rule +8.8/10.0
- ARV discount +7.5/15.0
- Livability +3.5/5.0
- Rent growth +2.5/5.0
- Condition / age +2.5/5.0
- Schools +1.8/10.0
- Appreciation +0.0/10.0
$69,900
🖨 Deal sheet 📄 Offer letter ✓ Due diligence
Listing remarks
This cute 1104 SF, 3-bedroom bungalow has many updates and ready for you to move in! New improvements in 2026 include all carpet in bedrooms and hallway, ceiling fans and light fixtures, new plumbing in kitchen and bath, stainless kitchen stove, and even a new sewer line to the street! The furnace & water heater were replaced in 2022, and leaf filters installed on gutters in 2020. The large living room has hardwood floors and the eat-in kitchen is spacious and inviting. A covered porch at the side of the home is a perfect place to relax. Located near east end shopping, this home is priced to sell at only $69,900! Call for your appointment today!
Key facts
- Covered porch
- New plumbing
- Leaf filters
Tags
Property features AI
Exterior
- Parking: Gravel parking
- Utilities: Public water; Public sewer
- Home design: Single-family residence; One-story with additional/upper/lower levels and basement; Shingle roof
- Construction: Built in 1950; Crawl space basement
- Exterior features: Shed(s); Level lot; Paved road access
Interior
- Kitchen: Refrigerator; Vinyl flooring in kitchen
- Bedrooms: 3 bedrooms (main level bedrooms; egress windows in bedrooms); Bedroom 1 approximately 11.03 x 11.05 (main level, carpet); Bedroom 2 approximately 11.05 x 8.05 (main level, carpet); Bedroom 3 approximately 11.04 x 7.1 (main level, carpet)
- Flooring: Carpet in bedrooms; Hardwood in living room; Vinyl in kitchen and laundry
- Bathrooms: 1 full bathroom
- Heating & cooling: Forced air heating; Central air conditioning
- Interior features: Ceiling fan(s); Refrigerator
- Laundry & utility: Main level laundry room (approx. 11.02 x 7.02, vinyl flooring)
Neighborhood map
What this means for you Summary
Snapshot
- This is a 3-bed/1.0-bath other listed at $70k.
Deal economics
- At list price, monthly cash flow is $201 ($2k/yr) — positive.
- The deal already cash-flows at list — no discount required.
- Meets the 1% rule at list price ($962 rent vs $70k).
- Cap rate 9.7% vs local median 6.2% in Macomb — top-decile yield for the area; either an underpriced asset or a hidden risk that comps aren't pricing in. Stress-test before assuming the spread holds.
Location & tenants
- Location reads 70/100 on livability (#379 in IL) — a middle-class / working-renter tenant base. Strengths: cost of living A+, health & safety A+, housing B; Watch: crime D, amenities D, commute F.
- Macomb CUSD 185 (town): math 19% / reading 26% proficiency, ranked #410 of 620 in IL (top 66%) — low school quality limits family demand, transient renter base, plan for 1-2y turnover.
- Zoned schools: Macomb Senior High School (math 27% / reading 37%, grade F, #157 of 693 statewide, top 25%, 622 students, 0% FRL) — zoned schools average 0% FRL vs 40% district-wide (40 pts lower); this property's tenant base skews higher-income than the district average.
- Market conditions: 135 active listings in the ZIP; 1 comparable units currently listed for rent nearby.
Forward outlook
- Local home prices are declining (-3.0%/yr); year-one equity from $483 of loan paydown is wiped out by about $2k of value loss. Plan a longer hold.
- At projected returns (-3.0% appreciation + 3.0% rent growth), your $20k cash investment doubles in ~10 years — after that, you're playing with house money.
Negotiation context
- Only 2 days on market — expect competitive offers; lowballing is unlikely to land.
Risks & watch-outs
- Watch-outs: property tax is 2.8% of price; built in 1950 — expect roof / HVAC / electrical / plumbing capex.
Questions for the listing agent
- Built in 1950 — when were the roof, HVAC, electrical panel, plumbing, and water heater last replaced?
- Property tax is high relative to price — has the assessment been appealed recently, and will the sale trigger a re-assessment?
- Is there a deadline driving the sale (1031 exchange, divorce, estate, relocation)? That informs how much negotiation room exists.
- Schools are D-rated, which usually means shorter tenancies and higher turnover. Who's the typical renter profile here, and what's been the actual vacancy rate?
- Crime grade is D in this area — have there been break-ins, vandalism, or insurance claims at this property in the last 3 years? What carrier currently insures it and at what premium?
- What's the average days-on-market for RENTAL listings here right now (not sales)? A rising rental-DOM trend means longer vacancies and softer asking-rent achievability than the comps imply.
- What's the recent tenant-quality profile in this submarket — average credit score on applications, eviction rate, late-payment / NSF rate, and stable-employment percentage? A property-management company in the area should have these aggregated.
- How much new for-sale + rental construction is in the pipeline within 1–3 miles? Heavy new supply typically softens prices + rents 12–24 months out; constrained supply supports both.
Investment metrics
- 1% rule
- 1.38% ✓
- Cap rate
- 9.74%
- Cash-on-cash
- 12.31%
- DSCR
- 1.55
- GRM
- 6.1
CMA / ARV
No comps found within radius.
Projected returns pro-forma
-3.0% appreciation · 3.0% rent growth · sell at horizon
- IRR
- 2.0%
- Equity multiple
- 1.08×
- Total profit
- $1,519
- Equity at exit
- $10,422
- IRR
- 11.7%
- Equity multiple
- 1.92×
- Total profit
- $18,034
- Equity at exit
- $6,044
Cash invested: $19,572 (down + closing). Projections, not guarantees.
Landlord ↔ Tenant lean methodology
- Overall (STATE)
- 43 Moderately Tenant-Leaning
- State Illinois
- 43 Moderately Tenant-Leaning · D+7
- County
- — inherits STATE
- City
- — inherits STATE
ZIP-level market 61455
- Home prices YoY
- -33.3%
- Active inventory
- 135
- Price-to-rent
- 6.1×
Monthly cashflow live
- Estimated rent
- $962 medium interval (Pro) →
- Mortgage (P&I)
- −$367
- Tax from tax record
- −$164 /mo · $1,964/yr
- Insurance
- −$29
- HOA
- −$0
- Vacancy / Maint / Mgmt
- −$202
- Net cashflow
- $201
Break-even live
UW: 25.0% down · 7.5% · 30yr · 1.5% tax · 5.0% vac · 8.0% maint · 8.0% mgmt
Financing live
Cash to close
- Down payment
- $17,475
- Closing costs
- $2,097
- Reserves months
- —
- Total cash needed
- —
Loan-product check · same deal, 3 products live
Conventional
25% down · 7.5% · 30yr
- Down + closing
- —
- Monthly P&I
- —
- Monthly cashflow
- —
- DSCR
- —
- Eligible?
- —
Personal DTI + credit; lowest rate.
DSCR
20% down · 8.5% · 30yr
- Down + closing
- —
- Monthly P&I
- —
- Monthly cashflow
- —
- DSCR
- —
- Eligible?
- —
No personal income docs; deal must DSCR.
Hard money
10% down · 12.0% · 12mo
- Down + closing
- —
- Monthly P&I
- —
- Monthly cashflow
- —
- DSCR
- —
- Eligible?
- —
Short-term bridge; refi at stabilization.
Rent comps 1 comps
| Address | Beds | Baths | Sqft | Rent | $/sqft | DOM | Units | Dist |
|---|---|---|---|---|---|---|---|---|
| 902 N Charles St Macomb, IL | 2.0 | 1.5 | 840 | $695 | $0.83 | 43d | 1 | 1.42mi |
Listing history 3 events
-
2026-06-19days on market $69,900 Active 2 DOM
-
2026-06-17remarks 655-char remark
-
2026-06-17$69,900 Active 1 DOM
ⓘ Source: listings_history table (triggers on properties + properties_extension) + one-shot
backfill from property_details.listing_events for pre-trigger history.
Tax reassessment forecast IL · Partial reset (capped growth)
- Current annual tax
- $1,964 · $164/mo
- Projected year-2 tax
- $1,964 · $164/mo
- Expected delta
- $0/yr ($0/mo · 0.0%)
ⓘ Screening estimate from a state-policy table — verify with the county assessor before closing.
Climate risk First Street
- Flood 1/10 Low 0% chance over 30 yrs
- Wildfire 1/10 Low
- Heat 3/10 Moderate 7 d/yr ≥107°F today · 17 d/yr by 30 yrs out
- Wind 2/10 Low
- Air quality 2/10 Low 1 unhealthy d/yr today · 1 by 30 yrs out
Nearby sold comps map
Loading sold comps map…
Walkable amenities ~0.75 mi
Loading nearby amenities…
Taxation est. · year 1
- Rental income
- $11,545
- − Mortgage interest
- −$3,915
- − Property taxes
- −$1,964
- − Insurance
- −$350
- − Repairs & maintenance
- −$924
- − Management
- −$924
- − Depreciation
- −$2,033
- Taxable income
- $1,436
- Est. tax owed @ 24.0%
- −$345
- After-tax cash flow
- $2,064/yr
For passive investors: Depreciation is non-cash, so a rental often shows a tax loss while cash-flowing — sheltering income. Rental losses are passive: they offset passive income freely, and up to $25,000/yr can offset ordinary (W-2) income if you actively participate and your MAGI is under $100k (phasing out to $0 by $150k); unused losses carry forward. On sale, claimed depreciation is recaptured at up to 25%, and gains may owe capital-gains tax (a 1031 exchange can defer both). Figures are a year-1 estimate at your 24.0% rate — not tax advice; consult a CPA.
Schools (NCES district)
- District
- Macomb CUSD 185
- NCES district ID
- 1723920
- Math proficiency
- 19% ▼ -7.00%
- Reading proficiency
- 26% ▼ -8.00%
- Median HH income
- $34,162
- Composite
- 18.45/100
- National rank
- #8927
- State rank
- #410 of 620 in IL
Livability — Macomb
- Score
- 70/100
- State rank
- #379
- US rank
- #7918
Category grades
Schools grade is shown separately in the Schools card above.
Census & demographics
- Census place
- Macomb, IL
- County
- McDonough County · 17,317 people
- City population
- 17,317
- Metro
- Macomb, IL
- Population (ZIP)
- 17,317
- Household income
- $48,679
- Rent vs Own
- Severe rent burden
- 1062.0
Population outlook (McDonough County) Hauer SSP2
- Today (2025)
- 33,242 people
- By 2030
- 33,318 · +0.2%
- By 2040
- 33,520 · +0.8%
- By 2050
- 33,630 · +1.2%
- By 2075
- 33,657 · +1.2%
- By 2100
- 33,127 · -0.3%
Race, ethnicity, and origin ACS 2023
- Neighborhood character
- Predominantly White (81%)
- Race & ethnicity
- White 81% Black 9% Two or more races 5% Hispanic / Latino 5% Asian 3%
- Common ancestry
- Romanian 3% Italian 3% Iranian 2%
- Foreign-born
- 4% · Canada, South Korea, China
- Languages at home
- 94% English-only · Spanish 2% Other Indo-European 1% Russian/Polish/Slavic 1%
Political lean MEDSL · McDonough
- 2024 margin
- R (+18.9) · D 39.7% · R 58.5% · Other 1.8%
- 2008→2024 swing
- -24.4pp toward R · 2008: 5.6pp · 2024: -18.9pp
- All cycles
- 2024: R+18.9 2020: R+16.6 2016: R+11.7 2012: R+1.5 2008: D+5.6
Not yet ingested
- Civics
- —
Market trends
- HPI YoY
- ▼ -70.20%
- Current HPI
- 140.4351
- Rent YoY
- —
- Metro
- Macomb, IL
- State GDP YoY
- ▲ 1.59%
- F500 in state
- 60
Industry mix (Fortune 500 HQ in IL)
| Industry | F500 HQs | Revenue |
|---|---|---|
| Insurance | 4 | $201B |
|
||
| Consumer Goods | 4 | $87B |
|
||
| Industrial Machinery | 3 | $64B |
|
||
| Healthcare | 2 | $55B |
|
||
| Retail / Pharmacy | 1 | $148B |
|
||
| Agriculture / Food | 1 | $86B |
|
||
Price history
2 events — show timeline
- 2026-06-17 Listed $69,900 RMLSA as Distributed by MLS Grid
- 2019-04-08 Listing Removed — RMLSA as Distributed by MLS Grid
Property tax history
+2.3%/yrLatest (2024): $1,964 · -2.5% YoY. Source: county tax records.
Cash-flow waterfall
monthlySold comps — $/sqft
last 12 mo · ≤1 miLoading sold comps…