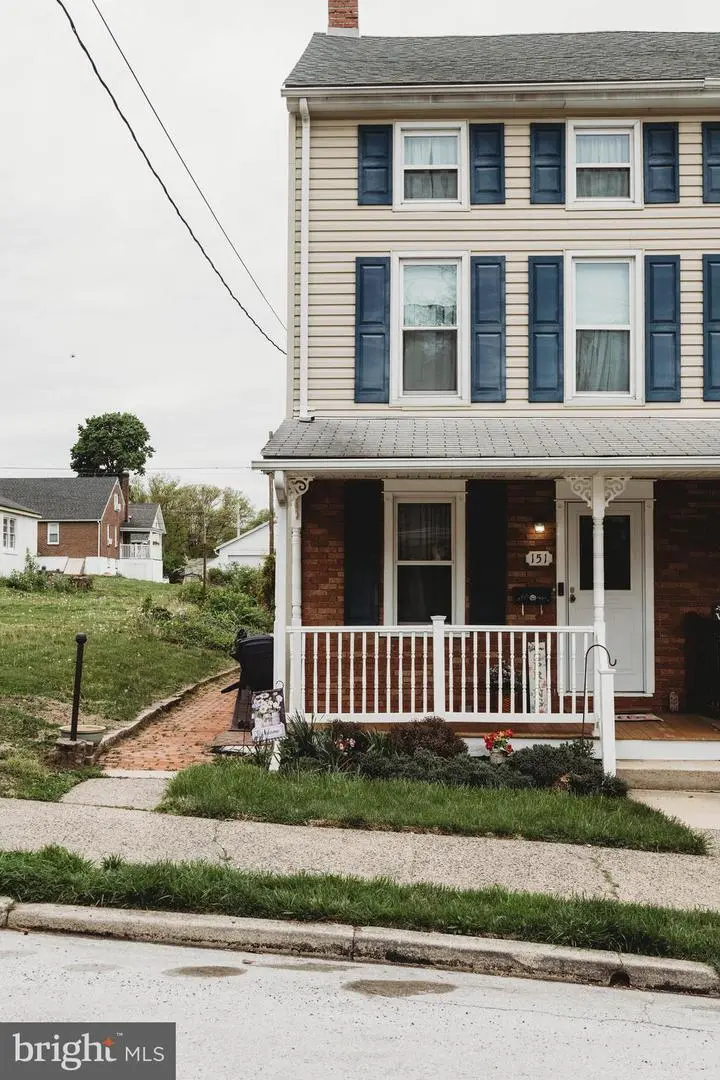
151 Walnut St · Spring City, PA
Flood risk 1/10 · Minimal
- FEMA flood zone
- X (unshaded)
- Chance of flooding over 30 yrs
- 0.0%
- Est. flood insurance / yr
- $473 – $860
Fire risk 1/10 · Minimal
- Est. fire insurance / yr
- $511 – $949
Heat risk 6/10 · Moderate
- Hot days now (above 101°F)
- 7 days/yr
- Hot days in 30 yrs
- 15 days/yr
Wind risk 5/10 · Moderate
- Chance of severe wind over 30 yrs
- 26.0%
Air-quality risk 4/10 · Minor
- Unhealthy air days now
- 3 days/yr
- Unhealthy air days in 30 yrs
- 6 days/yr
Risk factors via First Street. Map © Google.
Why this score? — see what drove the C grade
The composite is a weighted blend of 9 inputs, each scored 0–100. Each bar is that input's sub-score; the figure is the points it added to the 100-point composite (weight × sub-score).
- Cash flow +18.3/30.0
- ARV discount +15.0/15.0
- Schools +6.1/10.0
- DSCR +5.8/10.0
- 1% rule +4.7/10.0
- Livability +4.0/5.0
- Rent growth +2.5/5.0
- Condition / age +2.5/5.0
- Appreciation +0.0/10.0
$265,000
🖨 Deal sheet 📄 Offer letter ✓ Due diligence
Listing remarks
Charming twin in the heart of Spring City, meticulously cared for by a long-time owner and rich with character. Originally built in 1850, this home blends historic charm with thoughtful updates completed over the years, offering a unique living space you won’t find in newer construction and the perfect opportunity to add your own modern touches over time. Features include beautiful flooring in the kitchen area, spacious living areas, and a private yard ideal for relaxing or entertaining. Enjoy the convenience of first-floor laundry and two off-street parking spots. Located within the Spring-Ford Area School District. Being sold as-is, and conveniently located near local shops, dining,
Key facts
- 2 parking spots
- Built 1850
- Listed 5 days
Property features AI
Exterior
- Parking: Two off-street parking spaces; On-street parking available; Total of 2 garage/parking spaces
- Utilities: Public water; Public sewer; 100 amp electric service; Hot water: electric; Heating fuel: natural gas and electric
- Home design: Semi-detached structure; Above-grade living space reported (finished area estimated)
- Construction: Aluminum siding and brick exterior; Stone foundation
- Exterior features: Not in a federal flood zone
Interior
- Bedrooms: Two bedrooms on the first upper level; Two bedrooms on the second upper level
- Bathrooms: One full bathroom (upper levels); One half bathroom on the main level
- Heating & cooling: Forced air heating; Hot water baseboard heating; Wall unit cooling; Ductless / mini-split cooling
- Interior features: Basement with sump pump; Not furnished; Living area reported as estimated
Neighborhood map
What this means for you Summary
Snapshot
- This is a 4-bed/1.0-bath single-family listed at $265k.
Deal economics
- At list price, monthly cash flow is $244 ($3k/yr) — positive.
- The deal already cash-flows at list — no discount required.
- To meet the 1% rule (rent ≥ 1% of price), the offer needs to be $257k (3.1% below list).
- Recommended offer: $257k (3.1% below list) — sets the bar for 1% rule.
Location & tenants
- Location reads 79/100 on livability (#259 in PA, #2,250 nationally) — a middle-class / working-renter tenant base. Strengths: crime A+, cost of living A+, housing A+; Watch: amenities F, commute D-.
- Spring-Ford Area SD (suburban): math 58% / reading 78% proficiency, ranked #23 of 539 in PA (top 4%) — acceptable for families but not a draw, mixed tenant base, ~2y average lease; only 11% free/reduced lunch — higher-income household profile.
- Market conditions: 13 active listings in the ZIP; 9 comparable units currently listed for rent nearby; rentals lingering (median 44d on market — plan ~5-8 weeks vacancy on turnover, expect pricing pressure); 56% of comp listings sitting > 30 days — soft ceiling on asking rent; solid renter incomes; 1,513 units permitted in Chester County in 2024 (354 in 5+ unit buildings).
- This rent runs 32% of the median local income ($97k/yr) — at the standard rent-burdened threshold; future hikes will face affordability resistance.
Forward outlook
- Local home prices are declining (-3.0%/yr); year-one equity from $2k of loan paydown is wiped out by about $8k of value loss. Plan a longer hold.
- Chester County population projected at +6% by 2050 — modest demand growth; plan on rents tracking national, not racing it.
Negotiation context
- Only 5 days on market — expect competitive offers; lowballing is unlikely to land.
Risks & watch-outs
- Watch-outs: built in 1850 — expect roof / HVAC / electrical / plumbing capex.
- Climate carrying-cost: moderate wind risk, 26% chance of damaging wind over 30y; extreme-heat days projected 7→15/yr by 2055 (HVAC capex compounding) — expect insurance premiums to compound above CPI over the hold.
Questions for the listing agent
- Built in 1850 — when were the roof, HVAC, electrical panel, plumbing, and water heater last replaced?
- Is there a deadline driving the sale (1031 exchange, divorce, estate, relocation)? That informs how much negotiation room exists.
- Schools are A-rated — typically a magnet for longer-tenancy family renters. What's the average tenant stay here, and is there a school-zone premium baked into asking?
- What's the average days-on-market for RENTAL listings here right now (not sales)? A rising rental-DOM trend means longer vacancies and softer asking-rent achievability than the comps imply.
- What's the recent tenant-quality profile in this submarket — average credit score on applications, eviction rate, late-payment / NSF rate, and stable-employment percentage? A property-management company in the area should have these aggregated.
- How much new for-sale + rental construction is in the pipeline within 1–3 miles? Heavy new supply typically softens prices + rents 12–24 months out; constrained supply supports both.
Investment metrics
- 1% rule
- 0.97% ✗
- Cap rate
- 7.40%
- Cash-on-cash
- 3.95%
- DSCR
- 1.18
- GRM
- 8.6
CMA / ARV
- ARV (median comp)
- $383,871
- List price
- $265,000
- Delta
- -30.97%
- Verdict
- UNDERPRICED
- Comps
- 20 within 1.0 mi
Show comp detail 12 sales within ~0.75 mi
| Address | Dist | Beds/Ba | Sqft | Sold | Price | $/sf | Match |
|---|---|---|---|---|---|---|---|
| 205 S And K St | 0.12mi | 4/2.5 | 1,602 (+2%) | 4mo | $422,250 | $264 | 81 |
| 21 N Church St | 0.34mi | 3/1.5 (-1) | 1,629 (+4%) | 6mo | $345,000 | $212 | 65 |
| 116 Pikeland Ave | 0.10mi | 3/2.5 (-1) | 1,373 (-12%) | 2mo | $445,500 | $324 | 62 |
| 149 Hall St | 0.30mi | 3/1.0 (-1) | 1,704 (+9%) | 8mo | $260,000 | $153 | 59 |
| 210 New St | 0.61mi | 4/2.0 | 1,635 (+4%) | 3mo | $387,500 | $237 | 57 |
| 314 Chestnut St | 0.33mi | 4/1.0 | 1,680 (+7%) | 20mo | $302,000 | $180 | 55 |
| 424 Arch St | 0.69mi | 3/1.0 (-1) | 1,482 (-5%) | 1mo | $417,990 | $282 | 53 |
| 526 New St | 0.58mi | 4/1.5 | 1,691 (+8%) | 7mo | $360,000 | $213 | 52 |
| 431 Walnut St | 0.22mi | 4/1.0 | 1,764 (+13%) | 21mo | $390,000 | $221 | 51 |
| 804 Maple Ave | 0.68mi | 3/2.0 (-1) | 1,586 (+1%) | 8mo | $370,000 | $233 | 51 |
| 121 N Cedar St | 0.57mi | 3/1.0 (-1) | 1,506 (-4%) | 20mo | $347,000 | $230 | 46 |
| 48 Quail Cir | 0.37mi | 4/2.5 | 1,778 (+14%) | 22mo | $515,000 | $290 | 36 |
Match score weights: distance 35% · size 25% · config 20% · recency 20%. Top-matched comps best support the ARV.
Projected returns pro-forma
-3.0% appreciation · 3.0% rent growth · sell at horizon
- IRR
- -10.1%
- Equity multiple
- 0.63×
- Total profit
- $-27,382
- Equity at exit
- $39,512
- IRR
- -0.7%
- Equity multiple
- 0.95×
- Total profit
- $-3,781
- Equity at exit
- $22,912
Cash invested: $74,200 (down + closing). Projections, not guarantees.
Landlord ↔ Tenant lean methodology
- Overall (STATE)
- 62 Landlord-Friendly
- State Pennsylvania
- 62 Landlord-Friendly · EVEN
- County
- — inherits STATE
- City
- — inherits STATE
ZIP-level market 19475
- Home prices YoY
- -26.7%
- Active inventory
- 13
- Price-to-rent
- 8.6×
Monthly cashflow live
- Estimated rent
- $2,568 high interval (Pro) →
- Mortgage (P&I)
- −$1,390
- Tax from tax record
- −$285 /mo · $3,415/yr
- Insurance
- −$110
- HOA
- −$0
- Vacancy / Maint / Mgmt
- −$539
- Net cashflow
- $244
Break-even live
UW: 25.0% down · 7.5% · 30yr · 1.5% tax · 5.0% vac · 8.0% maint · 8.0% mgmt
Financing live
Cash to close
- Down payment
- $66,250
- Closing costs
- $7,950
- Reserves months
- —
- Total cash needed
- —
Loan-product check · same deal, 3 products live
Conventional
25% down · 7.5% · 30yr
- Down + closing
- —
- Monthly P&I
- —
- Monthly cashflow
- —
- DSCR
- —
- Eligible?
- —
Personal DTI + credit; lowest rate.
DSCR
20% down · 8.5% · 30yr
- Down + closing
- —
- Monthly P&I
- —
- Monthly cashflow
- —
- DSCR
- —
- Eligible?
- —
No personal income docs; deal must DSCR.
Hard money
10% down · 12.0% · 12mo
- Down + closing
- —
- Monthly P&I
- —
- Monthly cashflow
- —
- DSCR
- —
- Eligible?
- —
Short-term bridge; refi at stabilization.
Rent comps 9 comps
| Address | Beds | Baths | Sqft | Rent | $/sqft | DOM | Units | Dist |
|---|---|---|---|---|---|---|---|---|
| 902 Magnolia Ln Spring City, PA | 3.0 | 2.5 | 1798 | $3,200 | $1.78 | 1d | 1 | 0.35mi |
| 50 Clover Pl #50 Royersford, PA | 3.0 | 3.5 | 1742 | $2,800 | $1.61 | 44d | 1 | 0.55mi |
| 5 Cameron Ct Royersford, PA | 3.0 | 2.5 | 1814 | $2,700 | $1.49 | 44d | 1 | 0.58mi |
| 263 Washington St Royersford, PA | 3.0 | 1.5 | 1212 | $2,600 | $2.15 | 44d | 1 | 0.61mi |
| 337 Bridge St Spring City, PA | 3.0 | 1.0 | 1611 | $2,300 | $1.43 | 18d | 1 | 0.77mi |
| 431 Main St Unit 2ND FLOOR Royersford, PA | 3.0 | 1.0 | 2025 | $2,200 | $1.09 | 4d | 1 | 0.88mi |
| 431 Main St Unit 2ND FLOOR Royersford, PA | 3.0 | 1.0 | 2025 | $2,400 | $1.19 | 44d | 1 | 0.88mi |
| 19 Roboda Blvd Royersford, PA | 3.0 | 1.5 | 2000 | $2,500 | $1.25 | 44d | 1 | 1.15mi |
| 170 Providence Forge Rd Royersford, PA | 3.0 | 2.5 | 1820 | $2,400 | $1.32 | 24d | 1 | 1.29mi |
Listing history 5 events
-
2026-05-13status Pending 790-char remark
-
2026-05-08$265,000 Active 790-char remark
-
2026-04-30historical $265,000 790-char remark
-
1979-08-01soldstatus $32,000
-
1979-08-01soldstatus $32,000
ⓘ Source: listings_history table (triggers on properties + properties_extension) + one-shot
backfill from property_details.listing_events for pre-trigger history.
Tax reassessment forecast PA · Partial reset (capped growth)
- Current annual tax
- $3,415 · $285/mo
- Projected year-2 tax
- $3,801 · $317/mo
- Expected delta
- +$386/yr (+$32/mo · 11.3%)
ⓘ Screening estimate from a state-policy table — verify with the county assessor before closing.
Climate risk First Street
- Flood 1/10 Low FEMA zone X (unshaded) · 0% chance over 30 yrs
- Wildfire 1/10 Low
- Heat 6/10 Major 7 d/yr ≥101°F today · 15 d/yr by 30 yrs out
- Wind 5/10 Major 26% chance of damaging wind over 30 yrs
- Air quality 4/10 Moderate 3 unhealthy d/yr today · 6 by 30 yrs out
Nearby sold comps map
Loading sold comps map…
Walkable amenities ~0.75 mi
Loading nearby amenities…
Taxation est. · year 1
- Rental income
- $30,817
- − Mortgage interest
- −$14,844
- − Property taxes
- −$3,415
- − Insurance
- −$1,325
- − Repairs & maintenance
- −$2,465
- − Management
- −$2,465
- − Depreciation
- −$7,709
- Taxable loss
- −$1,406
- Est. tax savings @ 24.0%
- +$338
- After-tax cash flow
- $3,267/yr
For passive investors: Depreciation is non-cash, so a rental often shows a tax loss while cash-flowing — sheltering income. Rental losses are passive: they offset passive income freely, and up to $25,000/yr can offset ordinary (W-2) income if you actively participate and your MAGI is under $100k (phasing out to $0 by $150k); unused losses carry forward. On sale, claimed depreciation is recaptured at up to 25%, and gains may owe capital-gains tax (a 1031 exchange can defer both). Figures are a year-1 estimate at your 24.0% rate — not tax advice; consult a CPA.
Schools (NCES district)
- District
- Spring-Ford Area SD
- NCES district ID
- 4222560
- Math proficiency
- 58% ▼ -11.00%
- Reading proficiency
- 78% ▼ -5.00%
- Median HH income
- $84,931
- Composite
- 60.97/100
- National rank
- #802
- State rank
- #23 of 539 in PA
Livability — Spring City
- Score
- 79/100
- State rank
- #259
- US rank
- #2250
Category grades
Schools grade is shown separately in the Schools card above.
Census & demographics
- Census place
- Spring City, PA
- County
- Chester County · 432,350 people
- City population
- 12,298
- Metro
- Philadelphia-Camden-Wilmington, PA-NJ-DE-MD
- Population (ZIP)
- 12,298
- Household income
- $97,146
- Rent vs Own
- Severe rent burden
- 257.0
Population outlook (Chester County) Hauer SSP2
- Today (2025)
- 546,756 people
- By 2030
- 559,441 · +2.3%
- By 2040
- 576,377 · +5.4%
- By 2050
- 580,602 · +6.2%
- By 2075
- 581,575 · +6.4%
- By 2100
- 540,922 · -1.1%
Race, ethnicity, and origin ACS 2023
- Neighborhood character
- Predominantly White (78%)
- Race & ethnicity
- White 78% Hispanic / Latino 9% Black 5% Two or more races 5% Asian 4%
- Hispanic origin (detail)
- Puerto Rican 6% Dominican 1%
- Common ancestry
- Romanian 8% Slovak 3% Italian 2%
- Foreign-born
- 4% · Canada, China
- Languages at home
- 94% English-only · Spanish 2% Other Indo-European 1% Other Asian/Pacific 1%
Political lean MEDSL · Chester
- 2024 margin
- D (+14.5) · D 56.7% · R 42.2% · Other 1.0%
- 2008→2024 swing
- +5.2pp toward D · 2008: 9.2pp · 2024: 14.5pp
- All cycles
- 2024: D+14.5 2020: D+17.0 2016: D+9.2 2012: R+0.4 2008: D+9.2
Not yet ingested
- Civics
- —
Market trends
- HPI YoY
- ▼ -99.68%
- Current HPI
- 274.2886
- Rent YoY
- —
- Metro
- Philadelphia-Camden-Wilmington, PA-NJ-DE-MD
- State GDP YoY
- ▲ 1.68%
- F500 in state
- 34
Industry mix (Fortune 500 HQ in PA)
| Industry | F500 HQs | Revenue |
|---|---|---|
| Healthcare | 2 | $309B |
|
||
| Insurance | 2 | $27B |
|
||
| Telecommunications / Media | 1 | $124B |
|
||
| Industrial Distribution | 1 | $22B |
|
||
| Financial Services | 1 | $20B |
|
||
| Chemicals / Materials | 1 | $18B |
|
||
Price history
+818.8% since first listed6 events — show timeline
- 2026-06-12 Sold (MLS) $294,000 BRIGHT MLS
- 2026-05-13 Pending — BRIGHT MLS
- 2026-05-08 Listed $265,000 BRIGHT MLS
- 2026-04-30 Coming Soon $265,000 BRIGHT MLS
- 1979-08-01 Sold (Public Records) $32,000 Public Records
- 1979-08-01 Sold (Public Records) $32,000 Public Records
Property tax history
+2.3%/yrLatest (2026): $3,415 · +3.9% YoY. Source: county tax records.
Cash-flow waterfall
monthlySold comps — $/sqft
last 12 mo · ≤1 miLoading sold comps…