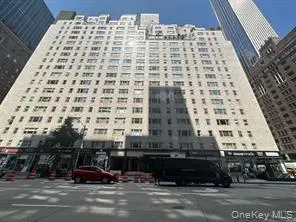
100 West 57th St Unit 2G · New York, NY
Flood risk 1/10 · Minimal
- FEMA flood zone
- X (unshaded)
- Chance of flooding over 30 yrs
- 0.0%
- Est. flood insurance / yr
- $507 – $1,088
Fire risk 2/10 · Minimal
- Est. fire insurance / yr
- $691 – $1,283
Heat risk 6/10 · Moderate
- Hot days now (above 99°F)
- 7 days/yr
- Hot days in 30 yrs
- 15 days/yr
Wind risk 6/10 · Moderate
- Chance of severe wind over 30 yrs
- 27.0%
Air-quality risk 4/10 · Minor
- Unhealthy air days now
- 5 days/yr
- Unhealthy air days in 30 yrs
- 6 days/yr
Risk factors via First Street. Map © Google.
Why this score? — see what drove the C- grade
The composite is a weighted blend of 9 inputs, each scored 0–100. Each bar is that input's sub-score; the figure is the points it added to the 100-point composite (weight × sub-score).
- Cash flow +15.0/30.0
- ARV discount +7.5/15.0
- Appreciation +6.8/10.0
- 1% rule +5.0/10.0
- DSCR +5.0/10.0
- Schools +5.0/10.0
- Livability +3.8/5.0
- Rent growth +3.6/5.0
- Condition / age +2.5/5.0
$99,900
🖨 Deal sheet (PDF) 📄 Offer letter ✓ Due diligence
Listing remarks
Spacious One-Bedroom Apartment in Prime Manhattan Location! Discover this inviting one-bedroom apartment situated on the second floor of a well-maintained building in the heart of Manhattan, New York. This charming unit features a generous layout with a bright living room, a dedicated dining area, and an eat-in kitchen equipped with sleek stainless steel appliances. The oversized bedroom provides ample space for comfort and relaxation, complemented by a full bathroom and beautiful hardwood flooring throughout. Perfectly positioned near top-rated schools, shopping centers, public transportation, and the iconic Madison Square Garden, this home offers the ideal blend of convenience and city l
Key facts
- Second floor
- Oversized bedroom
- Eat-in kitchen
Tags
Property features AI
Finance
- HOA & community: Monthly association fee (includes hot water, sewer, water, heat); Association amenities include a park; Additional monthly fee applies
Exterior
- Parking: On-street parking
- Utilities: Public sewer; Trash collection (public)
- Home design: Stock cooperative; One-level layout; Entry level: 2
- Construction: Brick construction
- Exterior features: Brick exterior; Near public transit; Near school; Near shops; Not waterfront
Interior
- Kitchen: Gas range; Microwave; Refrigerator; Stainless steel appliances
- Bedrooms: 2nd floor entry level
- Bathrooms: 1 full bathroom
- Heating & cooling: No central cooling; Other/see remarks heating
- Interior features: Eat-in kitchen; Formal dining; Granite counters; Walk-in closet(s)
Neighborhood map
What this means for you Summary
Snapshot
- This is a 1-bed/1.0-bath condo listed at $100k.
Deal economics
- At list price, monthly cash flow is $790 ($9k/yr) — positive.
- The deal already cash-flows at list — no discount required.
- Meets the 1% rule at list price ($6k rent vs $100k).
- Recommended offer: $88k (12.0% below list) — sets the bar for market timing.
- Cap rate 15.8% vs local median 2.6% in New York — top-decile yield for the area; either an underpriced asset or a hidden risk that comps aren't pricing in. Stress-test before assuming the spread holds.
Location & tenants
- Location reads 75/100 on livability (#268 in NY, #4,188 nationally) — a middle-class / working-renter tenant base. Strengths: amenities A+, commute A+, health & safety A; Watch: crime F, cost of living F.
- Market conditions: Rents rising fast (+4.2%/yr); 538 active listings in the ZIP; 40 comparable units currently listed for rent nearby; rentals leasing fast (median 8d on market — plan ~1-2 weeks tenant-placement turnaround); high-income renter base; 4,467 units permitted in New York County in 2024 (4,463 in 5+ unit buildings).
- At $6,203/mo this rent would consume 58% of the median local household income ($129k/yr) (locally 3795% of renters already pay >50% of income on rent) — very limited rent-growth headroom before tenants either downsize or default.
Forward outlook
- In year one you build about $4k of equity ($691 loan paydown + $4k appreciation (3.6% local appreciation)).
- New York County population projected at +21% by 2050 — long-run rental-demand tailwind backs the buy-and-hold thesis.
- At projected returns (3.6% appreciation + 4.2% rent growth), your $28k cash investment doubles in ~2 years — after that, you're playing with house money.
- By year 8, paydown + projected appreciation supports a ~$32k cash-out refi (75% LTV) — recoverable capital for the next deal without selling this one.
Negotiation context
- It's been on market 245 days — a 12% lower offer ($88k) is reasonable based on typical stale-listing flexibility.
- 18 sale attempts since 21y ago; this cycle's ask is 5776% above the opening price — seller raised mid-cycle; expect resistance to lowballs.
Risks & watch-outs
- Watch-outs: HOA is 55% of rent.
- Climate carrying-cost: major wind risk, 27% chance of damaging wind over 30y; extreme-heat days projected 7→15/yr by 2055 (HVAC capex compounding) — expect insurance premiums to compound above CPI over the hold.
Questions for the listing agent
- It's been on market 245 days. Have you received any prior offers? Is the seller open to a 12% concession, seller financing, or rate buy-down credit?
- Built in 1962 — when were the roof, HVAC, electrical panel, plumbing, and water heater last replaced?
- What does the HOA fee cover, when was the last increase, and are there any pending special assessments or reserve-fund shortfalls?
- Any open or pending special assessments — roof, HVAC, plumbing, elevator, façade? What's the per-unit balance and payoff schedule, and is the seller paying it off at close or rolling it to the buyer?
- Why hasn't it sold? Are there any deal-killer items the seller is aware of (foundation, flood, title, zoning, code violations)?
- Is there a deadline driving the sale (1031 exchange, divorce, estate, relocation)? That informs how much negotiation room exists.
- Schools are B-rated — typically a magnet for longer-tenancy family renters. What's the average tenant stay here, and is there a school-zone premium baked into asking?
- Crime grade is F in this area — have there been break-ins, vandalism, or insurance claims at this property in the last 3 years? What carrier currently insures it and at what premium?
- What's the average days-on-market for RENTAL listings here right now (not sales)? A rising rental-DOM trend means longer vacancies and softer asking-rent achievability than the comps imply.
- What's the recent tenant-quality profile in this submarket — average credit score on applications, eviction rate, late-payment / NSF rate, and stable-employment percentage? A property-management company in the area should have these aggregated.
- How much new apartment / multifamily construction is in the pipeline within 1–3 miles? Heavy new supply (>2% of stock underway) typically softens rents 12–24 months out; light construction supports rent growth.
Investment metrics
- 1% rule
- 6.21% ✓
- Cap rate
- 15.79%
- Cash-on-cash
- 33.91%
- DSCR
- 2.51
- GRM
- 1.3
CMA / ARV
No comps found within radius.
Projected returns pro-forma
3.61% appreciation · 4.25% rent growth · sell at horizon
- IRR
- 44.8%
- Equity multiple
- 3.71×
- Total profit
- $75,717
- Equity at exit
- $48,376
- IRR
- 46.2%
- Equity multiple
- 8.51×
- Total profit
- $210,116
- Equity at exit
- $77,361
Cash invested: $27,972 (down + closing). Projections, not guarantees.
Landlord ↔ Tenant lean methodology
- Overall (CITY)
- 0 Strongly Tenant-Friendly
- State New York
- 15 Strongly Tenant-Friendly · D+10
- County
- — inherits STATE
- City New York
- 0 Strongly Tenant-Friendly · D+34
ZIP-level market 10019
- Home prices YoY
- 1.5%
- Rents YoY
- 4.2%
- Active inventory
- 538
- Price-to-rent
- 1.3×
Monthly cashflow live
- Estimated rent
- $6,203 high interval (Pro) →
- Mortgage (P&I)
- −$524
- Tax est. 1.5%
- −$125 /mo · $1,498/yr
- Insurance
- −$42
- HOA
- −$3,420
- Vacancy / Maint / Mgmt
- −$1,303
- Net cashflow
- $790
Break-even live
Sensitivity live
| Price | -10% $859 | -5% $825 | +0% $790 | +5% $756 | +10% $721 |
|---|---|---|---|---|---|
| Rent | -10% $300 | -5% $545 | +0% $790 | +5% $1,035 | +10% $1,280 |
| Rate | -1.0pp $841 | -0.5pp $816 | base $790 | +0.5pp $764 | +1.0pp $738 |
UW: 25.0% down · 7.5% · 30yr · 1.5% tax · 5.0% vac · 8.0% maint · 8.0% mgmt
Financing live
Cash to close
- Down payment
- $24,975
- Closing costs
- $2,997
- Reserves months
- —
- Total cash needed
- —
Loan-product check · same deal, 3 products live
Conventional
25% down · 7.5% · 30yr
- Down + closing
- —
- Monthly P&I
- —
- Monthly cashflow
- —
- DSCR
- —
- Eligible?
- —
Personal DTI + credit; lowest rate.
DSCR
20% down · 8.5% · 30yr
- Down + closing
- —
- Monthly P&I
- —
- Monthly cashflow
- —
- DSCR
- —
- Eligible?
- —
No personal income docs; deal must DSCR.
Hard money
10% down · 12.0% · 12mo
- Down + closing
- —
- Monthly P&I
- —
- Monthly cashflow
- —
- DSCR
- —
- Eligible?
- —
Short-term bridge; refi at stabilization.
Rent comps 40 comps
| Address | Beds | Baths | Sqft | Rent | $/sqft | DOM | Units | Dist |
|---|---|---|---|---|---|---|---|---|
| 77 W 55th St Unit 15H New York, NY | 1.0 | 1.0 | 750 | $4,900 | $6.53 | 22d | 1 | 0.06mi |
| 150 W 56th St New York, NY | 1.0 | 1.5 | 920 | $8,995 | $9.78 | 15d | 2 | 0.09mi |
| 55 W 55th St Unit 9AA New York, NY | 2.0 | 1.5 | 1000 | $6,000 | $6.00 | 20d | 1 | 0.11mi |
| 40 W 55th St Unit 5D New York, NY | 2.0 | 2.5 | 1070 | $6,500 | $6.07 | 25d | 1 | 0.14mi |
| 160 Central Park S New York, NY | 1.0–3.0 | 1.5–3.5 | 1578 | $10,000 | $6.34 | 2d | 9 | 0.16mi |
| 160 Central Park S New York, NY | 1.0–3.0 | 1.0–3.5 | 1550 | $7,500 | $4.84 | 8d | 10 | 0.16mi |
| 160 Central Park S New York, NY | 1.0–3.0 | 1.0–3.5 | 1550 | $9,250 | $5.97 | 8d | 9 | 0.16mi |
| 15 W 55th St #736 New York, NY | 2.0–3.0 | 1.0–2.0 | 1250 | $8,210 | $6.57 | 0d | 2 | 0.17mi |
| 254 W 54th St Unit 1026635P New York, NY | 1.0–2.0 | 1.0–2.0 | 860 | $8,040 | $9.34 | 8d | 2 | 0.30mi |
| 1600 Broadway #697 New York, NY | 1.0–2.0 | 1.0 | 900 | $5,810 | $6.46 | 25d | 3 | 0.42mi |
| 250 W 50th St New York, NY | 2.0 | 1.0–2.0 | 784 | $5,866 | $7.48 | 8d | 1 | 0.44mi |
| 18 W 48th St Unit 670 New York, NY | 1.0 | 1.0 | 631 | $7,730 | $12.25 | 8d | 1 | 0.44mi |
| 117 E 57th St New York, NY | 1.0 | 1.0 | 732 | $5,975 | $8.16 | 5d | 2 | 0.46mi |
| 235 W 48th St #1400 New York, NY | 2.0 | 1.0–2.0 | 687 | $6,270 | $9.12 | 8d | 3 | 0.47mi |
| 311 W 50th St #228 New York, NY | 2.0 | 1.0–2.0 | 669 | $6,470 | $9.67 | 8d | 3 | 0.47mi |
| 123 E 54th St #1251 New York, NY | 1.0–2.0 | 1.0 | 600 | $5,220 | $8.70 | 0d | 2 | 0.47mi |
| 303 Park Ave #2203 New York, NY | 1.0 | 1.5 | 796 | $13,500 | $16.96 | 8d | 1 | 0.54mi |
| 303 Park Ave #2321 New York, NY | 1.0 | 1.5 | 808 | $14,500 | $17.95 | 8d | 1 | 0.54mi |
| 754 9th Ave Unit 1017471P New York, NY | 1.0 | 1.0 | 538 | $7,284 | $13.54 | 8d | 1 | 0.54mi |
| 150 E 57th St New York, NY | 5.0 | 1.0–7.5 | 2750 | $10,504 | $3.82 | 2d | 5 | 0.55mi |
| 70 W 45th St #1131 New York, NY | 1.0–2.0 | 1.0–2.0 | 902 | $5,990 | $6.64 | 8d | 2 | 0.57mi |
| 500 W 56th St #116 New York, NY | 2.0 | 1.0–2.0 | 680 | $6,190 | $9.10 | 8d | 3 | 0.67mi |
| 227 E 57th St Unit 14C New York, NY | 1.0 | 1.0 | 780 | $4,750 | $6.09 | 25d | 1 | 0.69mi |
| 235 E 55th St Unit 36B New York, NY | 1.0 | 1.0 | 650 | $4,800 | $7.38 | 25d | 1 | 0.69mi |
| 135 E 47th St New York, NY | 1.0 | 1.0 | 580 | $6,350 | $10.94 | 0d | 1 | 0.70mi |
| 160 E 48th St New York, NY | 3.0 | 1.0–2.0 | 878 | $6,993 | $7.96 | 4d | 9 | 0.71mi |
| 135 E 47th St Unit 22F New York, NY | 1.0 | 1.0 | 700 | $7,500 | $10.71 | 22d | 1 | 0.72mi |
| 250 E 53rd St #403 New York, NY | 1.0 | 1.0 | 823 | $5,850 | $7.11 | 25d | 1 | 0.74mi |
| 220 E 63rd St #567 New York, NY | 1.0 | 1.0 | 800 | $6,460 | $8.07 | 21d | 1 | 0.75mi |
| 220 E 49th St Unit 1021974P New York, NY | 2.0 | 1.0 | 742 | $5,190 | $6.99 | 15d | 1 | 0.76mi |
| 252 E 61st St #638 New York, NY | 1.0 | 1.0 | 666 | $5,530 | $8.30 | 2d | 2 | 0.76mi |
| 300 E 57th St #1714 New York, NY | 1.0 | 1.0 | 820 | $5,800 | $7.07 | 21d | 1 | 0.76mi |
| 225 E 63rd St #1675 New York, NY | 1.0 | 1.0 | 627 | $5,230 | $8.34 | 25d | 2 | 0.76mi |
| 550 W 54th St Unit 1243 New York, NY | 1.0–3.0 | 1.0–2.0 | 913 | $6,270 | $6.86 | 8d | 3 | 0.77mi |
| 250 E 49th St Unit 4A New York, NY | 1.0 | 1.0 | 802 | $6,400 | $7.98 | 25d | 1 | 0.80mi |
| 300 E 51st St New York, NY | 2.0 | 1.0–2.0 | 875 | $6,365 | $7.27 | 3d | 3 | 0.80mi |
| 220 E 65th St New York, NY | 1.0 | 1.0 | 700 | $5,950 | $8.50 | 2d | 1 | 0.81mi |
| 329 E 58th St #807 New York, NY | 2.0 | 1.0 | 650 | $5,860 | $9.02 | 8d | 1 | 0.82mi |
| 301 E 63rd St New York, NY | 2.0 | 1.0 | 975 | $6,650 | $6.82 | 5d | 1 | 0.83mi |
| 333 E 52nd St Unit 2177 New York, NY | 2.0 | 1.0 | 600 | $4,900 | $8.17 | 22d | 1 | 0.85mi |
HOA detail condo
- Monthly dues
- $3,420 · $41,040/yr
- Assessments
- None detected in remarks — confirm with the listing agent.
Listing history 50 events
-
2026-06-10statusdays on market $99,900 Pending 245 DOM
-
2026-06-01days on market $99,900 Active 244 DOM
-
2026-05-31days on market $99,900 Active 243 DOM
-
2026-05-12status Active
-
2026-05-01historical
-
2026-03-01status Active
-
2026-02-28historical
-
2025-12-24price $99,900
-
2025-12-11historical $1,700
-
2025-12-09$1,700
-
2025-12-04status Active
-
2025-12-02historical
-
2025-10-20price $108,000
-
2025-09-20price $129,000
-
2025-09-15$139,000 Active
-
2025-08-30historical
-
2025-08-22price $139,000
-
2025-07-07price $145,000
-
2025-07-02status Active
-
2025-07-01historical
-
2025-06-02status Active
-
2025-06-02historical
-
2025-05-30price $149,000
-
2025-05-23status Active
-
2025-05-01historical
-
2025-04-23price $152,000
-
2025-04-01$154,900 Active
-
2025-01-01historical
-
2024-10-21price $154,900
-
2024-09-18price $159,900
-
2024-09-18price $164,900
-
2024-09-18price $159,900
-
2024-08-06$164,900 Active
-
2024-07-05price $169,800
-
2024-06-07price $169,900
-
2024-05-07price $177,900
-
2024-05-06status Active
-
2024-05-06historical
-
2024-02-05status Pending
-
2024-01-17$180,000 Active
-
2021-09-22$450,000 Active
-
2021-06-18price $645,000
-
2021-06-18price $475,000
-
2021-06-17soldstatus
-
2021-06-17soldstatus
-
2021-03-08$450,000 Active
-
2015-06-08soldstatus $635,000
-
2015-01-19$625,000
-
2015-01-19$625,000
-
2007-05-10$675,000
ⓘ Source: listings_history table (triggers on properties + properties_extension) + one-shot
backfill from property_details.listing_events for pre-trigger history.
Climate risk First Street
- Flood 1/10 Low FEMA zone X (unshaded) · 0% chance over 30 yrs
- Wildfire 2/10 Low
- Heat 6/10 Major 7 d/yr ≥99°F today · 15 d/yr by 30 yrs out
- Wind 6/10 Major 27% chance of damaging wind over 30 yrs
- Air quality 4/10 Moderate 5 unhealthy d/yr today · 6 by 30 yrs out
Nearby sold comps map
Loading sold comps map…
Walkable amenities ~0.75 mi
Loading nearby amenities…
Taxation est. · year 1
- Rental income
- $74,442
- − Mortgage interest
- −$5,596
- − Property taxes
- −$1,498
- − Insurance
- −$500
- − Repairs & maintenance
- −$5,955
- − Management
- −$5,955
- − HOA
- −$41,040
- − Depreciation
- −$2,906
- Taxable income
- $10,991
- Est. tax owed @ 24.0%
- −$2,638
- After-tax cash flow
- $6,847/yr
For passive investors: Depreciation is non-cash, so a rental often shows a tax loss while cash-flowing — sheltering income. Rental losses are passive: they offset passive income freely, and up to $25,000/yr can offset ordinary (W-2) income if you actively participate and your MAGI is under $100k (phasing out to $0 by $150k); unused losses carry forward. On sale, claimed depreciation is recaptured at up to 25%, and gains may owe capital-gains tax (a 1031 exchange can defer both). Figures are a year-1 estimate at your 24.0% rate — not tax advice; consult a CPA.
Schools (NCES district)
No district data.
Livability — New York
- Score
- 75/100
- State rank
- #268
- US rank
- #4188
Category grades
Schools grade is shown separately in the Schools card above.
Census & demographics
- Census place
- New York, NY
- County
- New York County · 1,599,927 people
- City population
- 7,731,280
- Metro
- New York-Newark-Jersey City, NY-NJ-PA
- Population (ZIP)
- 44,942
- Household income
- $128,559
- Rent vs Own
- Severe rent burden
- 3795.0
Population outlook (New York County) Hauer SSP2
- Today (2025)
- 1,825,725 people
- By 2030
- 1,904,611 · +4.3%
- By 2040
- 2,052,719 · +12.4%
- By 2050
- 2,206,601 · +20.9%
- By 2075
- 2,509,427 · +37.4%
- By 2100
- 2,702,933 · +48.0%
Race, ethnicity, and origin ACS 2023
- Neighborhood character
- Diverse neighborhood (Simpson 0.63)
- Race & ethnicity
- White 55% Asian 18% Hispanic / Latino 17% Two or more races 10% Black 5%
- Hispanic origin (detail)
- Mexican 2% Puerto Rican 3% Dominican 4%
- Common ancestry
- Romanian 4% Lithuanian 4% Scotch-Irish 4%
- Foreign-born
- 34% · Canada, China, South Korea
- Languages at home
- 66% English-only · Spanish 12% Other Indo-European 6% Chinese 5%
Political lean MEDSL · New York
- 2024 margin
- Solid D (+64.8) · D 82.4% · R 17.6%
- 2008→2024 swing
- -7.4pp toward R · 2008: 72.2pp · 2024: 64.8pp
- All cycles
- 2024: D+64.8 2020: D+74.5 2016: D+77.2 2012: D+69.6 2008: D+72.2
Not yet ingested
- Civics
- —
Market trends
- HPI YoY
- ▲ 3.61%
- Current HPI
- 245.1226
- Rent YoY
- ▲ 4.25%
- Metro
- New York-Newark-Jersey City, NY-NJ-PA
- State GDP YoY
- ▲ 2.60%
- F500 in state
- 92
Industry mix (Fortune 500 HQ in NY)
| Industry | F500 HQs | Revenue |
|---|---|---|
| Financial Services | 10 | $950B |
|
||
| Consumer Goods | 9 | $162B |
|
||
| Insurance | 4 | $225B |
|
||
| Telecommunications | 2 | $144B |
|
||
| Pharmaceuticals | 2 | $112B |
|
||
| Media / Entertainment | 2 | $69B |
|
||
Price history
-79.8% since first listed48 events — show timeline
- 2026-05-12 Relisted — OneKey® MLS as Distributed by MLS Grid
- 2026-05-01 Listing Removed — OneKey® MLS as Distributed by MLS Grid
- 2026-03-01 Relisted — OneKey® MLS as Distributed by MLS Grid
- 2026-02-28 Listing Removed — OneKey® MLS as Distributed by MLS Grid
- 2025-12-24 Price Changed $99,900 OneKey® MLS as Distributed by MLS Grid
- 2025-12-11 Rental Removed $1,700 PROPERTYWARE
- 2025-12-09 Listed for Rent $1,700 PROPERTYWARE
- 2025-12-04 Relisted — OneKey® MLS as Distributed by MLS Grid
- 2025-12-02 Listing Removed — OneKey® MLS as Distributed by MLS Grid
- 2025-10-20 Price Changed $108,000 OneKey® MLS as Distributed by MLS Grid
- 2025-09-20 Price Changed $129,000 OneKey® MLS as Distributed by MLS Grid
- 2025-09-15 Listed $139,000 OneKey® MLS as Distributed by MLS Grid
- 2025-08-30 Listing Removed — OneKey® MLS as Distributed by MLS Grid
- 2025-08-22 Price Changed $139,000 OneKey® MLS as Distributed by MLS Grid
- 2025-07-07 Price Changed $145,000 OneKey® MLS as Distributed by MLS Grid
- 2025-07-02 Relisted — OneKey® MLS as Distributed by MLS Grid
- 2025-07-01 Listing Removed — OneKey® MLS as Distributed by MLS Grid
- 2025-06-02 Relisted — OneKey® MLS as Distributed by MLS Grid
- 2025-06-02 Listing Removed — OneKey® MLS as Distributed by MLS Grid
- 2025-05-30 Price Changed $149,000 OneKey® MLS as Distributed by MLS Grid
- 2025-05-23 Relisted — OneKey® MLS as Distributed by MLS Grid
- 2025-05-01 Listing Removed — OneKey® MLS as Distributed by MLS Grid
- 2025-04-23 Price Changed $152,000 OneKey® MLS as Distributed by MLS Grid
- 2025-04-01 Listed $154,900 OneKey® MLS as Distributed by MLS Grid
- 2025-01-01 Listing Removed — OneKey® MLS as Distributed by MLS Grid
- 2024-10-21 Price Changed $154,900 OneKey® MLS as Distributed by MLS Grid
- 2024-09-18 Price Changed $159,900 OneKey® MLS as Distributed by MLS Grid
- 2024-09-18 Price Changed $164,900 OneKey® MLS as Distributed by MLS Grid
- 2024-09-18 Price Changed $159,900 OneKey® MLS as Distributed by MLS Grid
- 2024-08-06 Listed $164,900 OneKey® MLS as Distributed by MLS Grid
- 2024-07-05 Price Changed $169,800 OneKey® MLS as Distributed by MLS Grid
- 2024-06-07 Price Changed $169,900 OneKey® MLS as Distributed by MLS Grid
- 2024-05-07 Price Changed $177,900 OneKey® MLS as Distributed by MLS Grid
- 2024-05-06 Relisted — OneKey® MLS as Distributed by MLS Grid
- 2024-05-06 Listing Removed — OneKey® MLS as Distributed by MLS Grid
- 2024-02-05 Pending — OneKey® MLS as Distributed by MLS Grid
- 2024-01-17 Listed $180,000 OneKey® MLS as Distributed by MLS Grid
- 2021-09-22 Listed $450,000 RLS at REBNY
- 2021-06-18 Price Changed $645,000 RLS at REBNY
- 2021-06-18 Price Changed $475,000 RLS at REBNY
- 2021-06-17 Sold (MLS) — RLS at REBNY
- 2021-06-17 Sold (MLS) — RLS at REBNY
- 2021-03-08 Listed $450,000 RLS at REBNY
- 2015-06-08 Sold (MLS) $635,000 RLS at REBNY
- 2015-01-19 Listed $625,000 RLS at REBNY
- 2015-01-19 Listed $625,000 RLS at REBNY
- 2007-05-10 Listed $675,000 RLS at REBNY
- 2005-02-15 Listed $495,000 RLS at REBNY
Cash-flow waterfall
monthlySold comps — $/sqft
last 12 mo · ≤1 miLoading sold comps…