 Duplex
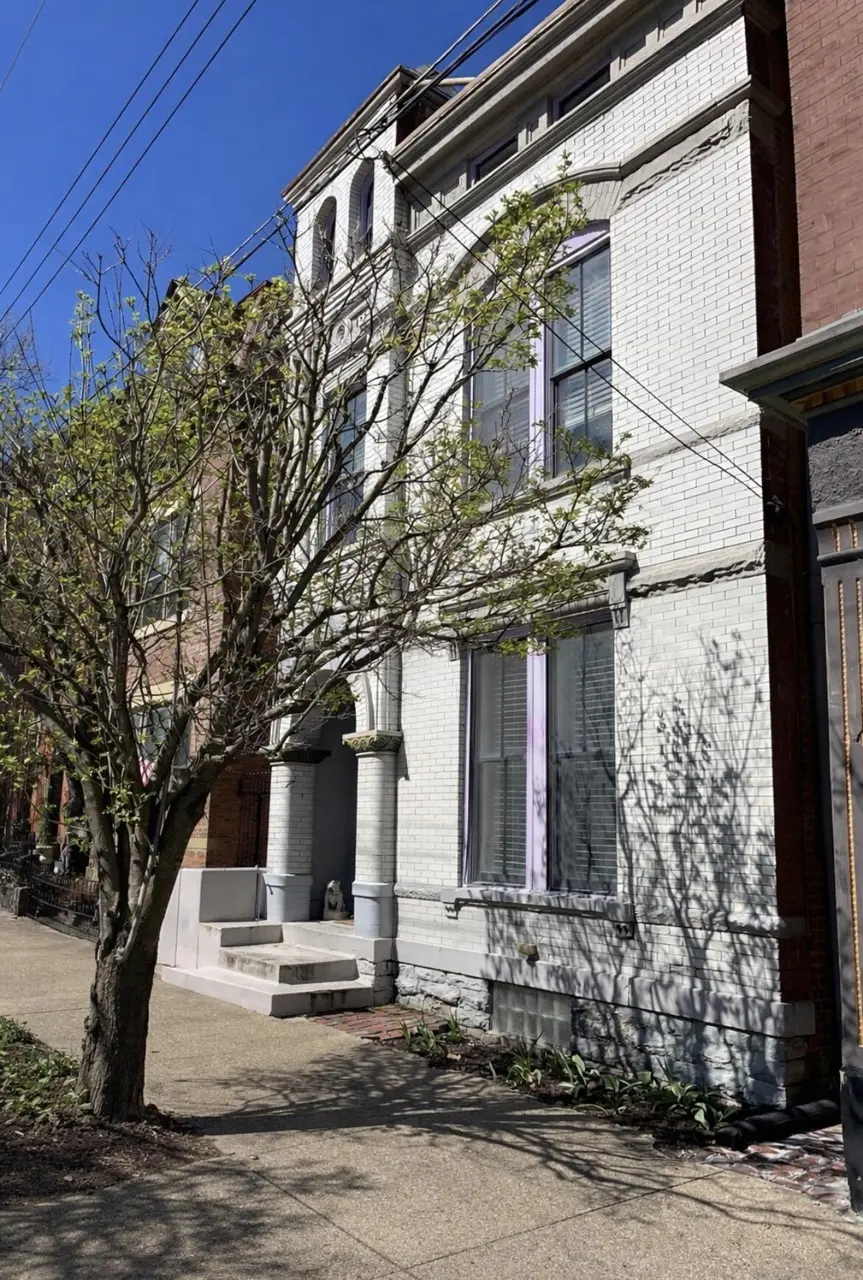
326 W 8th St · Covington, KY
Flood risk 1/10 · Minimal
- FEMA flood zone
- X (unshaded)
- Chance of flooding over 30 yrs
- 0.0%
- Est. flood insurance / yr
- $507 – $1,088
Fire risk 1/10 · Minimal
- Est. fire insurance / yr
- $839 – $1,559
Heat risk 5/10 · Moderate
- Hot days now (above 103°F)
- 7 days/yr
- Hot days in 30 yrs
- 20 days/yr
Wind risk 2/10 · Minimal
- Chance of severe wind over 30 yrs
- 1.0%
Air-quality risk 3/10 · Minor
- Unhealthy air days now
- 2 days/yr
- Unhealthy air days in 30 yrs
- 3 days/yr
Risk factors via First Street. Map © Google.
Why this score? — see what drove the C+ grade
The composite is a weighted blend of 9 inputs, each scored 0–100. Each bar is that input's sub-score; the figure is the points it added to the 100-point composite (weight × sub-score).
- Cash flow +25.0/30.0
- ARV discount +13.2/15.0
- DSCR +8.2/10.0
- 1% rule +6.0/10.0
- Livability +4.3/5.0
- Rent growth +2.9/5.0
- Condition / age +2.5/5.0
- Schools +1.5/10.0
- Appreciation +0.0/10.0
$434,900
🖨 Deal sheet 📄 Offer letter ✓ Due diligence
Multi-family units
County records classify this as Multi-Family (2-4 Unit). Listing-text estimate: 2 units. confirmed
Listing remarks
Amazing multifamily opportunity in the heart of Historic MainStrasse Village in Covington, KY! This charming property features two well appointed units--Unit 1 offers a spacious 1 bedroom, 1 bath layout, while Unit 2 includes 2 bedrooms and 1 bath. Both units feature beautiful hardwood floors, walk-in closets, in-unit laundry and private decks perfect for relaxing or entertaining. Off-street parking pad adds convenience for Unit 2. Ideally located just steps from the vibrant shops, restaurants and entertainment of MainStrasse Village, making this a fantastic investment in Covington's most walkable and sought after neighborhoods! Achosa warranty included.
Key facts
- Private decks
- Walk-in closets
- In-unit laundry
Tags
Property features AI
Finance
- Financial info: Home warranty included
Exterior
- Parking: Off-street parking; On-street parking
- Utilities: Public water; Public sewer; Natural gas available
- Home design: Duplex; Two levels; Built in 1889
- Construction: Brick construction; Stone foundation; Shingle roof
- Exterior features: Deck; Double-hung, vinyl-clad and wood-frame windows; Has a view
Interior
- Kitchen: Electric range; Dishwasher; Microwave; Refrigerator
- Bathrooms: Two full bathrooms
- Heating & cooling: Central air conditioning; Electric forced-air heating
- Interior features: In-unit laundry; Fireplace (inoperable); Full basement
- Laundry & utility: Stacked washer/dryer (in unit)
Neighborhood map
What this means for you Summary
Snapshot
- This is a 2 × 3-bed/2.0-bath units multifamily listed at $435k.
Deal economics
- At list price, monthly cash flow is $953 ($11k/yr) — positive. Per door: $477/mo.
- The deal already cash-flows at list — no discount required.
- Meets the 1% rule at list price ($5k rent vs $435k).
- Recommended offer: $409k (6.0% below list) — sets the bar for market timing.
- Cap rate 8.9% vs local median 5.3% in Covington — top-decile yield for the area; either an underpriced asset or a hidden risk that comps aren't pricing in. Stress-test before assuming the spread holds.
Location & tenants
- Location reads 86/100 on livability (#40 in KY, #376 nationally) — a professional / high-income tenant draw. Strengths: amenities A+, commute A+, cost of living A+; Watch: employment D+.
- Covington Independent (suburban): math 10% / reading 27% proficiency, ranked #162 of 165 in KY (top 98%) — low school quality limits family demand, transient renter base, plan for 1-2y turnover; 78% free/reduced lunch — lower-income household profile, screen leases tightly.
- Zoned schools: John G Carlisle Elementary (math 2% / reading 27%, grade F, #620 of 676 statewide, top 93%, 304 students, 81% FRL); Holmes Middle School (math 8% / reading 26%, grade F, #211 of 217 statewide, top 97%, 656 students, 84% FRL); Holmes High School (math 12% / reading 17%, grade F, #227 of 254 statewide, top 89%, 878 students, 80% FRL) — zoned schools at 82% FRL track the district average.
- Market conditions: Rents rising (+1.6%/yr); 214 active listings in the ZIP; 2 comparable units currently listed for rent nearby; 699 units permitted in Kenton County in 2024 (287 in 5+ unit buildings).
- At $4,803/mo this rent would consume 82% of the median local household income ($70k/yr) (locally 1488% of renters already pay >50% of income on rent) — very limited rent-growth headroom before tenants either downsize or default.
Forward outlook
- Local home prices are declining (-3.0%/yr); year-one equity from $3k of loan paydown is wiped out by about $13k of value loss. Plan a longer hold.
- Kenton County population projected at +5% by 2050 — modest demand growth; plan on rents tracking national, not racing it.
Negotiation context
- It's been on market 63 days — a 6% lower offer ($409k) is reasonable based on typical stale-listing flexibility.
- 9 sale attempts since 26y ago; this cycle's ask has dropped $23k (5%) from the opening price — seller is motivated, your offer sets the floor, not the list.
- Current owner paid $345k; 26% above their basis — modest negotiation headroom, anchor on the comps not their cost.
Risks & watch-outs
- Watch-outs: built in 1889 — expect roof / HVAC / electrical / plumbing capex.
- Climate carrying-cost: extreme-heat days projected 7→20/yr by 2055 (HVAC capex compounding) — expect insurance premiums to compound above CPI over the hold.
Questions for the listing agent
- It's been on market 63 days. Have you received any prior offers? Is the seller open to a 6% concession, seller financing, or rate buy-down credit?
- Can we see the unit-by-unit rent roll, current vacancy, and any below-market leases? What's the average tenancy length?
- What capital expenditures (roof, boiler, parking lot, exteriors) have been made in the last 5 years, and what's planned in the next 2?
- Built in 1889 — when were the roof, HVAC, electrical panel, plumbing, and water heater last replaced?
- Why hasn't it sold? Are there any deal-killer items the seller is aware of (foundation, flood, title, zoning, code violations)?
- Is there a deadline driving the sale (1031 exchange, divorce, estate, relocation)? That informs how much negotiation room exists.
- What's the average days-on-market for RENTAL listings here right now (not sales)? A rising rental-DOM trend means longer vacancies and softer asking-rent achievability than the comps imply.
- What's the recent tenant-quality profile in this submarket — average credit score on applications, eviction rate, late-payment / NSF rate, and stable-employment percentage? A property-management company in the area should have these aggregated.
- How much new apartment / multifamily construction is in the pipeline within 1–3 miles? Heavy new supply (>2% of stock underway) typically softens rents 12–24 months out; light construction supports rent growth.
Investment metrics
- 1% rule
- 1.10% ✓
- Cap rate
- 8.92%
- Cash-on-cash
- 9.39%
- DSCR
- 1.42
- GRM
- 7.5
CMA / ARV
- ARV (on-the-fly)
- $497,364
- Comps found
- 3
Show comp detail 3 sales within ~0.75 mi
| Address | Dist | Beds/Ba | Sqft | Sold | Price | $/sf | Match |
|---|---|---|---|---|---|---|---|
| 251 W 8th St | 0.12mi | 5/3.0 (-1) | 2,616 (+0%) | 12mo | $500,000 | $191 | 71 |
| 212 W 5th St | 0.28mi | 5/4.0 (-1) | 2,496 (-4%) | 16mo | $722,900 | $290 | 50 |
| 1103 W Pike St #4 | 0.58mi | 6/4.0 | 2,757 (+6%) | 6mo | $400,000 | $145 | 46 |
Match score weights: distance 35% · size 25% · config 20% · recency 20%. Top-matched comps best support the ARV.
Projected returns pro-forma
-3.0% appreciation · 1.55% rent growth · sell at horizon
- IRR
- -3.7%
- Equity multiple
- 0.86×
- Total profit
- $-16,690
- Equity at exit
- $64,845
- IRR
- 4.3%
- Equity multiple
- 1.30×
- Total profit
- $36,005
- Equity at exit
- $37,602
Cash invested: $121,772 (down + closing). Projections, not guarantees.
Landlord ↔ Tenant lean methodology
- Overall (STATE)
- 83 Strongly Landlord-Friendly
- State Kentucky
- 83 Strongly Landlord-Friendly · R+16
- County
- — inherits STATE
- City
- — inherits STATE
ZIP-level market 41011
- Rents YoY
- 1.6%
- Active inventory
- 214
- Price-to-rent
- 15.1×
Monthly cashflow live
- Estimated rent
- $4,803 high interval (Pro) →
- Mortgage (P&I)
- −$2,281
- Tax from tax record
- −$379 /mo · $4,550/yr
- Insurance
- −$181
- HOA
- −$0
- Vacancy / Maint / Mgmt
- −$1,009
- Net cashflow
- $953
Break-even live
2-unit breakdown (identical units grouped — click to expand)
| Units | Beds | Baths | Est. rent |
|---|---|---|---|
| 2× units | 3 | 2 | $4,804 |
| #1 | 3 | 2 | $2,402 |
| #2 | 3 | 2 | $2,402 |
| Total (2 units) | $4,803 | ||
UW: 25.0% down · 7.5% · 30yr · 1.5% tax · 5.0% vac · 8.0% maint · 8.0% mgmt
Financing live
Cash to close
- Down payment
- $108,725
- Closing costs
- $13,047
- Reserves months
- —
- Total cash needed
- —
Loan-product check · same deal, 3 products live
Conventional
25% down · 7.5% · 30yr
- Down + closing
- —
- Monthly P&I
- —
- Monthly cashflow
- —
- DSCR
- —
- Eligible?
- —
Personal DTI + credit; lowest rate.
DSCR
20% down · 8.5% · 30yr
- Down + closing
- —
- Monthly P&I
- —
- Monthly cashflow
- —
- DSCR
- —
- Eligible?
- —
No personal income docs; deal must DSCR.
Hard money
10% down · 12.0% · 12mo
- Down + closing
- —
- Monthly P&I
- —
- Monthly cashflow
- —
- DSCR
- —
- Eligible?
- —
Short-term bridge; refi at stabilization.
Rent comps 2 comps
| Address | Beds | Baths | Sqft | Rent | $/sqft | DOM | Units | Dist |
|---|---|---|---|---|---|---|---|---|
| 1808 Holman Ave Covington, KY | 6.0 | 2.5 | 2600 | $2,875 | $1.11 | 1d | 1 | 1.02mi |
| 835 York St #1 Newport, KY | 5.0 | 2.0 | 2700 | $2,395 | $0.89 | 43d | 1 | 1.41mi |
Listing history 37 events
-
2026-06-18days on market $434,900 Active 63 DOM
-
2026-06-17days on market $434,900 Active 62 DOM
-
2026-06-16days on market $434,900 Active 61 DOM
-
2026-06-15pricedays on market $434,900 Active 60 DOM
-
2026-06-09days on market $445,000 Active 54 DOM
-
2026-06-08days on market $445,000 Active 53 DOM
-
2026-06-07days on market $445,000 Active 52 DOM
-
2026-06-03days on market $445,000 Active 48 DOM
-
2026-06-02days on market $445,000 Active 47 DOM
-
2026-06-01days on market $445,000 Active 46 DOM
-
2026-05-31days on market $445,000 Active 45 DOM
-
2026-05-01price $445,000
-
2026-04-16$458,000 Active
-
2026-04-16historical
-
2026-04-01price $475,000
-
2026-03-13$485,000 Active
-
2021-02-25historical
-
2021-02-23soldstatus $345,000
-
2021-02-16soldstatus $345,000 Closed
-
2021-01-12status Pending
-
2021-01-12status Pending
-
2020-12-28$349,900 Active
-
2020-12-28$349,900 Active
-
2020-12-11historical
-
2020-12-11historical
-
2020-12-09price $349,900
-
2020-12-09price $349,900
-
2020-11-02$359,900 Active
-
2020-11-02$359,900 Active
-
2016-08-15soldstatus $255,000
-
2016-06-27$265,000
-
2001-02-16soldstatus $27,000
-
2001-02-02soldstatus $27,000
-
2001-01-09soldstatus $29,000
-
2000-12-15historical
-
2000-11-29$45,000
-
2000-06-15$65,000
ⓘ Source: listings_history table (triggers on properties + properties_extension) + one-shot
backfill from property_details.listing_events for pre-trigger history.
Tax reassessment forecast KY · Resets to sale price
- Current annual tax
- $4,550 · $379/mo
- Projected year-2 tax
- $4,550 · $379/mo
- Expected delta
- $0/yr ($0/mo · 0.0%)
ⓘ Screening estimate from a state-policy table — verify with the county assessor before closing.
Climate risk First Street
- Flood 1/10 Low FEMA zone X (unshaded) · 0% chance over 30 yrs
- Wildfire 1/10 Low
- Heat 5/10 Major 7 d/yr ≥103°F today · 20 d/yr by 30 yrs out
- Wind 2/10 Low 100% chance of damaging wind over 30 yrs
- Air quality 3/10 Moderate 2 unhealthy d/yr today · 3 by 30 yrs out
Nearby sold comps map
Loading sold comps map…
Walkable amenities ~0.75 mi
Loading nearby amenities…
Taxation est. · year 1
- Rental income
- $57,636
- − Mortgage interest
- −$24,361
- − Property taxes
- −$4,550
- − Insurance
- −$2,174
- − Repairs & maintenance
- −$4,611
- − Management
- −$4,611
- − Depreciation
- −$12,652
- Taxable income
- $4,677
- Est. tax owed @ 24.0%
- −$1,123
- After-tax cash flow
- $10,318/yr
For passive investors: Depreciation is non-cash, so a rental often shows a tax loss while cash-flowing — sheltering income. Rental losses are passive: they offset passive income freely, and up to $25,000/yr can offset ordinary (W-2) income if you actively participate and your MAGI is under $100k (phasing out to $0 by $150k); unused losses carry forward. On sale, claimed depreciation is recaptured at up to 25%, and gains may owe capital-gains tax (a 1031 exchange can defer both). Figures are a year-1 estimate at your 24.0% rate — not tax advice; consult a CPA.
Schools (NCES district)
- District
- Covington Independent
- NCES district ID
- 2101350
- Math proficiency
- 10% ▼ -20.00%
- Reading proficiency
- 27% ▼ -14.00%
- Median HH income
- $33,681
- Composite
- 15.04/100
- National rank
- #9353
- State rank
- #162 of 165 in KY
Livability — Covington
- Score
- 86/100
- State rank
- #40
- US rank
- #376
Category grades
Schools grade is shown separately in the Schools card above.
Census & demographics
- Census place
- Covington, KY
- County
- Kenton County · 142,881 people
- City population
- 34,373
- Metro
- Cincinnati, OH-KY-IN
- Population (ZIP)
- 26,981
- Household income
- $69,970
- Rent vs Own
- Severe rent burden
- 1488.0
Population outlook (Kenton County) Hauer SSP2
- Today (2025)
- 174,205 people
- By 2030
- 177,897 · +2.1%
- By 2040
- 182,671 · +4.9%
- By 2050
- 183,543 · +5.4%
- By 2075
- 178,977 · +2.7%
- By 2100
- 159,920 · -8.2%
Race, ethnicity, and origin ACS 2023
- Neighborhood character
- Predominantly White (72%)
- Race & ethnicity
- White 72% Hispanic / Latino 12% Black 10% Two or more races 7% Asian 1%
- Hispanic origin (detail)
- Mexican 2%
- Common ancestry
- Lithuanian 2% Italian 1% Slovak 1%
- Foreign-born
- 7% · Canada
- Languages at home
- 90% English-only · Spanish 6% Other Indo-European 1%
Political lean MEDSL · Kenton
- 2024 margin
- Strong R (+21.7) · D 38.2% · R 59.9% · Other 1.9%
- 2008→2024 swing
- -0.9pp no change · 2008: -20.9pp · 2024: -21.7pp
- All cycles
- 2024: R+21.7 2020: R+19.3 2016: R+26.1 2012: R+24.3 2008: R+20.9
Not yet ingested
- Civics
- —
Market trends
- HPI YoY
- ▼ -215.20%
- Current HPI
- 237.0869
- Rent YoY
- ▲ 1.55%
- Metro
- Cincinnati, OH-KY-IN
- State GDP YoY
- ▲ 1.81%
- F500 in state
- 4
Industry mix (Fortune 500 HQ in KY)
| Industry | F500 HQs | Revenue |
|---|---|---|
| Healthcare | 1 | $118B |
|
||
| Food / Beverage | 1 | $7B |
|
||
Price history
+584.6% since first listed26 events — show timeline
- 2026-05-01 Price Changed $445,000 NKMLS
- 2026-04-16 Listing Removed — NKMLS
- 2026-04-16 Listed $458,000 NKMLS
- 2026-04-01 Price Changed $475,000 NKMLS
- 2026-03-13 Listed $485,000 NKMLS
- 2021-02-25 Listing Removed — NKMLS
- 2021-02-23 Sold (Public Records) $345,000 Public Records
- 2021-02-16 Sold (MLS) $345,000 NKMLS
- 2021-01-12 Pending — NKMLS
- 2021-01-12 Pending — NKMLS
- 2020-12-28 Listed $349,900 NKMLS
- 2020-12-28 Listed $349,900 NKMLS
- 2020-12-11 Listing Removed — NKMLS
- 2020-12-11 Listing Removed — NKMLS
- 2020-12-09 Price Changed $349,900 NKMLS
- 2020-12-09 Price Changed $349,900 NKMLS
- 2020-11-02 Listed $359,900 NKMLS
- 2020-11-02 Listed $359,900 NKMLS
- 2016-08-15 Sold (MLS) $255,000 NKMLS
- 2016-06-27 Listed $265,000 NKMLS
- 2001-02-16 Sold (Public Records) $27,000 Public Records
- 2001-02-02 Sold (MLS) $27,000 NKMLS
- 2001-01-09 Sold (Public Records) $29,000 Public Records
- 2000-12-15 Listing Removed — NKMLS
- 2000-11-29 Listed $45,000 NKMLS
- 2000-06-15 Listed $65,000 NKMLS
Property tax history
+9.8%/yrLatest (2025): $4,550 · +0.7% YoY. Source: county tax records.
Cash-flow waterfall
monthlySold comps — $/sqft
last 12 mo · ≤1 miLoading sold comps…