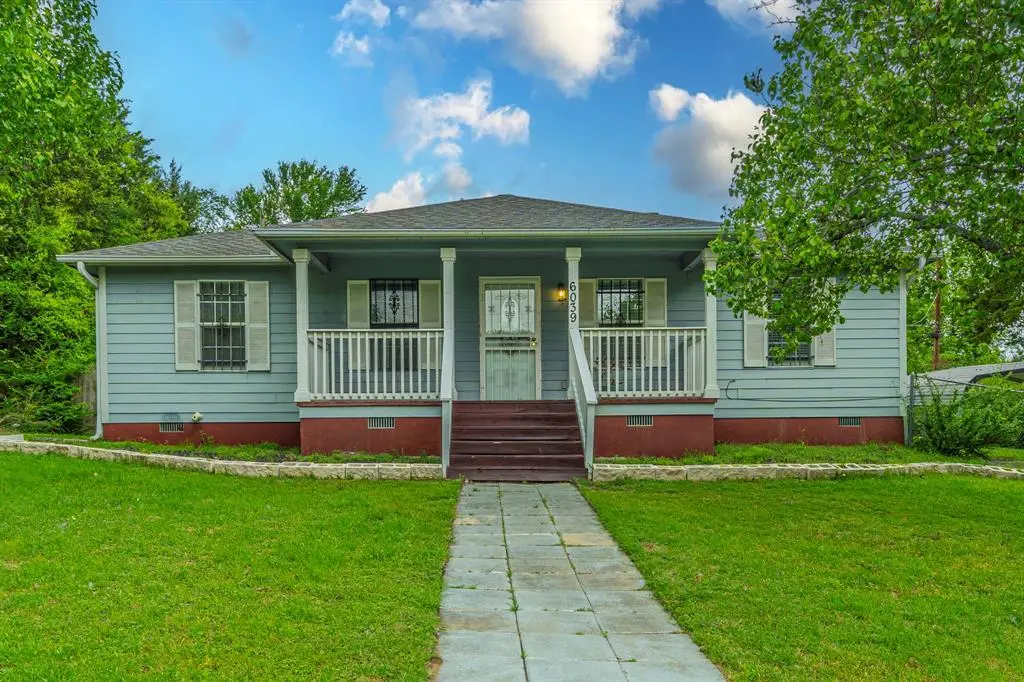
6039 Blunter St · Dallas, TX
Flood risk 1/10 · Minimal
- FEMA flood zone
- X (unshaded)
- Chance of flooding over 30 yrs
- 0.0%
- Est. flood insurance / yr
- $507 – $1,088
Fire risk 3/10 · Minor
- Est. fire insurance / yr
- $1,222 – $2,270
Heat risk 7/10 · Major
- Hot days now (above 110°F)
- 7 days/yr
- Hot days in 30 yrs
- 24 days/yr
Wind risk 6/10 · Moderate
- Chance of severe wind over 30 yrs
- 27.0%
Air-quality risk 2/10 · Minimal
- Unhealthy air days now
- 1 days/yr
- Unhealthy air days in 30 yrs
- 2 days/yr
Risk factors via First Street. Map © Google.
Why this score? — see what drove the C- grade
The composite is a weighted blend of 9 inputs, each scored 0–100. Each bar is that input's sub-score; the figure is the points it added to the 100-point composite (weight × sub-score).
- ARV discount +15.0/15.0
- Cash flow +14.8/30.0
- 1% rule +5.1/10.0
- DSCR +4.5/10.0
- Livability +4.0/5.0
- Schools +2.8/10.0
- Condition / age +2.5/5.0
- Rent growth +1.8/5.0
- Appreciation +0.0/10.0
$185,000
🖨 Deal sheet 📄 Offer letter ✓ Due diligence
Listing remarks
Discover this inviting 3-bedroom, 2-bath home nestled in the quiet Highland Hills neighborhood. Offering 1,056 sq. ft. of functional living space, this single-story residence features central air and a convenient covered driveway. The standout feature is the massive backyard, providing ample space for outdoor activities, gardening, or pets. Ideally situated for commuters with quick access to I-20 and I-45, and just minutes from Glendale Park. A perfect opportunity for first-time buyers or investors seeking value in a growing community.
Key facts
- Quick access to i-45
- Massive backyard
- Covered driveway
Tags
Property features AI
Finance
- Other: Possession at closing/funding; MLS status: Active
- Financial info: Listing terms: Cash or Conventional; Transaction type: For sale
- HOA & community: No homeowners association
Exterior
- Parking: Detached carport; Covered parking; Two covered/carport spaces
- Utilities: City water; City sewer; Asphalt access; Municipal utility district
- Home design: Single-family residence; Residential property; Built in 1999; One story
- Construction: Year built: 1999
- Exterior features: Lot under 0.5 acre (about 0.285 acres); Subdivision: Carver Heights; Directions: From I-20 Westbound take Exit 472. Turn right onto Bonnie View Rd and drive north ~1.3 miles. At Simpson Stuart Rd turn left. Continue and turn left on Tracy Rd.
Interior
- Kitchen: Dishwasher; Electric oven; Electric range; Refrigerator; Kitchen (14 x 16)
- Bedrooms: Three bedrooms total; Primary bedroom on level 1 (11 x 11); Bedroom on level 1 (11 x 10); Bedroom on level 1 (10 x 10)
- Bathrooms: Two full bathrooms
- Interior features: One-level layout; Five total rooms; One living area; One dining area; Other interior features
- Laundry & utility: Individual water meter
Neighborhood map
What this means for you Summary
Snapshot
- This is a 3-bed/2.0-bath single-family listed at $185k.
Deal economics
- At list price, monthly cash flow is $49 ($593/yr) — positive.
- The deal already cash-flows at list — no discount required.
- Meets the 1% rule at list price ($2k rent vs $185k).
- Recommended offer: $179k (3.0% below list) — sets the bar for market timing.
- Cap rate 6.6% vs local median 2.3% in Dallas — top-decile yield for the area; either an underpriced asset or a hidden risk that comps aren't pricing in. Stress-test before assuming the spread holds.
Location & tenants
- Location reads 81/100 on livability (#24 in TX, #1,380 nationally) — a professional / high-income tenant draw. Strengths: amenities A+, commute A+, housing A+; Watch: crime F.
- Dallas ISD (urban): math 31% / reading 36% proficiency, ranked #559 of 826 in TX (top 68%) — families likely to look elsewhere, expect single-tenant / working-renter base with shorter leases; 83% free/reduced lunch — lower-income household profile, screen leases tightly.
- Zoned schools: Whitney M Young Jr El (math 12% / reading 12%, grade F, #4,207 of 4,322 statewide, top 98%, 313 students, 91% FRL).
- Zoned-school proficiency averages 12% at this address vs 34% district-wide (-22 pts) — the specific schools serving this property underperform the Dallas ISD average; the district grade overstates school quality for this exact location.
- Market conditions: Rents soft (-2.8%/yr); 207 active listings in the ZIP; 35 comparable units currently listed for rent nearby; rentals leasing fast (median 8d on market — plan ~1-2 weeks tenant-placement turnaround); 12,577 units permitted in Dallas County in 2024 (6,829 in 5+ unit buildings).
- This rent runs 41% of the median local income ($54k/yr) — at the standard rent-burdened threshold; future hikes will face affordability resistance.
Forward outlook
- Local home prices are declining (-3.0%/yr); year-one equity from $1k of loan paydown is wiped out by about $6k of value loss. Plan a longer hold.
- Dallas County population projected at +35% by 2050 — long-run rental-demand tailwind backs the buy-and-hold thesis.
Negotiation context
- It's been on market 50 days — a 3% lower offer ($179k) is reasonable based on typical stale-listing flexibility.
Risks & watch-outs
- Climate carrying-cost: major wind risk, 27% chance of damaging wind over 30y; extreme-heat days projected 7→24/yr by 2055 (HVAC capex compounding) — expect insurance premiums to compound above CPI over the hold.
Questions for the listing agent
- It's been on market 50 days. Have you received any prior offers? Is the seller open to a 3% concession, seller financing, or rate buy-down credit?
- Is there a deadline driving the sale (1031 exchange, divorce, estate, relocation)? That informs how much negotiation room exists.
- Crime grade is F in this area — have there been break-ins, vandalism, or insurance claims at this property in the last 3 years? What carrier currently insures it and at what premium?
- What's the average days-on-market for RENTAL listings here right now (not sales)? A rising rental-DOM trend means longer vacancies and softer asking-rent achievability than the comps imply.
- What's the recent tenant-quality profile in this submarket — average credit score on applications, eviction rate, late-payment / NSF rate, and stable-employment percentage? A property-management company in the area should have these aggregated.
- How much new for-sale + rental construction is in the pipeline within 1–3 miles? Heavy new supply typically softens prices + rents 12–24 months out; constrained supply supports both.
Investment metrics
- 1% rule
- 1.01% ✓
- Cap rate
- 6.61%
- Cash-on-cash
- 1.14%
- DSCR
- 1.05
- GRM
- 8.3
CMA / ARV
- ARV (median comp)
- $223,352
- List price
- $185,000
- Delta
- -17.17%
- Verdict
- UNDERPRICED
- Comps
- 20 within 1.0 mi
Show comp detail 12 sales within ~0.75 mi
| Address | Dist | Beds/Ba | Sqft | Sold | Price | $/sf | Match |
|---|---|---|---|---|---|---|---|
| 6227 Teague Dr | 0.19mi | 3/2.0 | 1,142 (+8%) | 0mo | $220,000 | $193 | 77 |
| 2516 Fatima Ave | 0.37mi | 3/2.0 | 1,152 (+9%) | 7mo | $190,000 | $165 | 62 |
| 2465 Kemp St | 0.37mi | 3/2.0 | 1,120 (+6%) | 14mo | $219,000 | $196 | 61 |
| 6437 Leana Ave | 0.45mi | 3/1.0 | 1,164 (+10%) | 1mo | $209,900 | $180 | 57 |
| 6424 Teague Dr | 0.32mi | 3/1.0 | 912 (-14%) | 3mo | $125,000 | $137 | 56 |
| 6341 Leaning Oaks St | 0.70mi | 3/1.5 | 1,042 (-1%) | 11mo | $189,900 | $182 | 54 |
| 3464 Pinebrook Dr | 0.68mi | 3/1.5 | 1,149 (+9%) | 2mo | $200,000 | $174 | 50 |
| 3474 Pacesetter Dr | 0.75mi | 3/1.5 | 1,164 (+10%) | 3mo | $189,500 | $163 | 43 |
| 3450 Pacesetter Dr | 0.72mi | 4/1.5 (+1) | 1,100 (+4%) | 13mo | $210,000 | $191 | 42 |
| 3423 Judge Dupree Dr | 0.73mi | 4/2.0 (+1) | 1,187 (+12%) | 10mo | $210,000 | $177 | 32 |
| 3221 Little River Dr | 0.66mi | 3/2.0 | 1,202 (+14%) | 17mo | $190,000 | $158 | 32 |
| 6354 Cinnamon Oaks | 0.75mi | 4/2.0 (+1) | 1,202 (+14%) | 8mo | $238,400 | $198 | 30 |
Match score weights: distance 35% · size 25% · config 20% · recency 20%. Top-matched comps best support the ARV.
Projected returns pro-forma
-3.0% appreciation · 0.0% rent growth · sell at horizon
- IRR
- -18.2%
- Equity multiple
- 0.38×
- Total profit
- $-32,168
- Equity at exit
- $27,584
- IRR
- -18.8%
- Equity multiple
- 0.14×
- Total profit
- $-44,561
- Equity at exit
- $15,995
Cash invested: $51,800 (down + closing). Projections, not guarantees.
Landlord ↔ Tenant lean methodology
- Overall (STATE)
- 87 Strongly Landlord-Friendly
- State Texas
- 87 Strongly Landlord-Friendly · R+5
- County
- — inherits STATE
- City
- — inherits STATE
ZIP-level market 75241
- Home prices YoY
- -16.9%
- Rents YoY
- -2.8%
- Active inventory
- 207
- Price-to-rent
- 8.3×
Monthly cashflow live
- Estimated rent
- $1,861 high interval (Pro) →
- Mortgage (P&I)
- −$970
- Tax from tax record
- −$373 /mo · $4,478/yr
- Insurance
- −$77
- HOA
- −$0
- Vacancy / Maint / Mgmt
- −$391
- Net cashflow
- $49
Break-even live
UW: 25.0% down · 7.5% · 30yr · 1.5% tax · 5.0% vac · 8.0% maint · 8.0% mgmt
Financing live
Cash to close
- Down payment
- $46,250
- Closing costs
- $5,550
- Reserves months
- —
- Total cash needed
- —
Loan-product check · same deal, 3 products live
Conventional
25% down · 7.5% · 30yr
- Down + closing
- —
- Monthly P&I
- —
- Monthly cashflow
- —
- DSCR
- —
- Eligible?
- —
Personal DTI + credit; lowest rate.
DSCR
20% down · 8.5% · 30yr
- Down + closing
- —
- Monthly P&I
- —
- Monthly cashflow
- —
- DSCR
- —
- Eligible?
- —
No personal income docs; deal must DSCR.
Hard money
10% down · 12.0% · 12mo
- Down + closing
- —
- Monthly P&I
- —
- Monthly cashflow
- —
- DSCR
- —
- Eligible?
- —
Short-term bridge; refi at stabilization.
Rent comps 35 comps
| Address | Beds | Baths | Sqft | Rent | $/sqft | DOM | Units | Dist |
|---|---|---|---|---|---|---|---|---|
| 2525 Lyola St Dallas, TX | 3.0 | 2.0 | 1080 | $1,895 | $1.75 | 44d | 1 | 0.22mi |
| 3131 Simpson Stuart Rd Dallas, TX | 1.0–3.0 | 1.0–2.0 | 1024 | $1,694 | $1.65 | 3d | 33 | 0.37mi |
| 2703 Kool Ave Dallas, TX | 3.0 | 2.0 | 1248 | $1,700 | $1.36 | 24d | 1 | 0.39mi |
| 2520 Fatima Ave Dallas, TX | 3.0 | 2.0 | 1176 | $1,950 | $1.66 | 7d | 1 | 0.40mi |
| 2602 Ripple Rd Dallas, TX | 3.0 | 2.0 | 1232 | $1,700 | $1.38 | 44d | 1 | 0.45mi |
| 5761 Highland Hills Dr Dallas, TX | 1.0–3.0 | 1.0–2.0 | 1040 | $1,749 | $1.68 | 3d | 7 | 0.54mi |
| 5850 Highland Hills Dr Dallas, TX | 2.0–4.0 | 1.0–2.0 | 910 | $1,083 | $1.19 | 2d | 9 | 0.65mi |
| 2111 Crouch Rd Dallas, TX | 1.0–2.0 | 1.0–2.0 | 866 | $1,277 | $1.47 | 6d | 1 | 0.66mi |
| 3210 Little River Dr Dallas, TX | 3.0 | 2.0 | 1202 | $1,950 | $1.62 | 4d | 1 | 0.67mi |
| 3440 Simpson Stuart Rd Dallas, TX | 1.0–3.0 | 1.0–2.0 | 942 | $2,103 | $2.23 | 1d | 9 | 0.71mi |
| 6327 Hidden Trail Dr Dallas, TX | 3.0 | 2.0 | 1187 | $1,795 | $1.51 | 44d | 1 | 0.72mi |
| 3015 Flask Dr Dallas, TX | 3.0 | 2.0 | 1267 | $1,875 | $1.48 | 44d | 1 | 0.81mi |
| 5821 Bonnie View Rd Dallas, TX | 1.0–3.0 | 1.0–2.0 | 820 | $1,101 | $1.34 | 7d | 7 | 0.81mi |
| 6436 Moonhill Dr Dallas, TX | 4.0 | 2.0 | 1200 | $1,961 | $1.63 | 2d | 1 | 0.86mi |
| 6520 Warm Moon Ln Dallas, TX | 4.0 | 2.0 | 1237 | $1,995 | $1.61 | 4d | 1 | 0.89mi |
| 3623 Softcloud Dr Dallas, TX | 3.0 | 2.0 | 1477 | $1,910 | $1.29 | 44d | 1 | 0.91mi |
| 7312 Sierra Way Dallas, TX | 3.0 | 2.0 | 1439 | $1,900 | $1.32 | 2d | 1 | 0.96mi |
| 2919 N El Centro Way Dallas, TX | 4.0 | 2.0 | 1294 | $1,800 | $1.39 | 7d | 1 | 1.01mi |
| 3806 Castle Hills Dr Dallas, TX | 4.0 | 2.0 | 1422 | $1,900 | $1.34 | 17d | 1 | 1.06mi |
| 3522 Tioga St Dallas, TX | 4.0 | 3.0 | 1438 | $2,095 | $1.46 | 4d | 1 | 1.06mi |
| 1754 E Red Bird Ln Dallas, TX | 3.0 | 1.5 | 1115 | $1,675 | $1.50 | 7d | 1 | 1.08mi |
| 5828 Lazy River Dr Dallas, TX | 3.0 | 1.5 | 1134 | $1,600 | $1.41 | 44d | 1 | 1.09mi |
| 3528 Keyridge Dr Dallas, TX | 3.0 | 2.0 | 1362 | $1,795 | $1.32 | 21d | 1 | 1.14mi |
| 3835 Basswood Dr Dallas, TX | 3.0 | 2.0 | 1000 | $1,625 | $1.62 | 24d | 1 | 1.15mi |
| 6654 Cool Morn Dr Dallas, TX | 3.0 | 2.0 | 1446 | $2,300 | $1.59 | 44d | 1 | 1.18mi |
| 5175 Cardiff St Dallas, TX | 3.0 | 1.0 | 1248 | $1,650 | $1.32 | 44d | 1 | 1.22mi |
| 1706 Caravan Trl Dallas, TX | 3.0 | 2.0 | 1263 | $1,700 | $1.35 | 24d | 1 | 1.22mi |
| 5160 Cardiff St Dallas, TX | 4.0 | 2.0 | 1251 | $1,950 | $1.56 | 4d | 1 | 1.23mi |
| 5722 Old Ox Rd Dallas, TX | 3.0 | 2.0 | 1464 | $2,200 | $1.50 | 7d | 1 | 1.29mi |
| 6445 Baraboo Dr Dallas, TX | 4.0 | 1.5 | 1218 | $1,650 | $1.35 | 44d | 1 | 1.35mi |
| 2529 Morgan Dr Dallas, TX | 2.0 | 1.0 | 842 | $1,650 | $1.96 | 24d | 1 | 1.44mi |
| 1435 Whispering Trl Dallas, TX | 3.0 | 1.0 | 1047 | $1,660 | $1.59 | 7d | 1 | 1.47mi |
| 1441 Quartet Dr Dallas, TX | 3.0 | 2.0 | 1319 | $1,700 | $1.29 | 5d | 1 | 1.48mi |
| 6347 Racer Summit Dr Dallas, TX | 3.0 | 2.0 | 1175 | $1,965 | $1.67 | 24d | 1 | 1.49mi |
| 4934 Kildare Ave Dallas, TX | 3.0 | 2.0 | 1118 | $1,595 | $1.43 | 24d | 1 | 1.49mi |
Listing history 16 events
-
2026-06-18days on market $185,000 Active 50 DOM
-
2026-06-17days on market $185,000 Active 49 DOM
-
2026-06-16days on market $185,000 Active 48 DOM
-
2026-06-15days on market $185,000 Active 47 DOM
-
2026-06-13days on market $185,000 Active 45 DOM
-
2026-06-09days on market $185,000 Active 41 DOM
-
2026-06-08days on market $185,000 Active 40 DOM
-
2026-06-07days on market $185,000 Active 39 DOM
-
2026-06-04days on market $185,000 Active 36 DOM
-
2026-06-03days on market $185,000 Active 35 DOM
-
2026-06-02days on market $185,000 Active 34 DOM
-
2026-06-01days on market $185,000 Active 33 DOM
-
2026-05-31days on market $185,000 Active 32 DOM
-
2026-04-29$185,000 Active 541-char remark
-
2023-02-21soldstatus
-
1997-05-13soldstatus
ⓘ Source: listings_history table (triggers on properties + properties_extension) + one-shot
backfill from property_details.listing_events for pre-trigger history.
Tax reassessment forecast TX · Resets to sale price
- Current annual tax
- $4,478 · $373/mo
- Projected year-2 tax
- $4,478 · $373/mo
- Expected delta
- $0/yr ($0/mo · 0.0%)
ⓘ Screening estimate from a state-policy table — verify with the county assessor before closing.
Climate risk First Street
- Flood 1/10 Low FEMA zone X (unshaded) · 0% chance over 30 yrs
- Wildfire 3/10 Moderate
- Heat 7/10 Severe 7 d/yr ≥110°F today · 24 d/yr by 30 yrs out
- Wind 6/10 Major 27% chance of damaging wind over 30 yrs
- Air quality 2/10 Low 1 unhealthy d/yr today · 2 by 30 yrs out
Nearby sold comps map
Loading sold comps map…
Walkable amenities ~0.75 mi
Loading nearby amenities…
Taxation est. · year 1
- Rental income
- $22,326
- − Mortgage interest
- −$10,363
- − Property taxes
- −$4,478
- − Insurance
- −$925
- − Repairs & maintenance
- −$1,786
- − Management
- −$1,786
- − Depreciation
- −$5,382
- Taxable loss
- −$2,393
- Est. tax savings @ 24.0%
- +$574
- After-tax cash flow
- $1,167/yr
For passive investors: Depreciation is non-cash, so a rental often shows a tax loss while cash-flowing — sheltering income. Rental losses are passive: they offset passive income freely, and up to $25,000/yr can offset ordinary (W-2) income if you actively participate and your MAGI is under $100k (phasing out to $0 by $150k); unused losses carry forward. On sale, claimed depreciation is recaptured at up to 25%, and gains may owe capital-gains tax (a 1031 exchange can defer both). Figures are a year-1 estimate at your 24.0% rate — not tax advice; consult a CPA.
Schools (NCES district)
- District
- Dallas ISD
- NCES district ID
- 4816230
- Math proficiency
- 31% ▼ -16.00%
- Reading proficiency
- 36% ▼ -4.00%
- Median HH income
- $42,881
- Composite
- 28.41/100
- National rank
- #6763
- State rank
- #559 of 826 in TX
Livability — Dallas
- Score
- 81/100
- State rank
- #24
- US rank
- #1380
Category grades
Schools grade is shown separately in the Schools card above.
Census & demographics
- Census place
- Dallas, TX
- County
- Dallas County · 2,612,404 people
- City population
- 1,168,437
- Metro
- Dallas-Fort Worth-Arlington, TX
- Population (ZIP)
- 33,840
- Household income
- $53,998
- Rent vs Own
- Severe rent burden
- 1076.0
Population outlook (Dallas County) Hauer SSP2
- Today (2025)
- 2,979,839 people
- By 2030
- 3,191,823 · +7.1%
- By 2040
- 3,619,611 · +21.5%
- By 2050
- 4,026,915 · +35.1%
- By 2075
- 4,957,073 · +66.4%
- By 2100
- 5,508,725 · +84.9%
Race, ethnicity, and origin ACS 2023
- Neighborhood character
- Majority Black (62%)
- Race & ethnicity
- Black 62% Hispanic / Latino 30% Two or more races 8% White 5% Native American 2%
- Hispanic origin (detail)
- Mexican 24%
- Foreign-born
- 13% · Canada
- Languages at home
- 73% English-only · Spanish 25%
Political lean MEDSL · Dallas
- 2024 margin
- Strong D (+22.2) · D 60.2% · R 38.0% · Other 1.8%
- 2008→2024 swing
- +6.9pp toward D · 2008: 15.3pp · 2024: 22.2pp
- All cycles
- 2024: D+22.2 2020: D+31.6 2016: D+26.2 2012: D+15.4 2008: D+15.3
Not yet ingested
- Civics
- —
Market trends
- HPI YoY
- ▼ -72.36%
- Current HPI
- 356.2348
- Rent YoY
- ▼ -2.75%
- Metro
- Dallas-Fort Worth-Arlington, TX
- State GDP YoY
- ▲ 3.95%
- F500 in state
- 110
Industry mix (Fortune 500 HQ in TX)
| Industry | F500 HQs | Revenue |
|---|---|---|
| Energy | 16 | $1,198B |
|
||
| Technology | 5 | $198B |
|
||
| Engineering / Construction | 4 | $72B |
|
||
| Energy Services | 3 | $60B |
|
||
| Utilities | 3 | $41B |
|
||
| Healthcare | 2 | $330B |
|
||
Price history
3 events — show timeline
- 2026-04-29 Listed $185,000 NTREIS
- 2023-02-21 Sold (Public Records) — Public Records
- 1997-05-13 Sold (Public Records) — Public Records
Property tax history
+10.5%/yrLatest (2025): $4,478 · +20.0% YoY. Source: county tax records.
Cash-flow waterfall
monthlySold comps — $/sqft
last 12 mo · ≤1 miLoading sold comps…