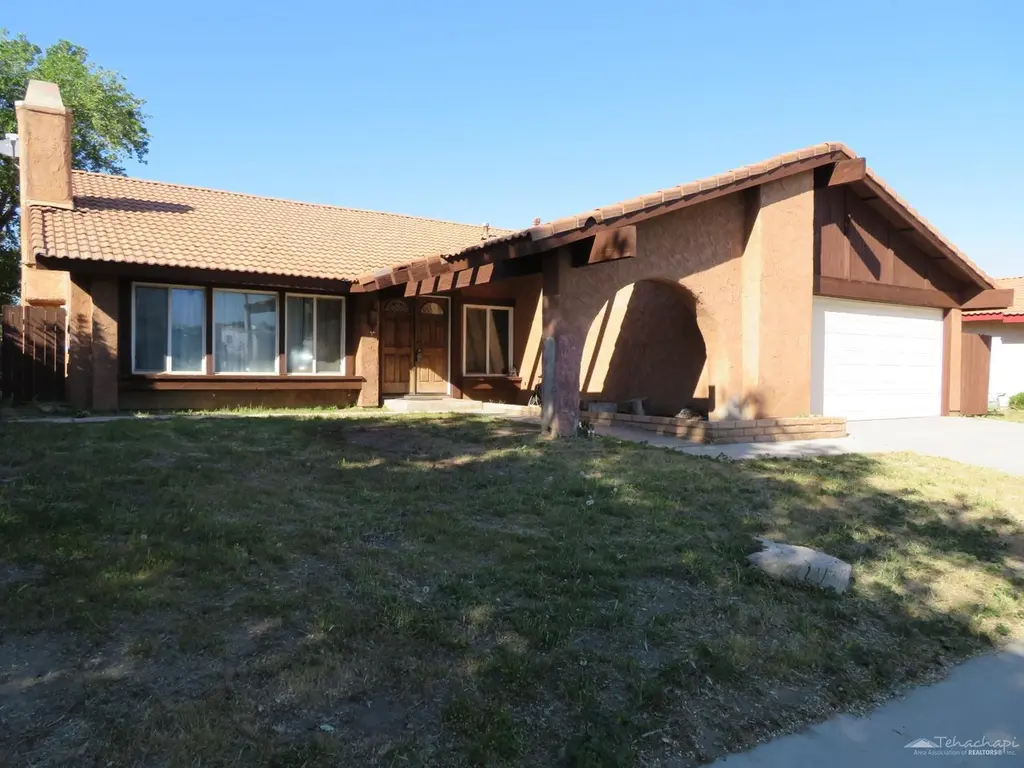
1213 Morven St · Lancaster, CA
Flood risk 1/10 · Minimal
- FEMA flood zone
- X (unshaded)
- Chance of flooding over 30 yrs
- 0.0%
- Est. flood insurance / yr
- $507 – $1,088
Fire risk 6/10 · Moderate
- Est. fire insurance / yr
- $659 – $1,223
Heat risk 7/10 · Major
- Hot days now (above 101°F)
- 7 days/yr
- Hot days in 30 yrs
- 18 days/yr
Wind risk 1/10 · Minimal
- Chance of severe wind over 30 yrs
- —
Air-quality risk 8/10 · Major
- Unhealthy air days now
- 16 days/yr
- Unhealthy air days in 30 yrs
- 21 days/yr
Risk factors via First Street. Map © Google.
Why this score? — see what drove the D+ grade
The composite is a weighted blend of 9 inputs, each scored 0–100. Each bar is that input's sub-score; the figure is the points it added to the 100-point composite (weight × sub-score).
- ARV discount +15.0/15.0
- Cash flow +14.0/30.0
- DSCR +4.3/10.0
- 1% rule +3.5/10.0
- Livability +3.4/5.0
- Rent growth +2.5/5.0
- Schools +2.5/10.0
- Condition / age +2.5/5.0
- Appreciation +0.0/10.0
$362,500
🖨 Deal sheet (PDF) 📄 Offer letter ✓ Due diligence
Listing remarks
Large 4 bedroom home with an open floor plan that's perfect for everyday living and entertaining. You've got a formal living room, dining room, a spacious family room and a beautiful floor-to-ceiling stone fireplace that really stands out. There's also a built-in bar area - great for drinks, coffee, or whatever fits your lifestyle. Vaulted ceilings make the space feel even bigger and give you plenty of room for a large TV setup. Some updates have already been done; including freshly painted exterior trim, newer carpet in the bedrooms, roof repairs, and a newer water heater. This home has great potential and just needs a little TLC. With your personal touch, it could really shine!
Key facts
- Open floor plan
- Built in bar area
- Newer carpet
Tags
Neighborhood map
What this means for you Summary
Snapshot
- This is a 4-bed/2.0-bath single-family listed at $362k.
Deal economics
- At list price, monthly cash flow is $48 ($576/yr) — positive.
- The deal already cash-flows at list — no discount required.
- To meet the 1% rule (rent ≥ 1% of price), the offer needs to be $307k (15.3% below list).
- Recommended offer: $307k (15.3% below list) — sets the bar for 1% rule.
- Cap rate 6.5% vs local median 4.3% in Lancaster — top-decile yield for the area; either an underpriced asset or a hidden risk that comps aren't pricing in. Stress-test before assuming the spread holds.
Location & tenants
- Location reads 68/100 on livability (#282 in CA) — a middle-class / working-renter tenant base. Strengths: commute A+, housing A+, amenities B+; Watch: health & safety C-, schools F, crime F.
- Lancaster Elementary (suburban): math 18% / reading 32% proficiency, ranked #1,161 of 1,400 in CA (top 83%) — low school quality limits family demand, transient renter base, plan for 1-2y turnover; 72% free/reduced lunch — lower-income household profile, screen leases tightly.
- Market conditions: Rents flat; 1169 active listings in the ZIP; 36 comparable units currently listed for rent nearby; rentals leasing fast (median 5d on market — plan ~1-2 weeks tenant-placement turnaround); 19,697 units permitted in Los Angeles County in 2024 (9,426 in 5+ unit buildings).
- At $3,070/mo this rent would consume 52% of the median local household income ($70k/yr) (locally 2494% of renters already pay >50% of income on rent) — very limited rent-growth headroom before tenants either downsize or default.
Forward outlook
- Local home prices are declining (-3.0%/yr); year-one equity from $3k of loan paydown is wiped out by about $11k of value loss. Plan a longer hold.
- Los Angeles County population projected at +9% by 2050 — modest demand growth; plan on rents tracking national, not racing it.
Negotiation context
- It's been on market 15 days — a 2% lower offer ($357k) is reasonable based on typical stale-listing flexibility.
- Current owner paid $112k; list at $362k implies a 224% gain — meaningful room to come down on a strong offer.
Risks & watch-outs
- Climate carrying-cost: major wildfire risk; extreme-heat days projected 7→18/yr by 2055 (HVAC capex compounding) — expect insurance premiums to compound above CPI over the hold.
Questions for the listing agent
- Built in 1977 — when were the roof, HVAC, electrical panel, plumbing, and water heater last replaced?
- Is there a deadline driving the sale (1031 exchange, divorce, estate, relocation)? That informs how much negotiation room exists.
- Schools are F-rated, which usually means shorter tenancies and higher turnover. Who's the typical renter profile here, and what's been the actual vacancy rate?
- Crime grade is F in this area — have there been break-ins, vandalism, or insurance claims at this property in the last 3 years? What carrier currently insures it and at what premium?
- The area grade is low — what's the realistic commute time and amenity access for the typical tenant pool here? Any planned neighborhood developments (good or bad) we should know about?
- What's the average days-on-market for RENTAL listings here right now (not sales)? A rising rental-DOM trend means longer vacancies and softer asking-rent achievability than the comps imply.
- What's the recent tenant-quality profile in this submarket — average credit score on applications, eviction rate, late-payment / NSF rate, and stable-employment percentage? A property-management company in the area should have these aggregated.
- How much new for-sale + rental construction is in the pipeline within 1–3 miles? Heavy new supply typically softens prices + rents 12–24 months out; constrained supply supports both.
Investment metrics
- 1% rule
- 0.85% ✗
- Cap rate
- 6.45%
- Cash-on-cash
- 0.57%
- DSCR
- 1.03
- GRM
- 9.8
CMA / ARV
- ARV (on-the-fly)
- $482,258
- Comps found
- 12
Show comp detail 12 sales within ~0.75 mi
| Address | Dist | Beds/Ba | Sqft | Sold | Price | $/sf | Match |
|---|---|---|---|---|---|---|---|
| 1213 Morven St | 0.00mi | 4/2.0 | 1,813 (0%) | 1mo | $375,000 | $207 | 99 |
| 44506 Tabler | 0.49mi | 4/2.0 | 1,892 (+4%) | 2mo | $416,500 | $220 | 69 |
| 44200 Gillan Ave | 0.50mi | 4/3.0 | 1,780 (-2%) | 2mo | $495,000 | $278 | 68 |
| 44520 Fenhold | 0.21mi | 4/3.0 | 2,043 (+13%) | 2mo | $349,000 | $171 | 63 |
| 1010 E Avenue J6 | 0.62mi | 4/2.0 | 1,714 (-6%) | 1mo | $429,995 | $251 | 62 |
| 707 E Avenue J4 | 0.66mi | 4/2.0 | 1,738 (-4%) | 2mo | $420,000 | $242 | 61 |
| 1503 E Kildare | 0.58mi | 4/3.0 | 1,717 (-5%) | 1mo | $480,000 | $280 | 59 |
| 836 E Pillsbury | 0.35mi | 5/2.0 (+1) | 1,604 (-12%) | 2mo | $485,000 | $302 | 58 |
| 44840 Fenhold | 0.45mi | 3/2.0 (-1) | 1,629 (-10%) | 2mo | $440,000 | $270 | 55 |
| 1017 E Avenue J5 | 0.52mi | 3/2.0 (-1) | 1,650 (-9%) | 1mo | $455,000 | $276 | 55 |
| 44919 Fenhold | 0.50mi | 3/2.0 (-1) | 1,598 (-12%) | 2mo | $420,000 | $263 | 51 |
| 1605 Bluebell | 0.74mi | 4/3.0 | 1,637 (-10%) | 1mo | $435,000 | $266 | 45 |
Match score weights: distance 35% · size 25% · config 20% · recency 20%. Top-matched comps best support the ARV.
Projected returns pro-forma
-3.0% appreciation · 0.14% rent growth · sell at horizon
- IRR
- -18.5%
- Equity multiple
- 0.37×
- Total profit
- $-64,305
- Equity at exit
- $54,050
- IRR
- -17.5%
- Equity multiple
- 0.16×
- Total profit
- $-85,475
- Equity at exit
- $31,342
Cash invested: $101,500 (down + closing). Projections, not guarantees.
Landlord ↔ Tenant lean methodology
- Overall (STATE)
- 18 Strongly Tenant-Friendly
- State California
- 18 Strongly Tenant-Friendly · D+13
- County
- — inherits STATE
- City
- — inherits STATE
ZIP-level market 93535
- Home prices YoY
- -24.3%
- Rents YoY
- 0.1%
- Active inventory
- 1169
- Price-to-rent
- 9.8×
Monthly cashflow live
- Estimated rent
- $3,070 high interval (Pro) →
- Mortgage (P&I)
- −$1,901
- Tax from tax record
- −$325 /mo · $3,903/yr
- Insurance
- −$151
- HOA
- −$0
- Vacancy / Maint / Mgmt
- −$645
- Net cashflow
- $48
Break-even live
Sensitivity live
| Price | -10% $253 | -5% $151 | +0% $48 | +5% $-55 | +10% $-157 |
|---|---|---|---|---|---|
| Rent | -10% $-195 | -5% $-73 | +0% $48 | +5% $169 | +10% $291 |
| Rate | -1.0pp $231 | -0.5pp $140 | base $48 | +0.5pp $-46 | +1.0pp $-142 |
UW: 25.0% down · 7.5% · 30yr · 1.5% tax · 5.0% vac · 8.0% maint · 8.0% mgmt
Financing live
Cash to close
- Down payment
- $90,625
- Closing costs
- $10,875
- Reserves months
- —
- Total cash needed
- —
Loan-product check · same deal, 3 products live
Conventional
25% down · 7.5% · 30yr
- Down + closing
- —
- Monthly P&I
- —
- Monthly cashflow
- —
- DSCR
- —
- Eligible?
- —
Personal DTI + credit; lowest rate.
DSCR
20% down · 8.5% · 30yr
- Down + closing
- —
- Monthly P&I
- —
- Monthly cashflow
- —
- DSCR
- —
- Eligible?
- —
No personal income docs; deal must DSCR.
Hard money
10% down · 12.0% · 12mo
- Down + closing
- —
- Monthly P&I
- —
- Monthly cashflow
- —
- DSCR
- —
- Eligible?
- —
Short-term bridge; refi at stabilization.
Rent comps 36 comps
| Address | Beds | Baths | Sqft | Rent | $/sqft | DOM | Units | Dist |
|---|---|---|---|---|---|---|---|---|
| 1253 Morven St Lancaster, CA | 4.0 | 2.0 | 1813 | $2,995 | $1.65 | 16d | 1 | 0.10mi |
| 44732 12th St E Lancaster, CA | 3.0 | 2.0 | 1426 | $2,600 | $1.82 | 16d | 1 | 0.25mi |
| 44745 Christie Ave Lancaster, CA | 5.0 | 3.0 | 2289 | $3,095 | $1.35 | 11d | 1 | 0.30mi |
| 44745 Christie Ave Lancaster, CA | 5.0 | 3.0 | 2289 | $3,095 | $1.35 | 2d | 1 | 0.30mi |
| 766 E Pillsbury St Lancaster, CA | 5.0 | 2.0 | 1604 | $2,500 | $1.56 | 11d | 1 | 0.40mi |
| 1545 E Avenue J5 Lancaster, CA | 3.0 | 2.0 | 1741 | $2,899 | $1.67 | 2d | 1 | 0.57mi |
| 718 E Avenue J4 Lancaster, CA | 4.0 | 2.0 | 1738 | $2,885 | $1.66 | 2d | 1 | 0.63mi |
| 44103 Sundance Ct Lancaster, CA | 5.0 | 3.0 | 2491 | $3,800 | $1.53 | 17d | 1 | 0.66mi |
| 1734 Lightcap St Lancaster, CA | 3.0 | 2.0 | 1467 | $2,700 | $1.84 | 2d | 1 | 0.67mi |
| 44908 Logue Ave Lancaster, CA | 3.0 | 2.0 | 1473 | $2,495 | $1.69 | 2d | 1 | 0.67mi |
| 837 Sunrise Ct Lancaster, CA | 3.0 | 2.0 | 1259 | $3,000 | $2.38 | 22d | 1 | 0.75mi |
| 837 Sunrise Ct Lancaster, CA | 3.0 | 2.0 | 1259 | $2,895 | $2.30 | 4d | 1 | 0.75mi |
| 45041 Colleen Dr Lancaster, CA | 3.0 | 3.0 | 1303 | $3,100 | $2.38 | 2d | 1 | 0.76mi |
| 44559 Aspen St Lancaster, CA | 4.0 | 4.0 | 2375 | $3,495 | $1.47 | 5d | 1 | 0.78mi |
| 44107 Rodin Ave Lancaster, CA | 3.0 | 2.0 | 1568 | $3,000 | $1.91 | 3d | 1 | 0.82mi |
| 44283 Raysack Ave Lancaster, CA | 4.0 | 2.0 | 1282 | $2,400 | $1.87 | 11d | 1 | 0.86mi |
| 44961 5th St E Lancaster, CA | 4.0 | 2.0 | 1248 | $2,500 | $2.00 | 2d | 1 | 0.97mi |
| 2141 E Nugent St Lancaster, CA | 4.0 | 3.0 | 2260 | $3,200 | $1.42 | 19d | 1 | 0.97mi |
| 44302 Kirkland Ave Lancaster, CA | 3.0 | 2.0 | 1602 | $2,250 | $1.40 | 2d | 1 | 0.97mi |
| 43702 Rembrandt St Lancaster, CA | 3.0 | 2.0 | 1272 | $2,500 | $1.97 | 19d | 1 | 1.04mi |
| 44514 Stanridge Ave Lancaster, CA | 3.0 | 2.0 | 1260 | $2,646 | $2.10 | 2d | 1 | 1.06mi |
| 233 E Nugent St Lancaster, CA | 3.0 | 2.0 | 1658 | $2,599 | $1.57 | 2d | 1 | 1.06mi |
| 43837 David St Lancaster, CA | 3.0 | 2.0 | 1300 | $2,450 | $1.88 | 2d | 1 | 1.09mi |
| 44538 2nd St E Lancaster, CA | 3.0 | 2.0 | 1260 | $2,380 | $1.89 | 2d | 1 | 1.11mi |
| 44119 Kirkland Ave Lancaster, CA | 3.0 | 2.0 | 1341 | $2,750 | $2.05 | 13d | 1 | 1.12mi |
| 44946 3rd St E Lancaster, CA | 4.0 | 2.0 | 1256 | $2,395 | $1.91 | 16d | 1 | 1.15mi |
| 43658 Rogier St Lancaster, CA | 3.0 | 2.0 | 1424 | $2,450 | $1.72 | 2d | 1 | 1.15mi |
| 44021 3rd St E Lancaster, CA | 4.0 | 2.0 | 1465 | $2,900 | $1.98 | 20d | 1 | 1.22mi |
| 44021 3rd St E Unit 44021 Lancaster, CA | 4.0 | 2.0 | 1465 | $3,500 | $2.39 | 2d | 1 | 1.22mi |
| 2500 Topaz Ln Lancaster, CA | 3.0 | 2.0 | 1274 | $2,800 | $2.20 | 24d | 1 | 1.30mi |
| 45402 5th St E Lancaster, CA | 4.0 | 2.0 | 1237 | $2,775 | $2.24 | 2d | 1 | 1.32mi |
| 44707 Cerisa St Lancaster, CA | 4.0 | 2.0 | 1714 | $3,000 | $1.75 | 11d | 1 | 1.36mi |
| 45428 Raysack Ave Lancaster, CA | 4.0 | 2.0 | 1244 | $2,900 | $2.33 | 2d | 1 | 1.36mi |
| 44709 26th St E Lancaster, CA | 3.0 | 2.0 | 1316 | $2,300 | $1.75 | 19d | 1 | 1.42mi |
| 2624 Via Verona Lancaster, CA | 3.0 | 2.5 | 1563 | $2,900 | $1.86 | 2d | 1 | 1.44mi |
| 2636 Via Verona Lancaster, CA | 5.0 | 2.5 | 2019 | $3,800 | $1.88 | 4d | 1 | 1.47mi |
Listing history 4 events
-
2026-04-02status Pending
-
2026-03-18$362,500 Active
-
1993-04-16soldstatus $112,000
-
1979-08-14soldstatus $22,000
ⓘ Source: listings_history table (triggers on properties + properties_extension) + one-shot
backfill from property_details.listing_events for pre-trigger history.
Tax reassessment forecast CA · Resets to sale price
- Current annual tax
- $3,903 · $325/mo
- Projected year-2 tax
- $3,903 · $325/mo
- Expected delta
- $0/yr ($0/mo · -0.0%)
ⓘ Screening estimate from a state-policy table — verify with the county assessor before closing.
Climate risk First Street
- Flood 1/10 Low FEMA zone X (unshaded) · 0% chance over 30 yrs
- Wildfire 6/10 Major
- Heat 7/10 Severe 7 d/yr ≥101°F today · 18 d/yr by 30 yrs out
- Wind 1/10 Low
- Air quality 8/10 Severe 16 unhealthy d/yr today · 21 by 30 yrs out
Nearby sold comps map
Loading sold comps map…
Walkable amenities ~0.75 mi
Loading nearby amenities…
Taxation est. · year 1
- Rental income
- $36,840
- − Mortgage interest
- −$20,306
- − Property taxes
- −$3,903
- − Insurance
- −$1,812
- − Repairs & maintenance
- −$2,947
- − Management
- −$2,947
- − Depreciation
- −$10,545
- Taxable loss
- −$5,621
- Est. tax savings @ 24.0%
- +$1,349
- After-tax cash flow
- $1,925/yr
For passive investors: Depreciation is non-cash, so a rental often shows a tax loss while cash-flowing — sheltering income. Rental losses are passive: they offset passive income freely, and up to $25,000/yr can offset ordinary (W-2) income if you actively participate and your MAGI is under $100k (phasing out to $0 by $150k); unused losses carry forward. On sale, claimed depreciation is recaptured at up to 25%, and gains may owe capital-gains tax (a 1031 exchange can defer both). Figures are a year-1 estimate at your 24.0% rate — not tax advice; consult a CPA.
Schools (NCES district)
- District
- Lancaster Elementary
- NCES district ID
- 0620880
- Math proficiency
- 18% ▲ 1.00%
- Reading proficiency
- 32% ▬ 0.00%
- Median HH income
- $46,440
- Composite
- 24.73/100
- National rank
- #13028
- State rank
- #1161 of 1400 in CA
Livability — Lancaster
- Score
- 68/100
- State rank
- #282
- US rank
- #9504
Category grades
Schools grade is shown separately in the Schools card above.
Census & demographics
- Census place
- Lancaster, CA
- County
- Los Angeles County · 9,444,647 people
- City population
- 194,251
- Metro
- Los Angeles-Long Beach-Anaheim, CA
- Population (ZIP)
- 79,409
- Household income
- $70,360
- Rent vs Own
- Severe rent burden
- 2494.0
Population outlook (Los Angeles County) Hauer SSP2
- Today (2025)
- 10,940,515 people
- By 2030
- 11,256,481 · +2.9%
- By 2040
- 11,729,929 · +7.2%
- By 2050
- 11,948,407 · +9.2%
- By 2075
- 11,818,114 · +8.0%
- By 2100
- 10,842,928 · -0.9%
Race, ethnicity, and origin ACS 2023
- Neighborhood character
- Diverse neighborhood (Simpson 0.63)
- Race & ethnicity
- Hispanic / Latino 55% Two or more races 25% Black 21% White 17% Asian 2% Native American 1%
- Hispanic origin (detail)
- Mexican 42%
- Common ancestry
- Romanian 1% Italian 1% Lithuanian 1%
- Foreign-born
- 13% · Canada
- Languages at home
- 60% English-only · Spanish 37% Tagalog/Filipino 1% Other Indo-European 1%
Political lean MEDSL · Los Angeles
- 2024 margin
- Solid D (+32.9) · D 64.8% · R 31.9% · Other 3.3%
- 2008→2024 swing
- -7.4pp toward R · 2008: 40.4pp · 2024: 32.9pp
- All cycles
- 2024: D+32.9 2020: D+44.2 2016: D+48.0 2012: D+40.0 2008: D+40.4
Not yet ingested
- Civics
- —
Market trends
- HPI YoY
- ▼ -144.13%
- Current HPI
- 449.4494
- Rent YoY
- ▲ 0.14%
- Metro
- Los Angeles-Long Beach-Anaheim, CA
- State GDP YoY
- ▲ 3.21%
- F500 in state
- 116
Industry mix (Fortune 500 HQ in CA)
| Industry | F500 HQs | Revenue |
|---|---|---|
| Technology | 27 | $1,492B |
|
||
| Financial Services | 3 | $174B |
|
||
| Retail | 3 | $44B |
|
||
| Insurance | 3 | $26B |
|
||
| Media / Entertainment | 2 | $115B |
|
||
| Pharmaceuticals / Biotech | 2 | $62B |
|
||
Price history
+1547.7% since first listed4 events — show timeline
- 2026-04-02 Pending — TAAR
- 2026-03-18 Listed $362,500 TAAR
- 1993-04-16 Sold (Public Records) $112,000 Public Records
- 1979-08-14 Sold (Public Records) $22,000 Public Records
Property tax history
+3.4%/yrLatest (2025): $3,903 · +5.6% YoY. Source: county tax records.
Cash-flow waterfall
monthlySold comps — $/sqft
last 12 mo · ≤1 miLoading sold comps…