4425 Nc 903 · Stokes, NC
Flood risk 1/10 · Minimal
- FEMA flood zone
- X (unshaded)
- Chance of flooding over 30 yrs
- 0.0%
- Est. flood insurance / yr
- $507 – $1,088
Fire risk 1/10 · Minimal
- Est. fire insurance / yr
- $906 – $1,684
Heat risk 8/10 · Major
- Hot days now (above 107°F)
- 7 days/yr
- Hot days in 30 yrs
- 16 days/yr
Wind risk 8/10 · Major
- Chance of severe wind over 30 yrs
- 80.0%
Air-quality risk 2/10 · Minimal
- Unhealthy air days now
- 0 days/yr
- Unhealthy air days in 30 yrs
- 1 days/yr
Risk factors via First Street. Map © Google.
Why this score? — see what drove the D+ grade
The composite is a weighted blend of 9 inputs, each scored 0–100. Each bar is that input's sub-score; the figure is the points it added to the 100-point composite (weight × sub-score).
- Cash flow +15.0/30.0
- 1% rule +5.0/10.0
- DSCR +5.0/10.0
- ARV discount +5.0/15.0
- Appreciation +5.0/10.0
- Schools +3.6/10.0
- Livability +3.2/5.0
- Rent growth +2.5/5.0
- Condition / age +1.5/5.0
$30,000
🖨 Deal sheet 📄 Offer letter ✓ Due diligence
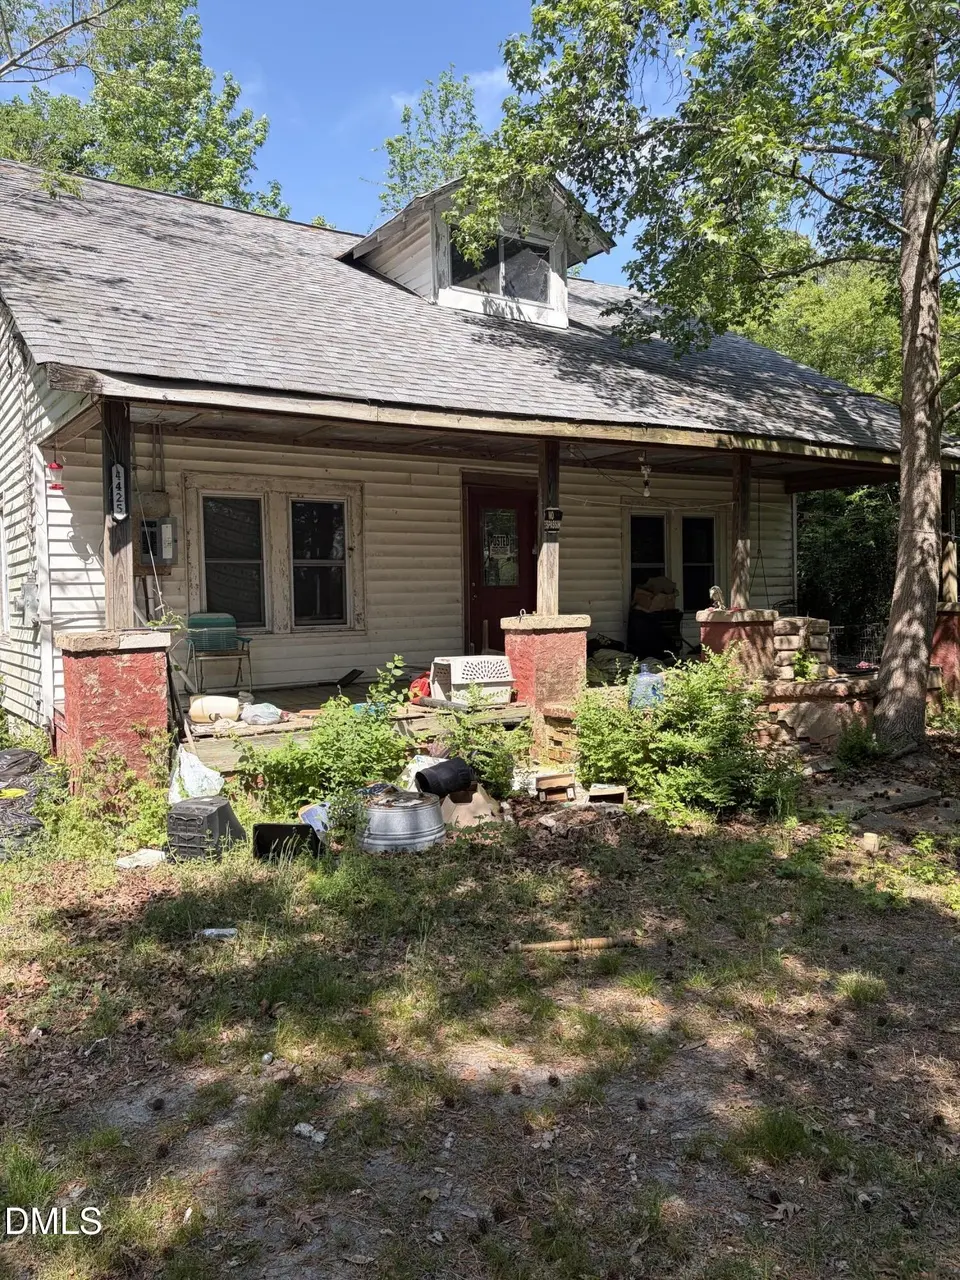
Listing remarks
Investor special with exceptional potential on 1.49 wooded acres in a rural setting. Built in 1901, this 2 bedroom, 1.5 bath home offers approximately 1,094 square feet and includes an upstairs loft area with a half bath that can be used as a 3rd bedroom. There is a detached 12x16 outbuilding for additional storage. The property offers the potential to subdivide into 2 lots, presenting additional opportunities for investors, builders, or those seeking a redevelopment project. The home previously experienced roof leaks that caused ceiling damage prior to the roof being replaced. Mildew and possible mold are present. Property is being sold as-is and will require significant renovation or may
Key facts
- Upstairs loft area
- Detached outbuilding
- Roof replaced
Tags
Property features AI
Finance
- Other: Lot size approximately 1.49 acres
- HOA & community: No association
Exterior
- Parking: Unpaved parking
- Utilities: Public water; Public sewer; Electricity available; Septic connected; Sewer connected; Water available
- Home design: House; One and one-half stories; Wooded lot, not waterfront; Facing direction not specified
- Construction: Vinyl siding; Asphalt roof; Built with standard foundation (year built not provided)
- Exterior features: Front porch; Rear porch; Outbuilding; Heavily wooded lot; Two drive entrances
Interior
- Bedrooms: 2 bedrooms (both on the main level)
- Flooring: Carpet; Hardwood
- Bathrooms: 1 full bathroom
- Heating & cooling: Electric heat; Central air conditioning
- Interior features: Carpet and hardwood flooring; Fixer condition
Neighborhood map
What this means for you Summary
Snapshot
- This is a 2-bed/1.0-bath single-family listed at $30k. Condition is rated poor.
Deal economics
- At list price, monthly cash flow is $853 ($10k/yr) — positive.
- The deal already cash-flows at list — no discount required.
- Meets the 1% rule at list price ($1k rent vs $30k).
Location & tenants
- Location reads 63/100 on livability (#405 in NC) — a middle-class / working-renter tenant base. Strengths: employment A+, cost of living A+, crime A; Watch: schools D, amenities F, commute F.
- Pitt County Schools (rural): math 41% / reading 44% proficiency, ranked #100 of 178 in NC (top 56%) — families likely to look elsewhere, expect single-tenant / working-renter base with shorter leases.
- Market conditions: 21 active listings in the ZIP; 1,300 units permitted in Pitt County in 2024 (204 in 5+ unit buildings).
Forward outlook
- In year one you build about $1k of equity ($207 loan paydown + $900 appreciation (3.0% local appreciation)).
- Pitt County population projected at +22% by 2050 — long-run rental-demand tailwind backs the buy-and-hold thesis.
- At projected returns (3.0% appreciation + 3.0% rent growth), your $8k cash investment doubles in ~1 year — after that, you're playing with house money.
Negotiation context
- Only 3 days on market — expect competitive offers; lowballing is unlikely to land.
Risks & watch-outs
- Watch-outs: built in 1901 — expect roof / HVAC / electrical / plumbing capex.
- Climate carrying-cost: severe wind risk, 80% chance of damaging wind over 30y; extreme-heat days projected 7→16/yr by 2055 (HVAC capex compounding) — expect insurance premiums to compound above CPI over the hold.
Questions for the listing agent
- Have any recent inspections been done? Can we get a copy of the seller's disclosures and any deferred-maintenance estimates?
- Built in 1901 — when were the roof, HVAC, electrical panel, plumbing, and water heater last replaced?
- Is there a deadline driving the sale (1031 exchange, divorce, estate, relocation)? That informs how much negotiation room exists.
- Schools are D-rated, which usually means shorter tenancies and higher turnover. Who's the typical renter profile here, and what's been the actual vacancy rate?
- The area grade is low — what's the realistic commute time and amenity access for the typical tenant pool here? Any planned neighborhood developments (good or bad) we should know about?
- What's the average days-on-market for RENTAL listings here right now (not sales)? A rising rental-DOM trend means longer vacancies and softer asking-rent achievability than the comps imply.
- What's the recent tenant-quality profile in this submarket — average credit score on applications, eviction rate, late-payment / NSF rate, and stable-employment percentage? A property-management company in the area should have these aggregated.
- How much new for-sale + rental construction is in the pipeline within 1–3 miles? Heavy new supply typically softens prices + rents 12–24 months out; constrained supply supports both.
Investment metrics
- 1% rule
- 4.48% ✓
- Cap rate
- 40.43%
- Cash-on-cash
- 121.93%
- DSCR
- 6.43
- GRM
- 1.9
CMA / ARV
- ARV (on-the-fly)
- $28,444
- Comps found
- 1
Show comp detail 1 sale within ~0.75 mi
| Address | Dist | Beds/Ba | Sqft | Sold | Price | $/sf | Match |
|---|---|---|---|---|---|---|---|
| 4425 Nc 903 | 0.00mi | 2/1.0 | 1,094 (0%) | 0mo | $28,000 | $26 | 100 |
Match score weights: distance 35% · size 25% · config 20% · recency 20%. Top-matched comps best support the ARV.
Projected returns pro-forma
3.0% appreciation · 3.0% rent growth · sell at horizon
- IRR
- —
- Equity multiple
- 7.90×
- Total profit
- $57,993
- Equity at exit
- $13,489
- IRR
- —
- Equity multiple
- 16.51×
- Total profit
- $130,300
- Equity at exit
- $20,789
Cash invested: $8,400 (down + closing). Projections, not guarantees.
Landlord ↔ Tenant lean methodology
- Overall (STATE)
- 85 Strongly Landlord-Friendly
- State North Carolina
- 85 Strongly Landlord-Friendly · R+3
- County
- — inherits STATE
- City
- — inherits STATE
ZIP-level market 27871
- Active inventory
- 21
- Price-to-rent
- 1.9×
Monthly cashflow live
- Estimated rent
- $1,343 medium interval (Pro) →
- Mortgage (P&I)
- −$157
- Tax est. 1.5%
- −$38 /mo · $450/yr
- Insurance
- −$12
- HOA
- −$0
- Vacancy / Maint / Mgmt
- −$282
- Net cashflow
- $853
Break-even live
UW: 25.0% down · 7.5% · 30yr · 1.5% tax · 5.0% vac · 8.0% maint · 8.0% mgmt
Financing live
Cash to close
- Down payment
- $7,500
- Closing costs
- $900
- Reserves months
- —
- Total cash needed
- —
Loan-product check · same deal, 3 products live
Conventional
25% down · 7.5% · 30yr
- Down + closing
- —
- Monthly P&I
- —
- Monthly cashflow
- —
- DSCR
- —
- Eligible?
- —
Personal DTI + credit; lowest rate.
DSCR
20% down · 8.5% · 30yr
- Down + closing
- —
- Monthly P&I
- —
- Monthly cashflow
- —
- DSCR
- —
- Eligible?
- —
No personal income docs; deal must DSCR.
Hard money
10% down · 12.0% · 12mo
- Down + closing
- —
- Monthly P&I
- —
- Monthly cashflow
- —
- DSCR
- —
- Eligible?
- —
Short-term bridge; refi at stabilization.
Listing history 4 events
-
2026-06-01status $30,000 Pending 3 DOM
-
2026-05-31days on market $30,000 Active 3 DOM
-
2026-05-30days on market $30,000 Active 2 DOM
-
2026-05-28$30,000 Active
ⓘ Source: listings_history table (triggers on properties + properties_extension) + one-shot
backfill from property_details.listing_events for pre-trigger history.
Climate risk First Street
- Flood 1/10 Low FEMA zone X (unshaded) · 0% chance over 30 yrs
- Wildfire 1/10 Low
- Heat 8/10 Severe 7 d/yr ≥107°F today · 16 d/yr by 30 yrs out
- Wind 8/10 Severe 80% chance of damaging wind over 30 yrs
- Air quality 2/10 Low 0 unhealthy d/yr today · 1 by 30 yrs out
Nearby sold comps map
Loading sold comps map…
Walkable amenities ~0.75 mi
Loading nearby amenities…
Taxation est. · year 1
- Rental income
- $16,113
- − Mortgage interest
- −$1,680
- − Property taxes
- −$450
- − Insurance
- −$150
- − Repairs & maintenance
- −$1,289
- − Management
- −$1,289
- − Depreciation
- −$873
- Taxable income
- $10,382
- Est. tax owed @ 24.0%
- −$2,492
- After-tax cash flow
- $7,750/yr
For passive investors: Depreciation is non-cash, so a rental often shows a tax loss while cash-flowing — sheltering income. Rental losses are passive: they offset passive income freely, and up to $25,000/yr can offset ordinary (W-2) income if you actively participate and your MAGI is under $100k (phasing out to $0 by $150k); unused losses carry forward. On sale, claimed depreciation is recaptured at up to 25%, and gains may owe capital-gains tax (a 1031 exchange can defer both). Figures are a year-1 estimate at your 24.0% rate — not tax advice; consult a CPA.
Condition & rehab AI · 6 photos
This property requires extensive renovation, including roof replacement and exterior repairs, to become move-in ready. Significant value can be added through these improvements, enhancing both resale and rental potential.
Repairs flagged
- Major roof — Significant damage
- Major siding — Weathered and damaged
- Major landscaping — Overgrown and debris-filled
- Major fencing — In poor condition
Value-add opportunities
- Both roof replacement — Critical to safety and appearance
- Both exterior painting — Enhances curb appeal and value
- Both landscaping and debris removal — Improves curb appeal and safety
- Both fencing repair — Enhances safety and property value
Renovation cost estimate screening
| Repair item | Severity | Est. cost |
|---|---|---|
| roof · Significant damage | Major | $15,000–50,000 |
| siding · Weathered and damaged | Major | $15,000–50,000 |
| landscaping · Overgrown and debris-filled | Major | $15,000–50,000 |
| fencing · In poor condition | Major | $15,000–50,000 |
| Total estimated repair cost · 4 items | $60,000–200,000 |
Value-add ROI direction
- Both roof replacement — Critical to safety and appearance ↑
- Both exterior painting — Enhances curb appeal and value ↑
- Both landscaping and debris removal — Improves curb appeal and safety ↑
- Both fencing repair — Enhances safety and property value ↑
ⓘ Cost ranges are severity-bucket heuristics (US national rule-of-thumb). Get contractor quotes + a written scope before underwriting a rehab budget.
Schools (NCES district)
- District
- Pitt County Schools
- NCES district ID
- 3700012
- Math proficiency
- 41% ▬ 0.00%
- Reading proficiency
- 44% ▲ 2.00%
- Median HH income
- $40,631
- Composite
- 35.67/100
- National rank
- #4877
- State rank
- #100 of 178 in NC
Livability — Stokes
- Score
- 63/100
- State rank
- #405
- US rank
- #15382
Category grades
Schools grade is shown separately in the Schools card above.
Census & demographics
- City population
- 1,608
- Population (ZIP)
- 3,559
Population outlook (Pitt County) Hauer SSP2
- Today (2025)
- 194,585 people
- By 2030
- 203,756 · +4.7%
- By 2040
- 220,807 · +13.5%
- By 2050
- 236,614 · +21.6%
- By 2075
- 275,940 · +41.8%
- By 2100
- 300,058 · +54.2%
Race, ethnicity, and origin ACS 2023
- Neighborhood character
- Diverse neighborhood (Simpson 0.60)
- Race & ethnicity
- Black 45% White 45% Two or more races 10% Hispanic / Latino 5%
- Hispanic origin (detail)
- Mexican 5%
- Common ancestry
- Serbian 3% Lithuanian 1% Italian 1%
- Foreign-born
- 1%
Political lean MEDSL · Pitt
- 2024 margin
- Lean D (+6.0) · D 52.5% · R 46.5% · Other 1.1%
- 2008→2024 swing
- -2.8pp toward R · 2008: 8.8pp · 2024: 6.0pp
- All cycles
- 2024: D+6.0 2020: D+9.4 2016: D+7.4 2012: D+6.7 2008: D+8.8
Not yet ingested
- Civics
- —
Market trends
- HPI YoY
- —
- Current HPI
- —
- Rent YoY
- —
- Metro
- —
- State GDP YoY
- ▲ 3.28%
- F500 in state
- 26
Industry mix (Fortune 500 HQ in NC)
| Industry | F500 HQs | Revenue |
|---|---|---|
| Financial Services | 2 | $213B |
|
||
| Retail | 2 | $95B |
|
||
| Industrial Conglomerate | 1 | $38B |
|
||
| Metals / Steel | 1 | $35B |
|
||
| Utilities | 1 | $30B |
|
||
| Industrial Machinery | 1 | $19B |
|
||
Price history
1 event — show timeline
- 2026-05-28 Listed $30,000 TMLS
Cash-flow waterfall
monthlySold comps — $/sqft
last 12 mo · ≤1 miLoading sold comps…