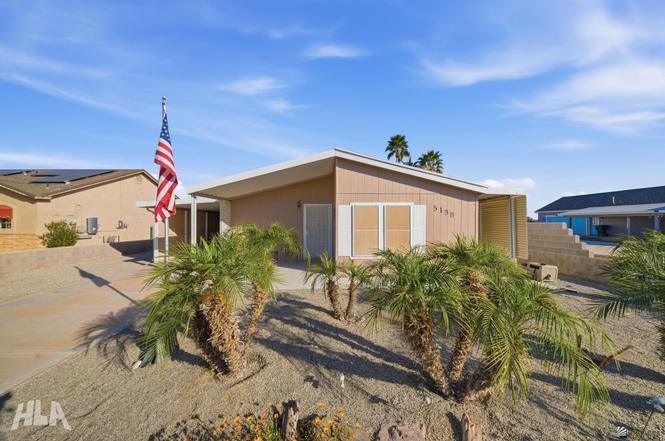
5138 E 33 Pl · Yuma, AZ
Flood risk 1/10 · Minimal
- FEMA flood zone
- X (shaded)
- Chance of flooding over 30 yrs
- 0.0%
- Est. flood insurance / yr
- $507 – $1,088
Fire risk 4/10 · Minor
- Est. fire insurance / yr
- $610 – $1,132
Heat risk 9/10 · Severe
- Hot days now (above 114°F)
- 7 days/yr
- Hot days in 30 yrs
- 18 days/yr
Wind risk 1/10 · Minimal
- Chance of severe wind over 30 yrs
- —
Air-quality risk 2/10 · Minimal
- Unhealthy air days now
- 1 days/yr
- Unhealthy air days in 30 yrs
- 1 days/yr
Risk factors via First Street. Map © Google.
Why this score? — see what drove the D grade
The composite is a weighted blend of 9 inputs, each scored 0–100. Each bar is that input's sub-score; the figure is the points it added to the 100-point composite (weight × sub-score).
- Cash flow +18.1/30.0
- ARV discount +5.9/15.0
- DSCR +5.7/10.0
- 1% rule +4.2/10.0
- Livability +3.6/5.0
- Condition / age +2.5/5.0
- Rent growth +2.4/5.0
- Schools +1.3/10.0
- Appreciation +0.0/10.0
$230,000
🖨 Deal sheet (PDF) 📄 Offer letter ✓ Due diligence
Listing remarks
Welcome to this spacious double-wide home located in the desirable 55+ community of Citrus View 1. Bright and inviting, the living room features vaulted ceilings and picturesque windows that fill the home with natural light. The open layout flows into a nice-sized kitchen with an adjoining breakfast area and formal dining room—perfect for everyday living and entertaining. With a remarkably low HOA of just $50 per year and easy access to both Yuma and the Foothills, this 2-bedroom, 2-bath + Den home offers comfort, space, and value in a welcoming neighborhood.
Key facts
- Formal dining room
- Double-wide home
- Natural light
Tags
Property features AI
Finance
- HOA & community: Homeowners association with $50 fee
Exterior
- Parking: Two total parking spaces; Two covered parking spaces; Attached carport (2 spaces); Attached garage
- Security: Smoke detector(s)
- Utilities: Public water; Public sewer
- Home design: Manufactured home (mobile/manufactured); Residential property; Located in Citrus View subdivision; Situated in a senior community
- Construction: Shed(s) as an other structure
- Exterior features: Paved road access; Curbs
Interior
- Kitchen: Disposal; Refrigerator; Microwave; Dishwasher; Gas range
- Flooring: Tile; Carpet
- Bathrooms: One full bathroom; One three-quarter bathroom
- Heating & cooling: Heating present; Cooling present
- Interior features: Built-in blinds; Smoke detectors; Shed on property
- Laundry & utility: Washer; Dryer
Neighborhood map
What this means for you Summary
Snapshot
- This is a 3-bed/2.0-bath manufactured listed at $230k.
Deal economics
- At list price, monthly cash flow is $202 ($2k/yr) — positive.
- The deal already cash-flows at list — no discount required.
- To meet the 1% rule (rent ≥ 1% of price), the offer needs to be $211k (8.4% below list).
- Recommended offer: $202k (12.0% below list) — sets the bar for market timing.
- Cap rate 7.3% vs local median 3.9% in Yuma — top-decile yield for the area; either an underpriced asset or a hidden risk that comps aren't pricing in. Stress-test before assuming the spread holds.
Location & tenants
- Location reads 71/100 on livability (#30 in AZ) — a middle-class / working-renter tenant base. Strengths: cost of living A+, housing A+, health & safety A+; Watch: crime C-, employment D, commute F.
- Yuma Union High School District (4507) (urban): math 14% / reading 16% proficiency, ranked #212 of 249 in AZ (top 85%) — low school quality limits family demand, transient renter base, plan for 1-2y turnover.
- Zoned schools: Gila Ridge High School (math 13% / reading 17%, grade F, #263 of 381 statewide, top 70%, 2,309 students, 55% FRL).
- Market conditions: Rents soft (-0.4%/yr); 468 active listings in the ZIP; 3 comparable units currently listed for rent nearby; rentals at typical pace (median 15d on market — plan ~3-4 weeks tenant-placement turnaround); 1,399 units permitted in Yuma County in 2024 (180 in 5+ unit buildings).
- This rent runs 36% of the median local income ($70k/yr) — at the standard rent-burdened threshold; future hikes will face affordability resistance.
Forward outlook
- Local home prices are declining (-3.0%/yr); year-one equity from $2k of loan paydown is wiped out by about $7k of value loss. Plan a longer hold.
- Yuma County population projected at +4% by 2050 — modest demand growth; plan on rents tracking national, not racing it.
Negotiation context
- It's been on market 123 days — a 12% lower offer ($202k) is reasonable based on typical stale-listing flexibility.
- 2 sale attempts with the ask held roughly flat each time — persistent listings suggest the price (not the market) is what's stuck; bring a comps-based counter.
- Current owner paid $24k; list at $230k implies a 859% gain — meaningful room to come down on a strong offer.
Risks & watch-outs
- Climate carrying-cost: extreme-heat days projected 7→18/yr by 2055 (HVAC capex compounding) — expect insurance premiums to compound above CPI over the hold.
Questions for the listing agent
- It's been on market 123 days. Have you received any prior offers? Is the seller open to a 12% concession, seller financing, or rate buy-down credit?
- What does the HOA fee cover, when was the last increase, and are there any pending special assessments or reserve-fund shortfalls?
- Why hasn't it sold? Are there any deal-killer items the seller is aware of (foundation, flood, title, zoning, code violations)?
- Is there a deadline driving the sale (1031 exchange, divorce, estate, relocation)? That informs how much negotiation room exists.
- The area grade is low — what's the realistic commute time and amenity access for the typical tenant pool here? Any planned neighborhood developments (good or bad) we should know about?
- What's the average days-on-market for RENTAL listings here right now (not sales)? A rising rental-DOM trend means longer vacancies and softer asking-rent achievability than the comps imply.
- What's the recent tenant-quality profile in this submarket — average credit score on applications, eviction rate, late-payment / NSF rate, and stable-employment percentage? A property-management company in the area should have these aggregated.
- How much new for-sale + rental construction is in the pipeline within 1–3 miles? Heavy new supply typically softens prices + rents 12–24 months out; constrained supply supports both.
Investment metrics
- 1% rule
- 0.92% ✗
- Cap rate
- 7.34%
- Cash-on-cash
- 3.76%
- DSCR
- 1.17
- GRM
- 9.1
CMA / ARV
- ARV (on-the-fly)
- $221,904
- Comps found
- 4
Show comp detail 4 sales within ~0.75 mi
| Address | Dist | Beds/Ba | Sqft | Sold | Price | $/sf | Match |
|---|---|---|---|---|---|---|---|
| 5266 E 34 St | 0.17mi | 3/2.0 | 1,404 (-9%) | 14mo | $190,000 | $135 | 66 |
| 3031 S Tangerine Ave | 0.37mi | 3/2.0 | 1,455 (-6%) | 15mo | $199,900 | $137 | 62 |
| 3040 S Lemon Ave | 0.35mi | 3/2.0 | 1,456 (-6%) | 19mo | $210,000 | $144 | 58 |
| 5293 E 30 Pl | 0.33mi | 4/2.0 (+1) | 1,430 (-7%) | 16mo | $225,000 | $157 | 55 |
Match score weights: distance 35% · size 25% · config 20% · recency 20%. Top-matched comps best support the ARV.
Projected returns pro-forma
-3.0% appreciation · 0.0% rent growth · sell at horizon
- IRR
- -13.6%
- Equity multiple
- 0.52×
- Total profit
- $-30,653
- Equity at exit
- $34,294
- IRR
- -9.9%
- Equity multiple
- 0.47×
- Total profit
- $-34,217
- Equity at exit
- $19,886
Cash invested: $64,400 (down + closing). Projections, not guarantees.
Landlord ↔ Tenant lean methodology
- Overall (STATE)
- 87 Strongly Landlord-Friendly
- State Arizona
- 87 Strongly Landlord-Friendly · R+3
- County
- — inherits STATE
- City
- — inherits STATE
ZIP-level market 85365
- Home prices YoY
- -23.6%
- Rents YoY
- -0.4%
- Active inventory
- 468
- Price-to-rent
- 9.1×
Monthly cashflow live
- Estimated rent
- $2,108 medium interval (Pro) →
- Mortgage (P&I)
- −$1,206
- Tax from tax record
- −$112 /mo · $1,339/yr
- Insurance
- −$96
- HOA
- −$50
- Vacancy / Maint / Mgmt
- −$443
- Net cashflow
- $202
Break-even live
Sensitivity live
| Price | -10% $332 | -5% $267 | +0% $202 | +5% $136 | +10% $71 |
|---|---|---|---|---|---|
| Rent | -10% $35 | -5% $118 | +0% $202 | +5% $285 | +10% $368 |
| Rate | -1.0pp $317 | -0.5pp $260 | base $202 | +0.5pp $142 | +1.0pp $81 |
UW: 25.0% down · 7.5% · 30yr · 1.5% tax · 5.0% vac · 8.0% maint · 8.0% mgmt
Financing live
Cash to close
- Down payment
- $57,500
- Closing costs
- $6,900
- Reserves months
- —
- Total cash needed
- —
Loan-product check · same deal, 3 products live
Conventional
25% down · 7.5% · 30yr
- Down + closing
- —
- Monthly P&I
- —
- Monthly cashflow
- —
- DSCR
- —
- Eligible?
- —
Personal DTI + credit; lowest rate.
DSCR
20% down · 8.5% · 30yr
- Down + closing
- —
- Monthly P&I
- —
- Monthly cashflow
- —
- DSCR
- —
- Eligible?
- —
No personal income docs; deal must DSCR.
Hard money
10% down · 12.0% · 12mo
- Down + closing
- —
- Monthly P&I
- —
- Monthly cashflow
- —
- DSCR
- —
- Eligible?
- —
Short-term bridge; refi at stabilization.
Rent comps 3 comps
| Address | Beds | Baths | Sqft | Rent | $/sqft | DOM | Units | Dist |
|---|---|---|---|---|---|---|---|---|
| 6141 E 40th Pl Yuma, AZ | 3.0 | 2.0 | 1576 | $1,600 | $1.02 | 15d | 1 | 1.35mi |
| 6555 E 35th St Yuma, AZ | 3.0 | 2.0 | 1848 | $2,250 | $1.22 | 15d | 1 | 1.46mi |
| 6575 E 35th Rd Yuma, AZ | 3.0 | 2.0 | 1262 | $2,500 | $1.98 | 15d | 1 | 1.50mi |
HOA detail
- Monthly dues
- $50 · $600/yr
Listing history 21 events
-
2026-06-21days on market $230,000 Active 123 DOM
-
2026-06-19days on market $230,000 Active 121 DOM
-
2026-06-18days on market $230,000 Active 120 DOM
-
2026-06-17days on market $230,000 Active 119 DOM
-
2026-06-16days on market $230,000 Active 118 DOM
-
2026-06-15days on market $230,000 Active 117 DOM
-
2026-06-14days on market $230,000 Active 115 DOM
-
2026-06-13days on market $230,000 Active 114 DOM
-
2026-06-10days on market $230,000 Active 112 DOM
-
2026-06-09days on market $230,000 Active 111 DOM
-
2026-06-08days on market $230,000 Active 110 DOM
-
2026-06-07days on market $230,000 Active 109 DOM
-
2026-06-05days on market $230,000 Active 106 DOM
-
2026-06-02days on market $230,000 Active 104 DOM
-
2026-06-01days on market $230,000 Active 103 DOM
-
2026-05-31days on market $230,000 Active 102 DOM
-
2026-05-30days on market $230,000 Active 101 DOM
-
2026-04-19status Active
-
2026-03-19historical Active Under Contract
-
2026-02-18$230,000 Active
-
2001-03-29soldstatus $23,995
ⓘ Source: listings_history table (triggers on properties + properties_extension) + one-shot
backfill from property_details.listing_events for pre-trigger history.
Tax reassessment forecast AZ · Resets to sale price
- Current annual tax
- $1,339 · $112/mo
- Projected year-2 tax
- $1,518 · $126/mo
- Expected delta
- +$179/yr (+$15/mo · 13.4%)
ⓘ Screening estimate from a state-policy table — verify with the county assessor before closing.
Climate risk First Street
- Flood 1/10 Low FEMA zone X (shaded) · 0% chance over 30 yrs
- Wildfire 4/10 Moderate
- Heat 9/10 Extreme 7 d/yr ≥114°F today · 18 d/yr by 30 yrs out
- Wind 1/10 Low
- Air quality 2/10 Low 1 unhealthy d/yr today · 1 by 30 yrs out
Nearby sold comps map
Loading sold comps map…
Walkable amenities ~0.75 mi
Loading nearby amenities…
Taxation est. · year 1
- Rental income
- $25,293
- − Mortgage interest
- −$12,884
- − Property taxes
- −$1,339
- − Insurance
- −$1,150
- − Repairs & maintenance
- −$2,023
- − Management
- −$2,023
- − HOA
- −$600
- − Depreciation
- −$6,691
- Taxable loss
- −$1,417
- Est. tax savings @ 24.0%
- +$340
- After-tax cash flow
- $2,759/yr
For passive investors: Depreciation is non-cash, so a rental often shows a tax loss while cash-flowing — sheltering income. Rental losses are passive: they offset passive income freely, and up to $25,000/yr can offset ordinary (W-2) income if you actively participate and your MAGI is under $100k (phasing out to $0 by $150k); unused losses carry forward. On sale, claimed depreciation is recaptured at up to 25%, and gains may owe capital-gains tax (a 1031 exchange can defer both). Figures are a year-1 estimate at your 24.0% rate — not tax advice; consult a CPA.
Schools (NCES district)
- District
- Yuma Union High School District (4507)
- NCES district ID
- 0409630
- Math proficiency
- 14% ▼ -12.00%
- Reading proficiency
- 16% ▼ -10.00%
- Median HH income
- $40,512
- Composite
- 12.86/100
- National rank
- #9592
- State rank
- #212 of 249 in AZ
Livability — Yuma
- Score
- 71/100
- State rank
- #30
- US rank
- #6635
Category grades
Schools grade is shown separately in the Schools card above.
Census & demographics
- Census place
- Yuma, AZ
- County
- Yuma County · 149,809 people
- City population
- 149,809
- Metro
- Yuma, AZ
- Population (ZIP)
- 54,775
- Household income
- $70,331
- Rent vs Own
- Severe rent burden
- 766.0
Population outlook (Yuma County) Hauer SSP2
- Today (2025)
- 211,633 people
- By 2030
- 214,114 · +1.2%
- By 2040
- 217,856 · +2.9%
- By 2050
- 220,276 · +4.1%
- By 2075
- 222,359 · +5.1%
- By 2100
- 198,880 · -6.0%
Race, ethnicity, and origin ACS 2023
- Neighborhood character
- Diverse neighborhood (Simpson 0.58)
- Race & ethnicity
- Hispanic / Latino 47% White 44% Two or more races 23% Black 2% Asian 1% Native American 1%
- Hispanic origin (detail)
- Mexican 43%
- Common ancestry
- Lithuanian 2% Italian 1% Romanian 1%
- Foreign-born
- 17% · Canada
- Languages at home
- 62% English-only · Spanish 36% Tagalog/Filipino 1% Other Asian/Pacific 1%
Political lean MEDSL · Yuma
- 2024 margin
- Strong R (+20.4) · D 39.3% · R 59.8%
- 2008→2024 swing
- -6.6pp toward R · 2008: -13.8pp · 2024: -20.4pp
- All cycles
- 2024: R+20.4 2020: R+6.2 2016: R+5.5 2012: R+16.1 2008: R+13.8
Not yet ingested
- Civics
- —
Market trends
- HPI YoY
- ▼ -75.03%
- Current HPI
- 242.8651
- Rent YoY
- ▼ -0.38%
- Metro
- Yuma, AZ
- State GDP YoY
- ▲ 4.54%
- F500 in state
- 20
Industry mix (Fortune 500 HQ in AZ)
| Industry | F500 HQs | Revenue |
|---|---|---|
| Technology | 2 | $13B |
|
||
| Mining / Metals | 1 | $23B |
|
||
| Environmental Services | 1 | $16B |
|
||
| Metals / Steel | 1 | $14B |
|
||
| Technology Distribution | 1 | $9B |
|
||
| Homebuilding | 1 | $8B |
|
||
Price history
+858.5% since first listed4 events — show timeline
- 2026-04-19 Relisted — YAR
- 2026-03-19 Contingent — YAR
- 2026-02-18 Listed $230,000 YAR
- 2001-03-29 Sold (Public Records) $23,995 Public Records
Property tax history
+2.1%/yrLatest (2025): $1,339 · +3.1% YoY. Source: county tax records.
Cash-flow waterfall
monthlySold comps — $/sqft
last 12 mo · ≤1 miLoading sold comps…