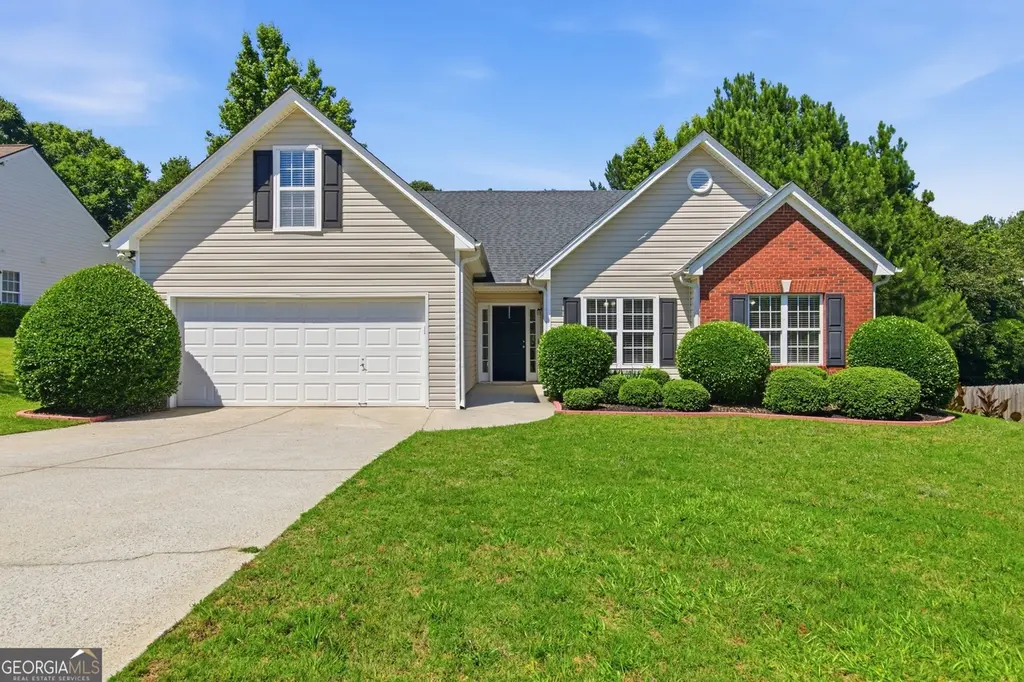
2520 Cordillo Dr · Dacula, GA
Flood risk 1/10 · Minimal
- FEMA flood zone
- X (unshaded)
- Chance of flooding over 30 yrs
- 0.0%
- Est. flood insurance / yr
- $507 – $1,088
Fire risk 2/10 · Minimal
- Est. fire insurance / yr
- $963 – $1,789
Heat risk 5/10 · Moderate
- Hot days now (above 103°F)
- 7 days/yr
- Hot days in 30 yrs
- 18 days/yr
Wind risk 4/10 · Minor
- Chance of severe wind over 30 yrs
- 17.0%
Air-quality risk 4/10 · Minor
- Unhealthy air days now
- 6 days/yr
- Unhealthy air days in 30 yrs
- 7 days/yr
Risk factors via First Street. Map © Google.
Why this score? — see what drove the D grade
The composite is a weighted blend of 9 inputs, each scored 0–100. Each bar is that input's sub-score; the figure is the points it added to the 100-point composite (weight × sub-score).
- Cash flow +12.8/30.0
- ARV discount +8.0/15.0
- DSCR +3.8/10.0
- Schools +3.7/10.0
- Rent growth +3.5/5.0
- Livability +3.2/5.0
- 1% rule +2.5/10.0
- Condition / age +2.5/5.0
- Appreciation +0.0/10.0
$350,000
🖨 Deal sheet 📄 Offer letter ✓ Due diligence
Listing remarks MLS
Best Value in the Mill Creek School District! This move-in ready ranch home offers the convenience of main-level living with three bedrooms and two full bathrooms on the main level, plus the added flexibility of an upstairs bonus room and dedicated movie theater room, perfect for entertaining, working from home, creating a playroom, or enjoying a private retreat. Fresh interior paint, new flooring, and a landscaped, fully fenced backyard with a newly added patio and new fence provide a clean, refreshed feel both inside and out. The owner's suite features an updated shower with new glass and door enclosure. Additional improvements include a 2022 water heater, 2025 dishwasher, smart thermostat, smart garage door system with app control, and fiber internet availability. Located in an established swim/tennis neighborhood with convenient access to shopping, dining, parks, and major commuter routes, this home combines flexible living space, modern upgrades, smart-home features, and a highly desirable location in the Mill Creek school cluster, making it an exceptional opportunity for buyers seeking both value and convenience.
Key facts
- 0.41 acre lot
- 2 garage spots
- Community pool
Property features AI
Finance
- Other: Roads are paved with county road frontage; Directions: Please use GPS
- HOA & community: Community amenities include pool and tennis courts; Association fee $230 semi-annually (includes swim and tennis)
Exterior
- Parking: Attached garage with 2 spaces; Total 2 parking spaces
- Utilities: Public water; Public sewer; Electricity available; Natural gas available; Cable available
- Home design: Two levels; Resale property; Brick and vinyl siding exterior; Composition roof; Slab foundation
- Construction: Built with brick and vinyl siding
- Exterior features: Private backyard; Back yard fencing; Patio; Community spa
Interior
- Kitchen: White cabinets; Eat-in kitchen; Stone countertops; Dishwasher; Refrigerator; Gas oven and gas cooktop; Microwave
- Bedrooms: Three main-level bedrooms; One upper-level bedroom; Primary suite located on the main level
- Flooring: Luxury vinyl; Carpet; Vinyl
- Bathrooms: Two full bathrooms; Primary bath with separate tub and shower
- Heating & cooling: Central air conditioning; Forced air heating
- Interior features: One masonry fireplace; Double vanities in baths; Walk-in closets; Insulated windows; Open concept dining area; Home theater
- Laundry & utility: Laundry located in hall
Neighborhood map
What this means for you Summary
Snapshot
- This is a 4-bed/2.0-bath single-family listed at $350k.
Deal economics
- At list price, monthly cash flow is $-29 ($-346/yr) — negative.
- To cash-flow at today's rent, offer at most $345k (1.5% below list).
- To meet the 1% rule (rent ≥ 1% of price), the offer needs to be $264k (24.7% below list).
- Recommended offer: $264k (24.7% below list) — sets the bar for 1% rule.
- Cap rate 6.2% vs local median 4.1% in Dacula — top-decile yield for the area; either an underpriced asset or a hidden risk that comps aren't pricing in. Stress-test before assuming the spread holds.
Location & tenants
- Location reads 65/100 on livability (#211 in GA) — a middle-class / working-renter tenant base. Strengths: cost of living A+, housing A+, crime B; Watch: amenities F, commute F, health & safety D-.
- Gwinnett County (suburban): math 39% / reading 43% proficiency, ranked #32 of 174 in GA (top 18%) — families likely to look elsewhere, expect single-tenant / working-renter base with shorter leases.
- Zoned schools: Fort Daniel Elementary School (math 50% / reading 54%, grade C-, #227 of 1,228 statewide, top 19%, 691 students, 37% FRL); Osborne Middle School (math 62% / reading 63%, grade B+, #33 of 470 statewide, top 7%, 1,667 students, 25% FRL); Mill Creek High School (math 32% / reading 45%, grade F, #61 of 424 statewide, top 15%, 2,839 students, 22% FRL) — zoned schools average 28% FRL vs 47% district-wide (19 pts lower); this property's tenant base skews higher-income than the district average.
- Market conditions: Rents rising fast (+4.1%/yr); 643 active listings in the ZIP; 16 comparable units currently listed for rent nearby; rentals at typical pace (median 22d on market — plan ~3-4 weeks tenant-placement turnaround); high-income renter base; 5,607 units permitted in Gwinnett County in 2024 (1,277 in 5+ unit buildings).
Forward outlook
- Local home prices are declining (-3.0%/yr); year-one equity from $2k of loan paydown is wiped out by about $10k of value loss. Plan a longer hold.
- Gwinnett County population projected at +47% by 2050 — long-run rental-demand tailwind backs the buy-and-hold thesis.
Negotiation context
- Only 9 days on market — expect competitive offers; lowballing is unlikely to land.
- 5 sale attempts since 7y ago with the ask held roughly flat each time — persistent listings suggest the price (not the market) is what's stuck; bring a comps-based counter.
- Current owner paid $250k; 40% above their basis — modest negotiation headroom, anchor on the comps not their cost.
Risks & watch-outs
- Climate carrying-cost: extreme-heat days projected 7→18/yr by 2055 (HVAC capex compounding) — expect insurance premiums to compound above CPI over the hold.
Questions for the listing agent
- What do current leases actually rent for vs. the listed asking? Can we see a recent rent roll and the last 12 months of T-12 income?
- What does the HOA fee cover, when was the last increase, and are there any pending special assessments or reserve-fund shortfalls?
- Is there a deadline driving the sale (1031 exchange, divorce, estate, relocation)? That informs how much negotiation room exists.
- The area grade is low — what's the realistic commute time and amenity access for the typical tenant pool here? Any planned neighborhood developments (good or bad) we should know about?
- What's the average days-on-market for RENTAL listings here right now (not sales)? A rising rental-DOM trend means longer vacancies and softer asking-rent achievability than the comps imply.
- What's the recent tenant-quality profile in this submarket — average credit score on applications, eviction rate, late-payment / NSF rate, and stable-employment percentage? A property-management company in the area should have these aggregated.
- How much new for-sale + rental construction is in the pipeline within 1–3 miles? Heavy new supply typically softens prices + rents 12–24 months out; constrained supply supports both.
Investment metrics
- 1% rule
- 0.75% ✗
- Cap rate
- 6.19%
- Cash-on-cash
- -0.35%
- DSCR
- 0.98
- GRM
- 11.1
CMA / ARV
- ARV (on-the-fly)
- $353,822
- Comps found
- 12
Show comp detail 12 sales within ~0.75 mi
| Address | Dist | Beds/Ba | Sqft | Sold | Price | $/sf | Match |
|---|---|---|---|---|---|---|---|
| 1505 Heatherton Rd | 0.16mi | 3/2.0 (-1) | 1,792 (+1%) | 6mo | $345,000 | $193 | 81 |
| 1695 Heatherton Rd | 0.32mi | 4/2.0 | 1,717 (-3%) | 4mo | $349,900 | $204 | 76 |
| 1500 Wilkes Crest Dr | 0.38mi | 3/2.0 (-1) | 1,732 (-3%) | 0mo | $350,000 | $202 | 73 |
| 2425 Fort Daniels Dr | 0.52mi | 4/2.0 | 1,812 (+2%) | 6mo | $350,000 | $193 | 68 |
| 1400 Wilkes Crest Dr | 0.47mi | 3/2.0 (-1) | 1,740 (-2%) | 5mo | $362,000 | $208 | 65 |
| 1725 Heatherton Rd | 0.36mi | 4/2.0 | 2,005 (+13%) | 1mo | $336,000 | $168 | 61 |
| 2416 Moultrie Ct | 0.36mi | 3/2.0 (-1) | 1,946 (+9%) | 6mo | $345,900 | $178 | 58 |
| 3135 Evergreen Eve Xing | 0.73mi | 3/2.0 (-1) | 1,815 (+2%) | 0mo | $365,000 | $201 | 57 |
| 2717 Wilding Green Ln | 0.69mi | 3/2.0 (-1) | 1,834 (+3%) | 1mo | $400,000 | $218 | 56 |
| 1281 Carson View Ct | 0.58mi | 4/3.0 | 1,956 (+10%) | 3mo | $387,500 | $198 | 50 |
| 1603 Fort Perry Way | 0.48mi | 4/2.5 | 2,008 (+13%) | 6mo | $365,000 | $182 | 49 |
| 2755 Fort Daniels Dr | 0.68mi | 3/2.0 (-1) | 1,933 (+9%) | 2mo | $385,000 | $199 | 47 |
Match score weights: distance 35% · size 25% · config 20% · recency 20%. Top-matched comps best support the ARV.
Projected returns pro-forma
-3.0% appreciation · 4.06% rent growth · sell at horizon
- IRR
- -15.9%
- Equity multiple
- 0.43×
- Total profit
- $-55,859
- Equity at exit
- $52,186
- IRR
- -6.0%
- Equity multiple
- 0.59×
- Total profit
- $-39,693
- Equity at exit
- $30,262
Cash invested: $98,000 (down + closing). Projections, not guarantees.
Landlord ↔ Tenant lean methodology
- Overall (STATE)
- 90 Strongly Landlord-Friendly
- State Georgia
- 90 Strongly Landlord-Friendly · R+3
- County
- — inherits STATE
- City
- — inherits STATE
ZIP-level market 30019
- Rents YoY
- 4.1%
- Active inventory
- 643
- Price-to-rent
- 11.1×
Monthly cashflow live
- Estimated rent
- $2,637 high interval (Pro) →
- Mortgage (P&I)
- −$1,835
- Tax from tax record
- −$93 /mo · $1,116/yr
- Insurance
- −$146
- HOA
- −$38
- Vacancy / Maint / Mgmt
- −$554
- Net cashflow
- $-29
Break-even live
UW: 25.0% down · 7.5% · 30yr · 1.5% tax · 5.0% vac · 8.0% maint · 8.0% mgmt
Financing live
Cash to close
- Down payment
- $87,500
- Closing costs
- $10,500
- Reserves months
- —
- Total cash needed
- —
Loan-product check · same deal, 3 products live
Conventional
25% down · 7.5% · 30yr
- Down + closing
- —
- Monthly P&I
- —
- Monthly cashflow
- —
- DSCR
- —
- Eligible?
- —
Personal DTI + credit; lowest rate.
DSCR
20% down · 8.5% · 30yr
- Down + closing
- —
- Monthly P&I
- —
- Monthly cashflow
- —
- DSCR
- —
- Eligible?
- —
No personal income docs; deal must DSCR.
Hard money
10% down · 12.0% · 12mo
- Down + closing
- —
- Monthly P&I
- —
- Monthly cashflow
- —
- DSCR
- —
- Eligible?
- —
Short-term bridge; refi at stabilization.
Rent comps 16 comps
| Address | Beds | Baths | Sqft | Rent | $/sqft | DOM | Units | Dist |
|---|---|---|---|---|---|---|---|---|
| 2447 Moultrie Ct Dacula, GA | 4.0 | 2.5 | 2136 | $2,425 | $1.14 | 12d | 1 | 0.33mi |
| 1603 Fort Perry Way Dacula, GA | 3.0 | 2.5 | 1925 | $2,245 | $1.17 | 3d | 1 | 0.50mi |
| 1645 Fort Mason Way Dacula, GA | 4.0 | 2.0 | 1778 | $2,400 | $1.35 | 43d | 1 | 0.50mi |
| 1281 Carson View Ct Dacula, GA | 4.0 | 3.0 | 1956 | $2,295 | $1.17 | 43d | 1 | 0.58mi |
| 1707 Mountain Fort Way Dacula, GA | 3.0 | 2.0 | 1642 | $1,950 | $1.19 | 44d | 1 | 0.65mi |
| 2180 Castle Royale Dr Lawrenceville, GA | 4.0 | 3.0 | 2322 | $2,475 | $1.07 | 20d | 1 | 0.74mi |
| 3105 Evergreen Eve Xing Dacula, GA | 3.0 | 2.0 | 1848 | $2,215 | $1.20 | 44d | 1 | 0.77mi |
| 2159 Shin Ct Buford, GA | 4.0 | 2.5 | 2586 | $2,480 | $0.96 | 18d | 1 | 0.88mi |
| 1985 Castle Royale Dr Lawrenceville, GA | 4.0 | 2.5 | 1919 | $2,121 | $1.11 | 5d | 1 | 0.89mi |
| 1984 Pierce Way Buford, GA | 4.0 | 2.5 | 2428 | $2,400 | $0.99 | 24d | 1 | 1.06mi |
| 1852 Auburn Rd Dacula, GA | 3.0–4.0 | 2.5–3.0 | 2458 | $2,627 | $1.07 | 2d | 3 | 1.07mi |
| 2393 Hampton Park Dr Buford, GA | 4.0 | 3.0 | 2323 | $2,450 | $1.05 | 20d | 1 | 1.10mi |
| 3164 Brooksong Way Dacula, GA | 4.0 | 2.5 | 2315 | $2,389 | $1.03 | 22d | 1 | 1.26mi |
| 3245 Ambergrove Trce Dacula, GA | 4.0 | 2.5 | 2320 | $2,900 | $1.25 | 24d | 1 | 1.29mi |
| 1557 Grove Arbor Ter Dacula, GA | 4.0 | 2.5 | 2500 | $2,286 | $0.91 | 43d | 1 | 1.34mi |
| 2182 Lazy Days Rd Dacula, GA | 3.0 | 2.0 | 2275 | $1,150 | $0.51 | 22d | 1 | 1.45mi |
HOA detail
- Monthly dues
- $38 · $456/yr
- Likely covers
- waterinternet
Listing history 6 events
-
2026-06-13statusdays on market $350,000 Pending 9 DOM
-
2026-06-09days on market $350,000 Active Under Contract 5 DOM
-
2026-06-08statusdays on market $350,000 Active Under Contract 4 DOM
-
2026-06-07statusdays on market $350,000 Active 3 DOM
-
2026-06-04remarks 699-char remark
-
2026-06-04$350,000 Coming Soon 1 DOM
ⓘ Source: listings_history table (triggers on properties + properties_extension) + one-shot
backfill from property_details.listing_events for pre-trigger history.
Tax reassessment forecast GA · Resets to sale price
- Current annual tax
- $1,116 · $93/mo
- Projected year-2 tax
- $3,220 · $268/mo
- Expected delta
- +$2,104/yr (+$175/mo · 188.7%)
ⓘ Screening estimate from a state-policy table — verify with the county assessor before closing.
Climate risk First Street
- Flood 1/10 Low FEMA zone X (unshaded) · 0% chance over 30 yrs
- Wildfire 2/10 Low
- Heat 5/10 Major 7 d/yr ≥103°F today · 18 d/yr by 30 yrs out
- Wind 4/10 Moderate 17% chance of damaging wind over 30 yrs
- Air quality 4/10 Moderate 6 unhealthy d/yr today · 7 by 30 yrs out
Nearby sold comps map
Loading sold comps map…
Walkable amenities ~0.75 mi
Loading nearby amenities…
Taxation est. · year 1
- Rental income
- $31,646
- − Mortgage interest
- −$19,605
- − Property taxes
- −$1,116
- − Insurance
- −$1,750
- − Repairs & maintenance
- −$2,532
- − Management
- −$2,532
- − HOA
- −$456
- − Depreciation
- −$10,182
- Taxable loss
- −$6,526
- Est. tax savings @ 24.0%
- +$1,566
- After-tax cash flow
- $1,220/yr
For passive investors: Depreciation is non-cash, so a rental often shows a tax loss while cash-flowing — sheltering income. Rental losses are passive: they offset passive income freely, and up to $25,000/yr can offset ordinary (W-2) income if you actively participate and your MAGI is under $100k (phasing out to $0 by $150k); unused losses carry forward. On sale, claimed depreciation is recaptured at up to 25%, and gains may owe capital-gains tax (a 1031 exchange can defer both). Figures are a year-1 estimate at your 24.0% rate — not tax advice; consult a CPA.
Schools (NCES district)
- District
- Gwinnett County
- NCES district ID
- 1302550
- Math proficiency
- 39% ▼ -15.00%
- Reading proficiency
- 43% ▼ -10.00%
- Median HH income
- $62,416
- Composite
- 36.5/100
- National rank
- #4648
- State rank
- #32 of 174 in GA
Livability — Dacula
- Score
- 65/100
- State rank
- #211
- US rank
- #12728
Category grades
Schools grade is shown separately in the Schools card above.
Census & demographics
- County
- Gwinnett County · 952,346 people
- City population
- 51,162
- Metro
- Atlanta-Sandy Springs-Alpharetta, GA
- Population (ZIP)
- 51,162
- Household income
- $116,583
- Rent vs Own
- Severe rent burden
- 630.0
Population outlook (Gwinnett County) Hauer SSP2
- Today (2025)
- 1,106,028 people
- By 2030
- 1,211,414 · +9.5%
- By 2040
- 1,422,277 · +28.6%
- By 2050
- 1,623,204 · +46.8%
- By 2075
- 2,105,240 · +90.3%
- By 2100
- 2,443,321 · +120.9%
Race, ethnicity, and origin ACS 2023
- Neighborhood character
- Diverse neighborhood (Simpson 0.67)
- Race & ethnicity
- White 49% Black 27% Hispanic / Latino 13% Two or more races 10% Asian 6%
- Hispanic origin (detail)
- Mexican 5% Puerto Rican 2%
- Common ancestry
- Hispanic 3% Italian 2% Romanian 2%
- Foreign-born
- 16% · Canada, Vietnam, Jamaica
- Languages at home
- 78% English-only · Spanish 10% Other Indo-European 3% French/Haitian/Cajun 2%
Political lean MEDSL · Gwinnett
- 2024 margin
- D (+16.5) · D 57.6% · R 41.1% · Other 1.2%
- 2008→2024 swing
- +26.8pp toward D · 2008: -10.2pp · 2024: 16.5pp
- All cycles
- 2024: D+16.5 2020: D+18.3 2016: D+5.8 2012: R+9.4 2008: R+10.2
Not yet ingested
- Civics
- —
Market trends
- HPI YoY
- ▼ -155.48%
- Current HPI
- 212.925
- Rent YoY
- ▲ 4.06%
- Metro
- Atlanta-Sandy Springs-Alpharetta, GA
- State GDP YoY
- ▲ 2.66%
- F500 in state
- 28
Industry mix (Fortune 500 HQ in GA)
| Industry | F500 HQs | Revenue |
|---|---|---|
| Paper / Packaging | 2 | $29B |
|
||
| Retail | 1 | $160B |
|
||
| Transportation / Logistics | 1 | $91B |
|
||
| Airlines | 1 | $62B |
|
||
| Consumer Goods | 1 | $47B |
|
||
| Utilities | 1 | $25B |
|
||
Price history
+133.3% since first listed18 events — show timeline
- 2026-06-05 Listed $350,000 GAMLS
- 2026-06-05 Listed $350,000 FMLS
- 2026-06-04 Listing Removed — GAMLS
- 2026-06-03 Coming Soon $350,000 GAMLS
- 2026-06-03 Coming Soon — GAMLS
- 2026-06-03 Coming Soon $350,000 FMLS
- 2019-11-04 Sold (Public Records) $249,900 Public Records
- 2019-10-30 Sold (MLS) $249,900 GAMLS
- 2019-10-30 Sold (MLS) $249,900 FMLS
- 2019-10-15 Pending — GAMLS
- 2019-10-04 Pending — FMLS
- 2019-09-06 Relisted — FMLS
- 2019-09-04 Pending — FMLS
- 2019-08-30 Price Changed $249,900 FMLS
- 2019-08-30 Price Changed $249,000 FMLS
- 2019-08-21 Listed $254,900 GAMLS
- 2019-08-21 Listed $254,900 FMLS
- 2014-12-23 Sold (Public Records) $150,000 Public Records
Property tax history
-2.5%/yrLatest (2025): $1,116 · +34.0% YoY. Source: county tax records.
Cash-flow waterfall
monthlySold comps — $/sqft
last 12 mo · ≤1 miLoading sold comps…