1175 Milam Ave · Brownsville, TX
Flood risk 5/10 · Moderate
- FEMA flood zone
- X (unshaded)
- Chance of flooding over 30 yrs
- 0.24%
- Est. flood insurance / yr
- $507 – $1,088
Fire risk 3/10 · Minor
- Est. fire insurance / yr
- $1,222 – $2,270
Heat risk 8/10 · Major
- Hot days now (above 110°F)
- 3 days/yr
- Hot days in 30 yrs
- 9 days/yr
Wind risk 9/10 · Severe
- Chance of severe wind over 30 yrs
- 99.0%
Air-quality risk 2/10 · Minimal
- Unhealthy air days now
- 1 days/yr
- Unhealthy air days in 30 yrs
- 1 days/yr
Risk factors via First Street. Map © Google.
Why this score? — see what drove the C grade
The composite is a weighted blend of 9 inputs, each scored 0–100. Each bar is that input's sub-score; the figure is the points it added to the 100-point composite (weight × sub-score).
- Cash flow +20.0/30.0
- ARV discount +12.7/15.0
- DSCR +6.3/10.0
- 1% rule +4.6/10.0
- Rent growth +4.5/5.0
- Livability +4.0/5.0
- Condition / age +2.5/5.0
- Schools +2.2/10.0
- Appreciation +0.0/10.0
$155,000
🖨 Deal sheet 📄 Offer letter ✓ Due diligence
Listing remarks MLS
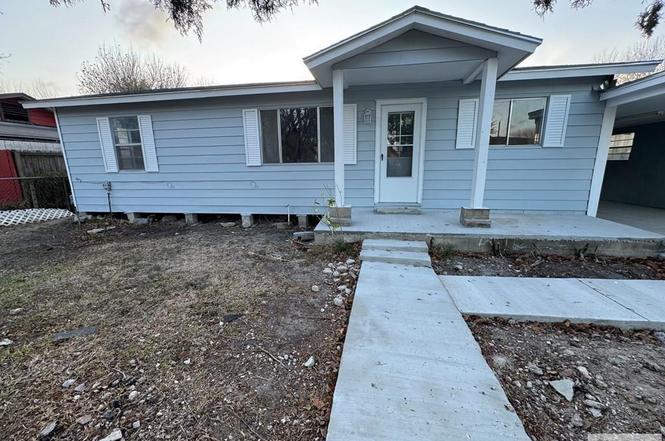
This 3-bedroom, 1-bath home sits on a spacious 60 x 105 lot and offers potential new beginnings for the right buyer. While it needs TLC, this property is priced to sell and presents a fantastic opportunity for investors or those looking to renovate. This property is being sold "AS IS" and CASH ONLY. ALL OFFERS MUST BE ACCOMPANIED BY PROOF OF FUNDS. EMAIL OFFERS TO: [email protected] or vteam. [email protected]
Key facts
- New roof shingles
- New a/c unit
- Fully fenced
Tags
Neighborhood map
What this means for you Summary
Snapshot
- This is a 3-bed/2.0-bath single-family listed at $155k.
Deal economics
- At list price, monthly cash flow is $190 ($2k/yr) — positive.
- The deal already cash-flows at list — no discount required.
- To meet the 1% rule (rent ≥ 1% of price), the offer needs to be $148k (4.3% below list).
- Recommended offer: $148k (4.3% below list) — sets the bar for 1% rule.
- Cap rate 7.8% vs local median 5.0% in Brownsville — top-decile yield for the area; either an underpriced asset or a hidden risk that comps aren't pricing in. Stress-test before assuming the spread holds.
Location & tenants
- Location reads 79/100 on livability (#62 in TX, #2,311 nationally) — a middle-class / working-renter tenant base. Strengths: commute A+, cost of living A+, housing A+; Watch: amenities D, crime D-, employment F.
- Brownsville ISD (urban): math 20% / reading 34% proficiency, ranked #710 of 826 in TX (top 86%) — low school quality limits family demand, transient renter base, plan for 1-2y turnover; 83% free/reduced lunch — lower-income household profile, screen leases tightly.
- Zoned schools: Champion El (math 21% / reading 26%, grade F, #3,247 of 4,322 statewide, top 76%, 655 students, 95% FRL); Perkins Middle (math 11% / reading 18%, grade F, #1,583 of 1,662 statewide, top 96%, 571 students, 96% FRL); Rivera Early College H S (math 12% / reading 38%, grade F, #1,250 of 1,632 statewide, top 77%, 2,254 students, 84% FRL).
- Market conditions: Rents rising fast (+8.2%/yr); 365 active listings in the ZIP; 16 comparable units currently listed for rent nearby; rentals lingering (median 44d on market — plan ~5-8 weeks vacancy on turnover, expect pricing pressure); 50% of comp listings sitting > 30 days — soft ceiling on asking rent; lower-income renter base — watch delinquency; 2,326 units permitted in Cameron County in 2024 (503 in 5+ unit buildings).
- This rent runs 40% of the median local income ($45k/yr) — at the standard rent-burdened threshold; future hikes will face affordability resistance.
Forward outlook
- Local home prices are declining (-3.0%/yr); year-one equity from $1k of loan paydown is wiped out by about $5k of value loss. Plan a longer hold.
- Cameron County population projected at +3% by 2050 — modest demand growth; plan on rents tracking national, not racing it.
- At projected returns (-3.0% appreciation + 8.0% rent growth), your $43k cash investment doubles in ~9 years — after that, you're playing with house money.
Negotiation context
- It's been on market 52 days — a 3% lower offer ($150k) is reasonable based on typical stale-listing flexibility.
- 2 sale attempts; this cycle's ask has dropped $13k (8%) from the opening price — seller is motivated, your offer sets the floor, not the list.
Risks & watch-outs
- Climate carrying-cost: moderate flood risk; severe wind risk, 99% chance of damaging wind over 30y; extreme-heat days projected 3→9/yr by 2055 (HVAC capex compounding) — expect insurance premiums to compound above CPI over the hold.
Questions for the listing agent
- It's been on market 52 days. Have you received any prior offers? Is the seller open to a 4% concession, seller financing, or rate buy-down credit?
- Is there a deadline driving the sale (1031 exchange, divorce, estate, relocation)? That informs how much negotiation room exists.
- Crime grade is D in this area — have there been break-ins, vandalism, or insurance claims at this property in the last 3 years? What carrier currently insures it and at what premium?
- What's the average days-on-market for RENTAL listings here right now (not sales)? A rising rental-DOM trend means longer vacancies and softer asking-rent achievability than the comps imply.
- What's the recent tenant-quality profile in this submarket — average credit score on applications, eviction rate, late-payment / NSF rate, and stable-employment percentage? A property-management company in the area should have these aggregated.
- How much new for-sale + rental construction is in the pipeline within 1–3 miles? Heavy new supply typically softens prices + rents 12–24 months out; constrained supply supports both.
Investment metrics
- 1% rule
- 0.96% ✗
- Cap rate
- 7.76%
- Cash-on-cash
- 5.25%
- DSCR
- 1.23
- GRM
- 8.7
CMA / ARV
- ARV (on-the-fly)
- $175,168
- Comps found
- 2
Show comp detail 2 sales within ~0.75 mi
| Address | Dist | Beds/Ba | Sqft | Sold | Price | $/sf | Match |
|---|---|---|---|---|---|---|---|
| 4419 Pine Ln | 0.52mi | 2/1.0 (-1) | 1,088 (0%) | 15mo | $169,000 | $155 | 55 |
| 463 Rey Salomon St | 0.75mi | 3/2.0 | 1,181 (+8%) | 5mo | $190,000 | $161 | 47 |
Match score weights: distance 35% · size 25% · config 20% · recency 20%. Top-matched comps best support the ARV.
Projected returns pro-forma
-3.0% appreciation · 8.0% rent growth · sell at horizon
- IRR
- -3.0%
- Equity multiple
- 0.88×
- Total profit
- $-5,207
- Equity at exit
- $23,111
- IRR
- 11.3%
- Equity multiple
- 2.07×
- Total profit
- $46,599
- Equity at exit
- $13,402
Cash invested: $43,400 (down + closing). Projections, not guarantees.
Landlord ↔ Tenant lean methodology
- Overall (STATE)
- 87 Strongly Landlord-Friendly
- State Texas
- 87 Strongly Landlord-Friendly · R+5
- County
- — inherits STATE
- City
- — inherits STATE
ZIP-level market 78521
- Home prices YoY
- -26.0%
- Rents YoY
- 8.2%
- Active inventory
- 365
- Price-to-rent
- 8.7×
Monthly cashflow live
- Estimated rent
- $1,483 high interval (Pro) →
- Mortgage (P&I)
- −$813
- Tax from tax record
- −$104 /mo · $1,254/yr
- Insurance
- −$65
- HOA
- −$0
- Vacancy / Maint / Mgmt
- −$312
- Net cashflow
- $190
Break-even live
UW: 25.0% down · 7.5% · 30yr · 1.5% tax · 5.0% vac · 8.0% maint · 8.0% mgmt
Financing live
Cash to close
- Down payment
- $38,750
- Closing costs
- $4,650
- Reserves months
- —
- Total cash needed
- —
Loan-product check · same deal, 3 products live
Conventional
25% down · 7.5% · 30yr
- Down + closing
- —
- Monthly P&I
- —
- Monthly cashflow
- —
- DSCR
- —
- Eligible?
- —
Personal DTI + credit; lowest rate.
DSCR
20% down · 8.5% · 30yr
- Down + closing
- —
- Monthly P&I
- —
- Monthly cashflow
- —
- DSCR
- —
- Eligible?
- —
No personal income docs; deal must DSCR.
Hard money
10% down · 12.0% · 12mo
- Down + closing
- —
- Monthly P&I
- —
- Monthly cashflow
- —
- DSCR
- —
- Eligible?
- —
Short-term bridge; refi at stabilization.
Rent comps 16 comps
| Address | Beds | Baths | Sqft | Rent | $/sqft | DOM | Units | Dist |
|---|---|---|---|---|---|---|---|---|
| 15 Corine Cir Brownsville, TX | 3.0 | 1.0 | 1337 | $1,200 | $0.90 | 13d | 1 | 0.40mi |
| 1134 Kelsey Dr Unit D Brownsville, TX | 3.0 | 1.0 | 870 | $875 | $1.01 | 43d | 1 | 0.47mi |
| 4650 Bowie Rd Brownsville, TX | 1.0–3.0 | 1.0–2.0 | 955 | $1,055 | $1.10 | 43d | 1 | 0.83mi |
| 1456 N Minnesota Ave Apt 8 Brownsville, TX | 2.0 | 2.0 | 1100 | $1,250 | $1.14 | 43d | 1 | 0.87mi |
| 328 Creekbend Dr Brownsville, TX | 3.0 | 2.0 | 1451 | $2,600 | $1.79 | 21d | 1 | 0.94mi |
| 170 Pearl Dr Brownsville, TX | 3.0 | 2.0 | 1291 | $1,600 | $1.24 | 21d | 1 | 1.00mi |
| 7100 Via Del Mar Cir Unit B-3 Brownsville, TX | 2.0 | 2.0 | 1150 | $1,500 | $1.30 | 21d | 1 | 1.17mi |
| 7100 Via Del Mar Cir Unit E-10 Brownsville, TX | 2.0 | 2.5 | 1247 | $1,500 | $1.20 | 21d | 1 | 1.17mi |
| 120 Galonsky St Unit G3 Brownsville, TX | 2.0 | 2.5 | 1224 | $1,325 | $1.08 | 21d | 1 | 1.18mi |
| 7701 Via Del Mar Cir Unit A-1 Brownsville, TX | 2.0 | 2.5 | 1096 | $1,300 | $1.19 | 43d | 1 | 1.23mi |
| 50 Galonsky St Unit 3 Brownsville, TX | 2.0 | 2.0 | 952 | $1,100 | $1.16 | 43d | 1 | 1.29mi |
| 2600 Elyssa Dr Brownsville, TX | 3.0 | 2.0 | 1216 | $1,850 | $1.52 | 13d | 1 | 1.34mi |
| 3744 Boca Chica Blvd Unit 100F Brownsville, TX | 2.0 | 2.0 | 980 | $1,500 | $1.53 | 21d | 1 | 1.35mi |
| 235 S Clubhouse Rd Unit NA Brownsville, TX | 4.0 | 2.0 | 1256 | $2,100 | $1.67 | 43d | 1 | 1.37mi |
| 538 Land O Lakes Dr Brownsville, TX | 3.0 | 2.0 | 1421 | $1,600 | $1.13 | 43d | 1 | 1.42mi |
| 2021 Westminster Cir Brownsville, TX | 2.0 | 2.0 | 1109 | $1,300 | $1.17 | 43d | 1 | 1.44mi |
Listing history 7 events
-
2026-05-01status Pending
-
2026-03-23price $155,000
-
2026-03-05$168,000 Active
-
2025-10-09soldstatus Closed 428-char remark
Show marketing remark (428 chars)
This 3-bedroom, 1-bath home sits on a spacious 60 x 105 lot and offers potential new beginnings for the right buyer. While it needs TLC, this property is priced to sell and presents a fantastic opportunity for investors or those looking to renovate. This property is being sold "AS IS" and CASH ONLY. ALL OFFERS MUST BE ACCOMPANIED BY PROOF OF FUNDS. EMAIL OFFERS TO: [email protected] or vteam. [email protected]
-
2025-10-09soldstatus
Show marketing remark (428 chars)
This 3-bedroom, 1-bath home sits on a spacious 60 x 105 lot and offers potential new beginnings for the right buyer. While it needs TLC, this property is priced to sell and presents a fantastic opportunity for investors or those looking to renovate. This property is being sold "AS IS" and CASH ONLY. ALL OFFERS MUST BE ACCOMPANIED BY PROOF OF FUNDS. EMAIL OFFERS TO: [email protected] or vteam. [email protected]
-
2025-10-03status Pending 428-char remark
Show marketing remark (428 chars)
This 3-bedroom, 1-bath home sits on a spacious 60 x 105 lot and offers potential new beginnings for the right buyer. While it needs TLC, this property is priced to sell and presents a fantastic opportunity for investors or those looking to renovate. This property is being sold "AS IS" and CASH ONLY. ALL OFFERS MUST BE ACCOMPANIED BY PROOF OF FUNDS. EMAIL OFFERS TO: [email protected] or vteam. [email protected]
-
2025-09-27$90,000 Active 428-char remark
Show marketing remark (428 chars)
This 3-bedroom, 1-bath home sits on a spacious 60 x 105 lot and offers potential new beginnings for the right buyer. While it needs TLC, this property is priced to sell and presents a fantastic opportunity for investors or those looking to renovate. This property is being sold "AS IS" and CASH ONLY. ALL OFFERS MUST BE ACCOMPANIED BY PROOF OF FUNDS. EMAIL OFFERS TO: [email protected] or vteam. [email protected]
ⓘ Source: listings_history table (triggers on properties + properties_extension) + one-shot
backfill from property_details.listing_events for pre-trigger history.
Tax reassessment forecast TX · Resets to sale price
- Current annual tax
- $1,254 · $104/mo
- Projected year-2 tax
- $2,836 · $236/mo
- Expected delta
- +$1,583/yr (+$132/mo · 126.3%)
ⓘ Screening estimate from a state-policy table — verify with the county assessor before closing.
Climate risk First Street
- Flood 5/10 Major FEMA zone X (unshaded) · 24% chance over 30 yrs
- Wildfire 3/10 Moderate
- Heat 8/10 Severe 3 d/yr ≥110°F today · 9 d/yr by 30 yrs out
- Wind 9/10 Extreme 99% chance of damaging wind over 30 yrs
- Air quality 2/10 Low 1 unhealthy d/yr today · 1 by 30 yrs out
Nearby sold comps map
Loading sold comps map…
Walkable amenities ~0.75 mi
Loading nearby amenities…
Taxation est. · year 1
- Rental income
- $17,801
- − Mortgage interest
- −$8,682
- − Property taxes
- −$1,254
- − Insurance
- −$775
- − Repairs & maintenance
- −$1,424
- − Management
- −$1,424
- − Depreciation
- −$4,509
- Taxable loss
- −$267
- Est. tax savings @ 24.0%
- +$64
- After-tax cash flow
- $2,344/yr
For passive investors: Depreciation is non-cash, so a rental often shows a tax loss while cash-flowing — sheltering income. Rental losses are passive: they offset passive income freely, and up to $25,000/yr can offset ordinary (W-2) income if you actively participate and your MAGI is under $100k (phasing out to $0 by $150k); unused losses carry forward. On sale, claimed depreciation is recaptured at up to 25%, and gains may owe capital-gains tax (a 1031 exchange can defer both). Figures are a year-1 estimate at your 24.0% rate — not tax advice; consult a CPA.
Schools (NCES district)
- District
- Brownsville ISD
- NCES district ID
- 4811680
- Math proficiency
- 20% ▼ -36.00%
- Reading proficiency
- 34% ▼ -13.00%
- Median HH income
- $30,490
- Composite
- 21.8/100
- National rank
- #8249
- State rank
- #710 of 826 in TX
Livability — Brownsville
- Score
- 79/100
- State rank
- #62
- US rank
- #2311
Category grades
Schools grade is shown separately in the Schools card above.
Census & demographics
- Census place
- Brownsville, TX
- County
- Cameron County · 310,734 people
- City population
- 212,132
- Metro
- Brownsville-Harlingen, TX
- Population (ZIP)
- 87,380
- Household income
- $44,509
- Rent vs Own
- Severe rent burden
- 2682.0
Population outlook (Cameron County) Hauer SSP2
- Today (2025)
- 441,603 people
- By 2030
- 448,113 · +1.5%
- By 2040
- 456,385 · +3.3%
- By 2050
- 456,294 · +3.3%
- By 2075
- 423,851 · -4.0%
- By 2100
- 342,787 · -22.4%
Race, ethnicity, and origin ACS 2023
- Neighborhood character
- Predominantly Hispanic (97%)
- Race & ethnicity
- Hispanic / Latino 97% Two or more races 45% White 3%
- Hispanic origin (detail)
- Mexican 91%
- Foreign-born
- 30% · Canada
- Languages at home
- 12% English-only · Spanish 88%
Political lean MEDSL · Cameron
- 2024 margin
- Lean R (+5.8) · D 46.7% · R 52.5%
- 2008→2024 swing
- -34.6pp toward R · 2008: 28.8pp · 2024: -5.8pp
- All cycles
- 2024: R+5.8 2020: D+13.2 2016: D+32.5 2012: D+32.4 2008: D+28.8
Not yet ingested
- Civics
- —
Market trends
- HPI YoY
- ▼ -81.45%
- Current HPI
- 232.1072
- Rent YoY
- ▲ 8.19%
- Metro
- Brownsville-Harlingen, TX
- State GDP YoY
- ▲ 3.95%
- F500 in state
- 110
Industry mix (Fortune 500 HQ in TX)
| Industry | F500 HQs | Revenue |
|---|---|---|
| Energy | 16 | $1,198B |
|
||
| Technology | 5 | $198B |
|
||
| Engineering / Construction | 4 | $72B |
|
||
| Energy Services | 3 | $60B |
|
||
| Utilities | 3 | $41B |
|
||
| Healthcare | 2 | $330B |
|
||
Price history
+72.2% since first listed7 events — show timeline
- 2026-05-01 Pending — RGVMLS
- 2026-03-23 Price Changed $155,000 RGVMLS
- 2026-03-05 Listed $168,000 RGVMLS
- 2025-10-09 Sold (Public Records) — Public Records
- 2025-10-09 Sold (MLS) — RGVMLS
- 2025-10-03 Pending — RGVMLS
- 2025-09-27 Listed $90,000 RGVMLS
Property tax history
+5.1%/yrLatest (2025): $1,254 · -47.7% YoY. Source: county tax records.
Cash-flow waterfall
monthlySold comps — $/sqft
last 12 mo · ≤1 miLoading sold comps…