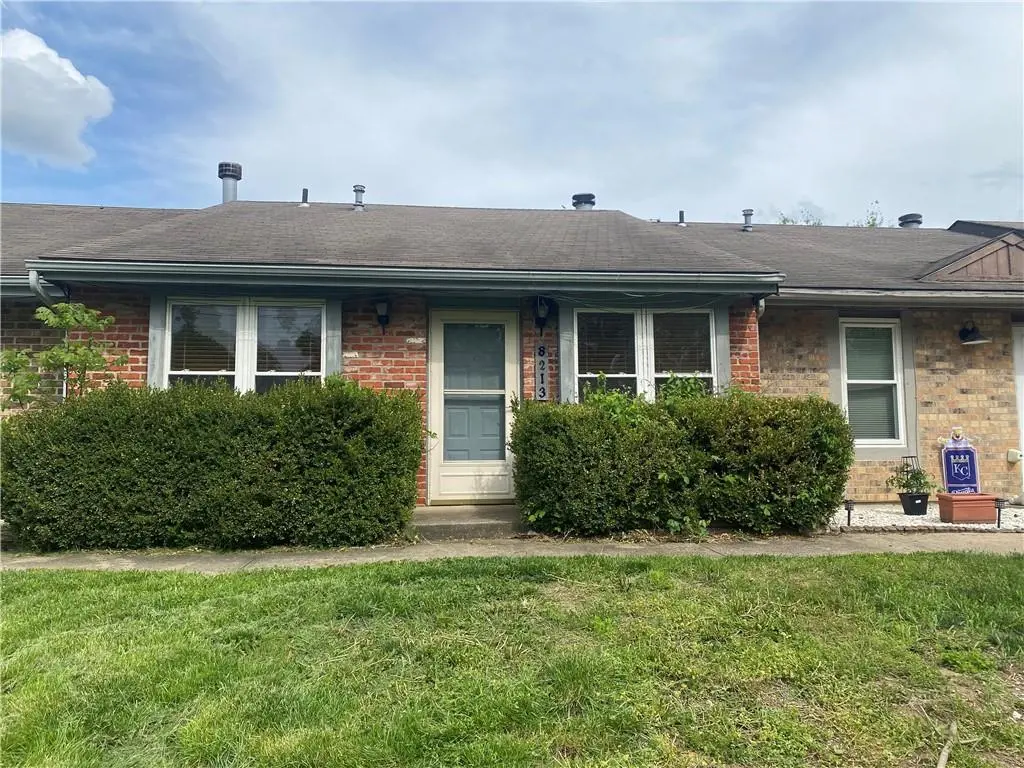
8213 NW Mace Rd · Kansas City, MO
Flood risk 1/10 · Minimal
- FEMA flood zone
- X (unshaded)
- Chance of flooding over 30 yrs
- 0.0%
- Est. flood insurance / yr
- $473 – $860
Fire risk 1/10 · Minimal
- Est. fire insurance / yr
- $1,054 – $1,958
Heat risk 4/10 · Minor
- Hot days now (above 107°F)
- 7 days/yr
- Hot days in 30 yrs
- 17 days/yr
Wind risk 2/10 · Minimal
- Chance of severe wind over 30 yrs
- —
Air-quality risk 2/10 · Minimal
- Unhealthy air days now
- 2 days/yr
- Unhealthy air days in 30 yrs
- 2 days/yr
Risk factors via First Street. Map © Google.
Why this score? — see what drove the C grade
The composite is a weighted blend of 9 inputs, each scored 0–100. Each bar is that input's sub-score; the figure is the points it added to the 100-point composite (weight × sub-score).
- Cash flow +14.9/30.0
- Appreciation +10.0/10.0
- ARV discount +6.7/15.0
- DSCR +4.6/10.0
- Schools +4.5/10.0
- Rent growth +4.3/5.0
- 1% rule +3.9/10.0
- Livability +3.9/5.0
- Condition / age +2.5/5.0
$165,000
🖨 Deal sheet 📄 Offer letter ✓ Due diligence
Listing remarks MLS
Long term tenant moved out of state. selling in AS-IS condition with all faults. inspection is welcome. seller will do no clean up or repair. * public record shows 1380 SQFT. Buyer & Buyer agent to verify the SQFT.
Key facts
- 2 garage spots
- Listed 57 days
Neighborhood map
What this means for you Summary
Snapshot
- This is a 2-bed/2.0-bath townhouse listed at $165k.
Deal economics
- At list price, monthly cash flow is $49 ($587/yr) — positive.
- The deal already cash-flows at list — no discount required.
- To meet the 1% rule (rent ≥ 1% of price), the offer needs to be $146k (11.2% below list).
- Recommended offer: $146k (11.2% below list) — sets the bar for 1% rule.
- Cap rate 6.6% vs local median 3.9% in Kansas City — top-decile yield for the area; either an underpriced asset or a hidden risk that comps aren't pricing in. Stress-test before assuming the spread holds.
Location & tenants
- Location reads 78/100 on livability (#28 in MO, #2,671 nationally) — a middle-class / working-renter tenant base. Strengths: amenities A+, commute A+, cost of living A+; Watch: schools C-, crime F.
- Park Hill (urban): math 47% / reading 54% proficiency, ranked #26 of 324 in MO (top 8%) — acceptable for families but not a draw, mixed tenant base, ~2y average lease.
- Market conditions: Rents rising fast (+7.0%/yr); 264 active listings in the ZIP; 16 comparable units currently listed for rent nearby; rentals at typical pace (median 21d on market — plan ~3-4 weeks tenant-placement turnaround); high-income renter base; 234 units permitted in Platte County in 2024 (0 in 5+ unit buildings).
- This rent is only 15% of the median local income ($115k/yr) — well below the 30% rent-burden line; pricing power to push rent on renewal without tenant pushback.
Forward outlook
- In year one you build about $18k of equity ($1k loan paydown + $16k appreciation (10.0% local appreciation)).
- Platte County population projected at +31% by 2050 — long-run rental-demand tailwind backs the buy-and-hold thesis.
- At projected returns (10.0% appreciation + 7.0% rent growth), your $46k cash investment doubles in ~3 years — after that, you're playing with house money.
- By year 3, paydown + projected appreciation supports a ~$45k cash-out refi (75% LTV) — recoverable capital for the next deal without selling this one.
Negotiation context
- It's been on market 57 days — a 3% lower offer ($160k) is reasonable based on typical stale-listing flexibility.
- 3 sale attempts since 12y ago with the ask held roughly flat each time — persistent listings suggest the price (not the market) is what's stuck; bring a comps-based counter.
Questions for the listing agent
- It's been on market 57 days. Have you received any prior offers? Is the seller open to a 11% concession, seller financing, or rate buy-down credit?
- Is there a deadline driving the sale (1031 exchange, divorce, estate, relocation)? That informs how much negotiation room exists.
- Crime grade is F in this area — have there been break-ins, vandalism, or insurance claims at this property in the last 3 years? What carrier currently insures it and at what premium?
- What's the average days-on-market for RENTAL listings here right now (not sales)? A rising rental-DOM trend means longer vacancies and softer asking-rent achievability than the comps imply.
- What's the recent tenant-quality profile in this submarket — average credit score on applications, eviction rate, late-payment / NSF rate, and stable-employment percentage? A property-management company in the area should have these aggregated.
- How much new for-sale + rental construction is in the pipeline within 1–3 miles? Heavy new supply typically softens prices + rents 12–24 months out; constrained supply supports both.
Investment metrics
- 1% rule
- 0.89% ✗
- Cap rate
- 6.65%
- Cash-on-cash
- 1.27%
- DSCR
- 1.06
- GRM
- 9.4
CMA / ARV
- ARV (median comp)
- $162,023
- List price
- $165,000
- Delta
- 1.84%
- Verdict
- FAIR
- Comps
- 5 within 1.0 mi
Show comp detail 2 sales within ~0.75 mi
| Address | Dist | Beds/Ba | Sqft | Sold | Price | $/sf | Match |
|---|---|---|---|---|---|---|---|
| 8727 NW 82nd St | 0.09mi | 2/2.5 | 1,414 (+2%) | 13mo | $175,000 | $124 | 78 |
| 7917 NW 79th Pl | 0.68mi | 3/2.0 (+1) | 1,384 (+0%) | 20mo | $220,000 | $159 | 46 |
Match score weights: distance 35% · size 25% · config 20% · recency 20%. Top-matched comps best support the ARV.
Projected returns pro-forma
10.0% appreciation · 7.03% rent growth · sell at horizon
- IRR
- 26.6%
- Equity multiple
- 3.15×
- Total profit
- $99,162
- Equity at exit
- $148,645
- IRR
- 24.4%
- Equity multiple
- 7.59×
- Total profit
- $304,310
- Equity at exit
- $320,559
Cash invested: $46,200 (down + closing). Projections, not guarantees.
Landlord ↔ Tenant lean methodology
- Overall (STATE)
- 81 Strongly Landlord-Friendly
- State Missouri
- 81 Strongly Landlord-Friendly · R+10
- County
- — inherits STATE
- City
- — inherits STATE
ZIP-level market 64152
- Home prices YoY
- 4.7%
- Rents YoY
- 7.0%
- Active inventory
- 264
- Price-to-rent
- 9.4×
Monthly cashflow live
- Estimated rent
- $1,465 high interval (Pro) →
- Mortgage (P&I)
- −$865
- Tax from tax record
- −$174 /mo · $2,090/yr
- Insurance
- −$69
- HOA
- −$0
- Vacancy / Maint / Mgmt
- −$308
- Net cashflow
- $49
Break-even live
UW: 25.0% down · 7.5% · 30yr · 1.5% tax · 5.0% vac · 8.0% maint · 8.0% mgmt
Financing live
Cash to close
- Down payment
- $41,250
- Closing costs
- $4,950
- Reserves months
- —
- Total cash needed
- —
Loan-product check · same deal, 3 products live
Conventional
25% down · 7.5% · 30yr
- Down + closing
- —
- Monthly P&I
- —
- Monthly cashflow
- —
- DSCR
- —
- Eligible?
- —
Personal DTI + credit; lowest rate.
DSCR
20% down · 8.5% · 30yr
- Down + closing
- —
- Monthly P&I
- —
- Monthly cashflow
- —
- DSCR
- —
- Eligible?
- —
No personal income docs; deal must DSCR.
Hard money
10% down · 12.0% · 12mo
- Down + closing
- —
- Monthly P&I
- —
- Monthly cashflow
- —
- DSCR
- —
- Eligible?
- —
Short-term bridge; refi at stabilization.
Rent comps 16 comps
| Address | Beds | Baths | Sqft | Rent | $/sqft | DOM | Units | Dist |
|---|---|---|---|---|---|---|---|---|
| 8710 NW 82 Ter Apt B Kansas City, MO | 2.0 | 1.5 | 900 | $1,125 | $1.25 | 44d | 1 | 0.07mi |
| 8710 NW 82 Ter Unit d Kansas City, MO | 2.0 | 1.0 | 900 | $1,225 | $1.36 | 23d | 1 | 0.07mi |
| 8704 NW 82 Ter Unit B Kansas City, MO | 1.0 | 1.0 | 1056 | $999 | $0.95 | 43d | 1 | 0.10mi |
| 8320 N Nodaway Ave Kansas City, MO | 3.0 | 2.5 | 1600 | $1,995 | $1.25 | 43d | 1 | 0.26mi |
| 7223 NW 84th Ter Kansas City, MO | 3.0 | 1.5 | 1038 | $1,830 | $1.76 | 23d | 1 | 0.96mi |
| 7223 NW 84th Ter Kansas City, MO | 3.0 | 1.5 | 1038 | $1,830 | $1.76 | 17d | 1 | 0.96mi |
| 8135 N Stoddard Ave Kansas City, MO | 2.0 | 1.0 | 949 | $1,225 | $1.29 | 23d | 1 | 0.98mi |
| 8787 NW Prairie View Rd Kansas City, MO | 2.0 | 1.0–2.0 | 1046 | $2,331 | $2.23 | 1d | 8 | 1.07mi |
| 8199 NW Milrey Dr Kansas City, MO | 3.0 | 2.5 | 1458 | $2,070 | $1.42 | 17d | 8 | 1.08mi |
| 8940 N Shannon Ave Kansas City, MO | 1.0–2.0 | 1.0–2.0 | 937 | $2,049 | $2.19 | 1d | 23 | 1.12mi |
| 7641 N Stoddard Ave Kansas City, MO | 3.0 | 2.0 | 1766 | $2,200 | $1.25 | 43d | 1 | 1.13mi |
| 8031 NW Milrey Dr Kansas City, MO | 1.0–2.0 | 1.0–1.5 | 870 | $1,435 | $1.65 | 1d | 5 | 1.14mi |
| 8811 N Congress Ave Kansas City, MO | 1.0–3.0 | 1.0–2.0 | 1029 | $1,562 | $1.52 | 1d | 16 | 1.19mi |
| 6904 NW 78th St Kansas City, MO | 3.0 | 1.0 | 1450 | $1,799 | $1.24 | 21d | 1 | 1.27mi |
| 8495 State Rte N Kansas City, MO | 2.0–4.0 | 2.0–3.5 | 11173 | $2,010 | $0.18 | 1d | 72 | 1.40mi |
| 7441 NW Old Tiffany Springs Rd Kansas City, MO | 1.0–2.0 | 1.0–2.0 | 958 | $1,695 | $1.77 | 3d | 2 | 1.50mi |
Listing history 13 events
-
2026-06-09days on market $165,000 Active 57 DOM
-
2026-06-08days on market $165,000 Active 56 DOM
-
2026-06-07days on market $165,000 Active 55 DOM
-
2026-06-03days on market $165,000 Active 51 DOM
-
2026-06-02days on market $165,000 Active 50 DOM
-
2026-06-01days on market $165,000 Active 49 DOM
-
2026-05-31days on market $165,000 Active 48 DOM
-
2026-04-13$165,000 Active 220-char remark
Show marketing remark (220 chars)
Long term tenant moved out of state. selling in AS-IS condition with all faults. inspection is welcome. seller will do no clean up or repair. * public record shows 1380 SQFT. Buyer & Buyer agent to verify the SQFT.
-
2016-12-22soldstatus Sold 196-char remark
Show marketing remark (196 chars)
Great investment opportunity - Currently leased and well maintained. Property Sold "AS-IS" "WHERE IS" WITH ANY AND ALL FAULTS. Inspection are welcome for buyers knowledge only.
-
2016-10-05status Pending 196-char remark
Show marketing remark (196 chars)
Great investment opportunity - Currently leased and well maintained. Property Sold "AS-IS" "WHERE IS" WITH ANY AND ALL FAULTS. Inspection are welcome for buyers knowledge only.
-
2016-09-08$69,500 Active 196-char remark
Show marketing remark (196 chars)
Great investment opportunity - Currently leased and well maintained. Property Sold "AS-IS" "WHERE IS" WITH ANY AND ALL FAULTS. Inspection are welcome for buyers knowledge only.
-
2015-08-04soldstatus
-
2014-11-11$75,000
ⓘ Source: listings_history table (triggers on properties + properties_extension) + one-shot
backfill from property_details.listing_events for pre-trigger history.
Tax reassessment forecast MO · Resets to sale price
- Current annual tax
- $2,090 · $174/mo
- Projected year-2 tax
- $2,090 · $174/mo
- Expected delta
- $0/yr ($0/mo · 0.0%)
ⓘ Screening estimate from a state-policy table — verify with the county assessor before closing.
Climate risk First Street
- Flood 1/10 Low FEMA zone X (unshaded) · 0% chance over 30 yrs
- Wildfire 1/10 Low
- Heat 4/10 Moderate 7 d/yr ≥107°F today · 17 d/yr by 30 yrs out
- Wind 2/10 Low
- Air quality 2/10 Low 2 unhealthy d/yr today · 2 by 30 yrs out
Nearby sold comps map
Loading sold comps map…
Walkable amenities ~0.75 mi
Loading nearby amenities…
Taxation est. · year 1
- Rental income
- $17,577
- − Mortgage interest
- −$9,243
- − Property taxes
- −$2,090
- − Insurance
- −$825
- − Repairs & maintenance
- −$1,406
- − Management
- −$1,406
- − Depreciation
- −$4,800
- Taxable loss
- −$2,193
- Est. tax savings @ 24.0%
- +$526
- After-tax cash flow
- $1,114/yr
For passive investors: Depreciation is non-cash, so a rental often shows a tax loss while cash-flowing — sheltering income. Rental losses are passive: they offset passive income freely, and up to $25,000/yr can offset ordinary (W-2) income if you actively participate and your MAGI is under $100k (phasing out to $0 by $150k); unused losses carry forward. On sale, claimed depreciation is recaptured at up to 25%, and gains may owe capital-gains tax (a 1031 exchange can defer both). Figures are a year-1 estimate at your 24.0% rate — not tax advice; consult a CPA.
Schools (NCES district)
- District
- Park Hill
- NCES district ID
- 2923550
- Math proficiency
- 47% ▼ -3.00%
- Reading proficiency
- 54% ▼ -3.00%
- Median HH income
- $67,616
- Composite
- 44.86/100
- National rank
- #2723
- State rank
- #26 of 324 in MO
Livability — Kansas City
- Score
- 78/100
- State rank
- #28
- US rank
- #2671
Category grades
Schools grade is shown separately in the Schools card above.
Census & demographics
- Census place
- Kansas City, MO
- County
- Platte County · 100,198 people
- City population
- 439,467
- Metro
- Kansas City, MO-KS
- Population (ZIP)
- 31,545
- Household income
- $114,688
- Rent vs Own
- Severe rent burden
- 234.0
Population outlook (Platte County) Hauer SSP2
- Today (2025)
- 111,772 people
- By 2030
- 119,173 · +6.6%
- By 2040
- 133,326 · +19.3%
- By 2050
- 146,617 · +31.2%
- By 2075
- 178,626 · +59.8%
- By 2100
- 195,638 · +75.0%
Race, ethnicity, and origin ACS 2023
- Neighborhood character
- Predominantly White (82%)
- Race & ethnicity
- White 82% Hispanic / Latino 7% Two or more races 6% Black 3% Asian 2%
- Hispanic origin (detail)
- Mexican 5% Puerto Rican 1%
- Common ancestry
- Romanian 4% Italian 4% Slovak 4%
- Foreign-born
- 4% · Canada, China
- Languages at home
- 93% English-only · Spanish 3% Other Indo-European 1% German/W. Germanic 1%
Political lean MEDSL · Platte
- 2024 margin
- Toss-up / Even · D 47.7% · R 50.8% · Other 1.4%
- 2008→2024 swing
- +3.2pp toward D · 2008: -6.4pp · 2024: -3.1pp
- All cycles
- 2024: R+3.1 2020: R+3.0 2016: R+13.0 2012: R+14.2 2008: R+6.4
Not yet ingested
- Civics
- —
Market trends
- HPI YoY
- ▲ 33.10%
- Current HPI
- 739.89
- Rent YoY
- ▲ 7.03%
- Metro
- Kansas City, MO-KS
- State GDP YoY
- ▲ 1.84%
- F500 in state
- 20
Industry mix (Fortune 500 HQ in MO)
| Industry | F500 HQs | Revenue |
|---|---|---|
| Healthcare | 1 | $163B |
|
||
| Insurance | 1 | $21B |
|
||
| Industrial Technology | 1 | $17B |
|
||
| Retail | 1 | $16B |
|
||
| Industrial Distribution | 1 | $10B |
|
||
| Utilities | 1 | $9B |
|
||
Price history
+120.0% since first listed6 events — show timeline
- 2026-04-13 Listed $165,000 Heartland MLS as Distributed by MLS Grid
- 2016-12-22 Sold (MLS) — Heartland MLS as Distributed by MLS Grid
- 2016-10-05 Pending — Heartland MLS as Distributed by MLS Grid
- 2016-09-08 Listed $69,500 Heartland MLS as Distributed by MLS Grid
- 2015-08-04 Sold (Public Records) — Public Records
- 2014-11-11 Listed $75,000 Heartland MLS as Distributed by MLS Grid
Property tax history
+4.4%/yrLatest (2025): $2,090 · +11.6% YoY. Source: county tax records.
Cash-flow waterfall
monthlySold comps — $/sqft
last 12 mo · ≤1 miLoading sold comps…