71 Emerald Woods Dr Unit F2 · Pine Ridge, FL
Flood risk 3/10 · Minor
- FEMA flood zone
- X (unshaded)
- Chance of flooding over 30 yrs
- 0.12%
- Est. flood insurance / yr
- $507 – $1,088
Fire risk 1/10 · Minimal
- Est. fire insurance / yr
- $947 – $1,759
Heat risk 10/10 · Severe
- Hot days now (above 107°F)
- 7 days/yr
- Hot days in 30 yrs
- 32 days/yr
Wind risk 10/10 · Severe
- Chance of severe wind over 30 yrs
- 99.0%
Air-quality risk 2/10 · Minimal
- Unhealthy air days now
- 2 days/yr
- Unhealthy air days in 30 yrs
- 2 days/yr
Risk factors via First Street. Map © Google.
Why this score? — see what drove the B grade
The composite is a weighted blend of 9 inputs, each scored 0–100. Each bar is that input's sub-score; the figure is the points it added to the 100-point composite (weight × sub-score).
- Cash flow +30.0/30.0
- 1% rule +10.0/10.0
- DSCR +10.0/10.0
- ARV discount +7.5/15.0
- Schools +5.0/10.0
- Rent growth +4.7/5.0
- Livability +3.4/5.0
- Condition / age +2.5/5.0
- Appreciation +0.0/10.0
$270,000
🖨 Deal sheet (PDF) 📄 Offer letter ✓ Due diligence
Listing remarks
WHAT are you waiting for? We've done the homework. This is the closest home to the beach in the price range. PETS ok !!Sure, I need some TLC, I have 2 bedrooms & a loft/den 2 full baths AND a half bath for entertaining, a 2023 roof & my building, doors & railings are being painted NOW & we have proposals for the TLC & it will only take a month to do so, if you like ask. Only 2 miles to the beach, 10 minutes by bike, and 7 minutes by car. You MUST check out the lifestyle video. Steps away from popular Mercato for dining, dancing & shopping. ! Sky-high ceilings and a private patio await your future private hot tub (see floor plan) & your perfect sunse
Key facts
- Private patio
- 2 miles to the beach
- Sunset balcony
Tags
Property features AI
Finance
- Other: Part of a complex with 150 units and 12 units in the building; One unit per floor and 2 floors in the building; Possession at closing
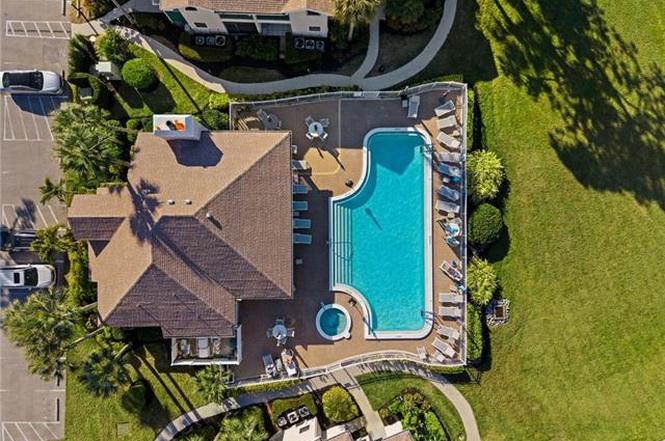
- HOA & community: Mandatory HOA with professional management; Quarterly HOA fee; HOA covers cable, insurance, lawn/land maintenance, manager, recreation facilities, repairs, trash removal; Community amenities include clubhouse, community pool, community spa/hot tub, sidewalks, and streetlights; Total annual recurring HOA fees: $8,768; Total one-time fees: $150
Exterior
- Parking: No designated parking
- Utilities: Central water; Central sewer; Cable available
- Home design: Residential property; Low-rise building (1-3 stories); Contemporary style; Rear exposure facing East; Located in Pine Ridge community; Building number 71, Emerald Woods sub-condo
- Construction: Built in 1988; Concrete block construction; Stucco exterior finish; Shingle roof; Sliding windows; Cul-de-sac lot; Lot unit 2; Restrictions: Deeded, No Commercial, No RV
- Exterior features: Deck; Patio; Privacy wall; Private road; Landscaped area view; Central irrigation
Interior
- Kitchen: Pantry; Cooktop; Range; Self-cleaning oven; Microwave; Dishwasher; Disposal; Refrigerator
- Bedrooms: 2 bedrooms plus den (split bedroom floor plan); Split bedrooms layout
- Flooring: Tile flooring
- Bathrooms: 2 full bathrooms; 1 half bathroom; Master bathroom with combo tub and shower
- Heating & cooling: Central electric heat; Central electric air conditioning; Ceiling fans
- Interior features: Foyer; Smoke detectors; Volume ceilings; Walk-in closet; Window coverings; 6 total rooms; 4 ceiling fans; Unfurnished
- Laundry & utility: Washer; Dryer
Neighborhood map
What this means for you Summary
Snapshot
- This is a 2-bed/2.5-bath condo listed at $270k.
Deal economics
- At list price, monthly cash flow is $2k ($20k/yr) — positive.
- The deal already cash-flows at list — no discount required.
- Meets the 1% rule at list price ($5k rent vs $270k).
- Recommended offer: $254k (6.0% below list) — sets the bar for market timing.
- Cap rate 13.5% vs local median 3.4% in Pine Ridge — top-decile yield for the area; either an underpriced asset or a hidden risk that comps aren't pricing in. Stress-test before assuming the spread holds.
Location & tenants
- Location reads 67/100 on livability (#565 in FL) — a middle-class / working-renter tenant base. Strengths: crime A+, housing A+, cost of living A-; Watch: health & safety C-, amenities F, commute F.
- Collier (suburban): math 60% / reading 56% proficiency, ranked #16 of 73 in FL (top 22%) — acceptable for families but not a draw, mixed tenant base, ~2y average lease.
- Zoned schools: Sea Gate Elementary School (math 86% / reading 81%, grade A+, #60 of 2,144 statewide, top 3%, 703 students, 26% FRL); Barron Collier High School (math 62% / reading 68%, grade B, #76 of 667 statewide, top 11%, 1,650 students, 26% FRL) — zoned schools average 26% FRL vs 55% district-wide (29 pts lower); this property's tenant base skews higher-income than the district average.
- Zoned-school proficiency averages 74% at this address vs 58% district-wide (+16 pts) — the actual schools serving this property are materially stronger than the Collier average implies; a family-tenant draw the district grade alone would hide.
- Market conditions: Rents rising fast (+8.7%/yr); 682 active listings in the ZIP; 40 comparable units currently listed for rent nearby; rentals at typical pace (median 25d on market — plan ~3-4 weeks tenant-placement turnaround); high-income renter base; 3,520 units permitted in Collier County in 2024 (959 in 5+ unit buildings).
Forward outlook
- Local home prices are declining (-3.0%/yr); year-one equity from $2k of loan paydown is wiped out by about $8k of value loss. Plan a longer hold.
- Collier County population projected at +30% by 2050 — long-run rental-demand tailwind backs the buy-and-hold thesis.
- At projected returns (-3.0% appreciation + 8.0% rent growth), your $76k cash investment doubles in ~4 years — after that, you're playing with house money.
Negotiation context
- It's been on market 83 days — a 6% lower offer ($254k) is reasonable based on typical stale-listing flexibility.
- 2 sale attempts since 17y ago; this cycle's ask has dropped $15k (5%) from the opening price — seller is motivated, your offer sets the floor, not the list.
- Current owner paid $114k; list at $270k implies a 136% gain — meaningful room to come down on a strong offer.
Risks & watch-outs
- Climate carrying-cost: severe wind risk, 99% chance of damaging wind over 30y; extreme-heat days projected 7→32/yr by 2055 (HVAC capex compounding) — expect insurance premiums to compound above CPI over the hold.
Questions for the listing agent
- It's been on market 83 days. Have you received any prior offers? Is the seller open to a 6% concession, seller financing, or rate buy-down credit?
- What does the HOA fee cover, when was the last increase, and are there any pending special assessments or reserve-fund shortfalls?
- Any open or pending special assessments — roof, HVAC, plumbing, elevator, façade? What's the per-unit balance and payoff schedule, and is the seller paying it off at close or rolling it to the buyer?
- Why hasn't it sold? Are there any deal-killer items the seller is aware of (foundation, flood, title, zoning, code violations)?
- Is there a deadline driving the sale (1031 exchange, divorce, estate, relocation)? That informs how much negotiation room exists.
- Schools are F-rated, which usually means shorter tenancies and higher turnover. Who's the typical renter profile here, and what's been the actual vacancy rate?
- What's the average days-on-market for RENTAL listings here right now (not sales)? A rising rental-DOM trend means longer vacancies and softer asking-rent achievability than the comps imply.
- What's the recent tenant-quality profile in this submarket — average credit score on applications, eviction rate, late-payment / NSF rate, and stable-employment percentage? A property-management company in the area should have these aggregated.
- How much new apartment / multifamily construction is in the pipeline within 1–3 miles? Heavy new supply (>2% of stock underway) typically softens rents 12–24 months out; light construction supports rent growth.
Investment metrics
- 1% rule
- 1.95% ✓
- Cap rate
- 13.54%
- Cash-on-cash
- 25.87%
- DSCR
- 2.15
- GRM
- 4.3
CMA / ARV
No comps found within radius.
Projected returns pro-forma
-3.0% appreciation · 8.0% rent growth · sell at horizon
- IRR
- 26.2%
- Equity multiple
- 2.17×
- Total profit
- $88,359
- Equity at exit
- $40,258
- IRR
- 37.2%
- Equity multiple
- 5.49×
- Total profit
- $339,200
- Equity at exit
- $23,345
Cash invested: $75,600 (down + closing). Projections, not guarantees.
Landlord ↔ Tenant lean methodology
- Overall (STATE)
- 87 Strongly Landlord-Friendly
- State Florida
- 87 Strongly Landlord-Friendly · R+3
- County
- — inherits STATE
- City
- — inherits STATE
ZIP-level market 34108
- Rents YoY
- 8.7%
- Active inventory
- 682
- Price-to-rent
- 4.3×
Monthly cashflow live
- Estimated rent
- $5,264 medium interval (Pro) →
- Mortgage (P&I)
- −$1,416
- Tax from tax record
- −$269 /mo · $3,232/yr
- Insurance
- −$112
- HOA
- −$731
- Vacancy / Maint / Mgmt
- −$1,105
- Net cashflow
- $1,630
Break-even live
Sensitivity live
| Price | -10% $1,783 | -5% $1,706 | +0% $1,630 | +5% $1,553 | +10% $1,477 |
|---|---|---|---|---|---|
| Rent | -10% $1,214 | -5% $1,422 | +0% $1,630 | +5% $1,838 | +10% $2,046 |
| Rate | -1.0pp $1,766 | -0.5pp $1,698 | base $1,630 | +0.5pp $1,560 | +1.0pp $1,489 |
UW: 25.0% down · 7.5% · 30yr · 1.5% tax · 5.0% vac · 8.0% maint · 8.0% mgmt
Financing live
Cash to close
- Down payment
- $67,500
- Closing costs
- $8,100
- Reserves months
- —
- Total cash needed
- —
Loan-product check · same deal, 3 products live
Conventional
25% down · 7.5% · 30yr
- Down + closing
- —
- Monthly P&I
- —
- Monthly cashflow
- —
- DSCR
- —
- Eligible?
- —
Personal DTI + credit; lowest rate.
DSCR
20% down · 8.5% · 30yr
- Down + closing
- —
- Monthly P&I
- —
- Monthly cashflow
- —
- DSCR
- —
- Eligible?
- —
No personal income docs; deal must DSCR.
Hard money
10% down · 12.0% · 12mo
- Down + closing
- —
- Monthly P&I
- —
- Monthly cashflow
- —
- DSCR
- —
- Eligible?
- —
Short-term bridge; refi at stabilization.
Rent comps 40 comps
| Address | Beds | Baths | Sqft | Rent | $/sqft | DOM | Units | Dist |
|---|---|---|---|---|---|---|---|---|
| 65 Emerald Woods Dr Unit E8 Naples, FL | 2.0 | 2.5 | 1360 | $2,400 | $1.76 | 25d | 1 | 0.04mi |
| 61 Emerald Woods Dr Unit D2 Naples, FL | 2.0 | 2.5 | 1360 | $3,200 | $2.35 | 25d | 1 | 0.06mi |
| 800 Meadowland Dr Unit H Naples, FL | 2.0 | 2.5 | 1432 | $2,700 | $1.89 | 15d | 1 | 0.11mi |
| 800 Meadowland Dr Unit N Naples, FL | 2.0 | 2.5 | 1432 | $5,500 | $3.84 | 22d | 1 | 0.11mi |
| 790 Meadowland Dr Unit 29-2 Naples, FL | 2.0 | 2.5 | 1432 | $6,000 | $4.19 | 15d | 1 | 0.12mi |
| 81 Emerald Woods Dr Unit M8 Naples, FL | 2.0 | 2.0 | 1133 | $4,200 | $3.71 | 25d | 1 | 0.15mi |
| 81 Emerald Woods Dr Unit M8 Naples, FL | 2.0 | 2.0 | 1133 | $4,200 | $3.71 | 14d | 1 | 0.15mi |
| 322 Sugar Pine Ln #322 Naples, FL | 2.0 | 2.0 | 1311 | $2,350 | $1.79 | 25d | 1 | 0.18mi |
| 820 Meadowland Dr Unit D Naples, FL | 2.0 | 2.5 | 1432 | $5,500 | $3.84 | 15d | 1 | 0.19mi |
| 823 Meadowland Dr Unit 41-2 Naples, FL | 3.0 | 2.5 | 1784 | $9,000 | $5.04 | 15d | 1 | 0.19mi |
| 823 Meadowland Dr Unit H Naples, FL | 3.0 | 2.5 | 1744 | $6,500 | $3.73 | 15d | 1 | 0.19mi |
| 833 Meadowland Dr Unit 14-3 Naples, FL | 2.0 | 2.5 | 1360 | $5,500 | $4.04 | 15d | 1 | 0.23mi |
| 840 Meadowland Dr Unit H Naples, FL | 3.0 | 2.5 | 1748 | $6,900 | $3.95 | 15d | 1 | 0.25mi |
| 840 Meadowland Dr Unit H Naples, FL | 3.0 | 2.5 | 1748 | $6,900 | $3.95 | 25d | 1 | 0.28mi |
| 878 Meadowland Dr Unit G Naples, FL | 2.0 | 2.0 | 1282 | $2,500 | $1.95 | 15d | 1 | 0.32mi |
| 878 Meadowland Dr Unit B Naples, FL | 3.0 | 2.5 | 1784 | $3,200 | $1.79 | 15d | 1 | 0.32mi |
| 878 Meadowland Dr Unit 4 Naples, FL | 2.0 | 2.0 | 1459 | $6,500 | $4.46 | 15d | 1 | 0.32mi |
| 7050 Barrington Cir #202 Naples, FL | 2.0 | 2.0 | 1663 | $9,900 | $5.95 | 25d | 1 | 0.33mi |
| 7104 Barrington Cir #102 Naples, FL | 3.0 | 2.0 | 1527 | $2,320 | $1.52 | 15d | 1 | 0.34mi |
| 7046 Barrington Cir #202 Naples, FL | 2.0 | 2.0 | 1663 | $8,500 | $5.11 | 25d | 1 | 0.35mi |
| 7104 Barrington Cir Unit 3-102 Naples, FL | 3.0 | 2.0 | 1527 | $8,000 | $5.24 | 25d | 1 | 0.35mi |
| 7108 Barrington Cir #101 Naples, FL | 2.0 | 2.0 | 1527 | $8,500 | $5.57 | 15d | 1 | 0.35mi |
| 7087 Barrington Cir #201 Naples, FL | 3.0 | 2.0 | 1663 | $6,500 | $3.91 | 25d | 1 | 0.36mi |
| 7095 Barrington Cir Unit 6-102 Naples, FL | 3.0 | 2.0 | 1521 | $11,500 | $7.56 | 25d | 1 | 0.36mi |
| 800 L Ambiance Cir #106 Naples, FL | 3.0 | 2.0 | 1620 | $8,500 | $5.25 | 15d | 1 | 0.40mi |
| 200 L Ambiance Cir #101 Naples, FL | 2.0 | 2.0 | 1395 | $8,500 | $6.09 | 15d | 1 | 0.41mi |
| 100 Lambiance Cir Unit 1-101 Naples, FL | 2.0 | 2.0 | 1389 | $8,800 | $6.34 | 25d | 1 | 0.45mi |
| 400 L Ambiance Cir #204 Naples, FL | 2.0 | 2.0 | 1693 | $10,000 | $5.91 | 15d | 1 | 0.46mi |
| 400 L Ambiance Cir #104 Naples, FL | 2.0 | 2.0 | 1349 | $6,500 | $4.82 | 15d | 1 | 0.46mi |
| 500 Lambiance Cir Unit 5-104 Naples, FL | 2.0 | 2.0 | 1349 | $8,000 | $5.93 | 25d | 1 | 0.50mi |
| 9115 Strada Pl Naples, FL | 1.0–2.0 | 1.5–2.0 | 1489 | $13,000 | $8.73 | 25d | 4 | 0.59mi |
| 9123 Strada Pl Naples, FL | 1.0–2.0 | 1.0–2.0 | 1267 | $14,000 | $11.05 | 15d | 6 | 0.61mi |
| 516 Gordonia Rd Naples, FL | 2.0 | 1.0 | 1100 | $3,200 | $2.91 | 25d | 1 | 0.62mi |
| 8415 Excalibur Cir Naples, FL | 2.0–3.0 | 2.0 | 1522 | $9,750 | $6.40 | 25d | 1 | 0.68mi |
| 1033 Egrets Walk Cir Unit 6-101 Naples, FL | 3.0 | 2.0 | 1584 | $2,200 | $1.39 | 25d | 1 | 0.70mi |
| 8405 Excalibur Cir Unit D3 Naples, FL | 2.0 | 2.0 | 1382 | $9,000 | $6.51 | 25d | 1 | 0.70mi |
| 881 Gulf Pavilion Dr #201 Naples, FL | 2.0 | 2.0 | 1516 | $7,500 | $4.95 | 25d | 1 | 0.70mi |
| 8385 Excalibur Cir Unit G3 Naples, FL | 2.0 | 2.0 | 1382 | $10,000 | $7.24 | 25d | 1 | 0.70mi |
| 6934 Rain Lily Ct #103 Naples, FL | 2.0 | 2.0 | 1282 | $5,200 | $4.06 | 25d | 1 | 0.72mi |
| 6934 Rain Lily Ct #102 Naples, FL | 2.0 | 2.0 | 1282 | $4,500 | $3.51 | 25d | 1 | 0.72mi |
HOA detail condo
- Monthly dues
- $731 · $8,772/yr
- Assessments
- None detected in remarks — confirm with the listing agent.
Listing history 7 events
-
2026-06-07status $270,000 Pending 83 DOM
-
2026-05-05status Pending With Contingencies
-
2026-04-16price $270,000
-
2026-02-11$285,000 Active
-
2009-03-18$219,000
-
2001-05-16soldstatus $114,500
-
1988-03-01soldstatus $79,600
ⓘ Source: listings_history table (triggers on properties + properties_extension) + one-shot
backfill from property_details.listing_events for pre-trigger history.
Tax reassessment forecast FL · Resets to sale price
- Current annual tax
- $3,232 · $269/mo
- Projected year-2 tax
- $3,232 · $269/mo
- Expected delta
- $0/yr ($0/mo · 0.0%)
ⓘ Screening estimate from a state-policy table — verify with the county assessor before closing.
Climate risk First Street
- Flood 3/10 Moderate FEMA zone X (unshaded) · 12% chance over 30 yrs
- Wildfire 1/10 Low
- Heat 10/10 Extreme 7 d/yr ≥107°F today · 32 d/yr by 30 yrs out
- Wind 10/10 Extreme 99% chance of damaging wind over 30 yrs
- Air quality 2/10 Low 2 unhealthy d/yr today · 2 by 30 yrs out
Nearby sold comps map
Loading sold comps map…
Walkable amenities ~0.75 mi
Loading nearby amenities…
Taxation est. · year 1
- Rental income
- $63,168
- − Mortgage interest
- −$15,124
- − Property taxes
- −$3,232
- − Insurance
- −$1,350
- − Repairs & maintenance
- −$5,053
- − Management
- −$5,053
- − HOA
- −$8,772
- − Depreciation
- −$7,855
- Taxable income
- $16,729
- Est. tax owed @ 24.0%
- −$4,015
- After-tax cash flow
- $15,543/yr
For passive investors: Depreciation is non-cash, so a rental often shows a tax loss while cash-flowing — sheltering income. Rental losses are passive: they offset passive income freely, and up to $25,000/yr can offset ordinary (W-2) income if you actively participate and your MAGI is under $100k (phasing out to $0 by $150k); unused losses carry forward. On sale, claimed depreciation is recaptured at up to 25%, and gains may owe capital-gains tax (a 1031 exchange can defer both). Figures are a year-1 estimate at your 24.0% rate — not tax advice; consult a CPA.
Schools (NCES district)
- District
- Collier
- NCES district ID
- 1200330
- Math proficiency
- 60% ▼ -4.00%
- Reading proficiency
- 56% ▼ -2.00%
- Median HH income
- $58,275
- Composite
- 50.23/100
- National rank
- #1892
- State rank
- #16 of 73 in FL
Livability — Pine Ridge
- Score
- 67/100
- State rank
- #565
- US rank
- #10798
Category grades
Schools grade is shown separately in the Schools card above.
Census & demographics
- Census place
- Pine Ridge, FL
- County
- Collier County · 396,295 people
- City population
- 18,514
- Metro
- Naples-Marco Island, FL
- Population (ZIP)
- 16,237
- Household income
- $119,212
- Rent vs Own
- Severe rent burden
- 237.0
Population outlook (Collier County) Hauer SSP2
- Today (2025)
- 420,858 people
- By 2030
- 450,054 · +6.9%
- By 2040
- 502,232 · +19.3%
- By 2050
- 544,932 · +29.5%
- By 2075
- 627,203 · +49.0%
- By 2100
- 659,015 · +56.6%
Race, ethnicity, and origin ACS 2023
- Neighborhood character
- Predominantly White (87%)
- Race & ethnicity
- White 87% Hispanic / Latino 8% Two or more races 7% Asian 1% Black 1%
- Hispanic origin (detail)
- Mexican 2% Cuban 3%
- Common ancestry
- Romanian 5% Lithuanian 3% Slovak 3%
- Foreign-born
- 16% · Canada, Dominican Republic, South Korea
- Languages at home
- 86% English-only · Spanish 6% Russian/Polish/Slavic 2% Other Indo-European 2%
Political lean MEDSL · Collier
- 2024 margin
- Solid R (+33.1) · D 33.1% · R 66.2%
- 2008→2024 swing
- -10.6pp toward R · 2008: -22.5pp · 2024: -33.1pp
- All cycles
- 2024: R+33.1 2020: R+24.7 2016: R+26.0 2012: R+30.1 2008: R+22.5
Not yet ingested
- Civics
- —
Market trends
- HPI YoY
- ▼ -587.97%
- Current HPI
- 275.1872
- Rent YoY
- ▲ 8.74%
- Metro
- Naples-Marco Island, FL
- State GDP YoY
- ▲ 3.28%
- F500 in state
- 36
Industry mix (Fortune 500 HQ in FL)
| Industry | F500 HQs | Revenue |
|---|---|---|
| Industrial Technology | 2 | $29B |
|
||
| Insurance | 2 | $17B |
|
||
| Retail | 1 | $60B |
|
||
| Technology Distribution | 1 | $58B |
|
||
| Homebuilding | 1 | $35B |
|
||
| Technology Manufacturing | 1 | $35B |
|
||
Price history
+239.2% since first listed6 events — show timeline
- 2026-05-05 Pending — NAPLESMLS
- 2026-04-16 Price Changed $270,000 NAPLESMLS
- 2026-02-11 Listed $285,000 NAPLESMLS
- 2009-03-18 Listed $219,000 NAPLESMLS
- 2001-05-16 Sold (Public Records) $114,500 Public Records
- 1988-03-01 Sold (Public Records) $79,600 Public Records
Property tax history
+13.3%/yrLatest (2025): $3,232 · +252.1% YoY. Source: county tax records.
Cash-flow waterfall
monthlySold comps — $/sqft
last 12 mo · ≤1 miLoading sold comps…