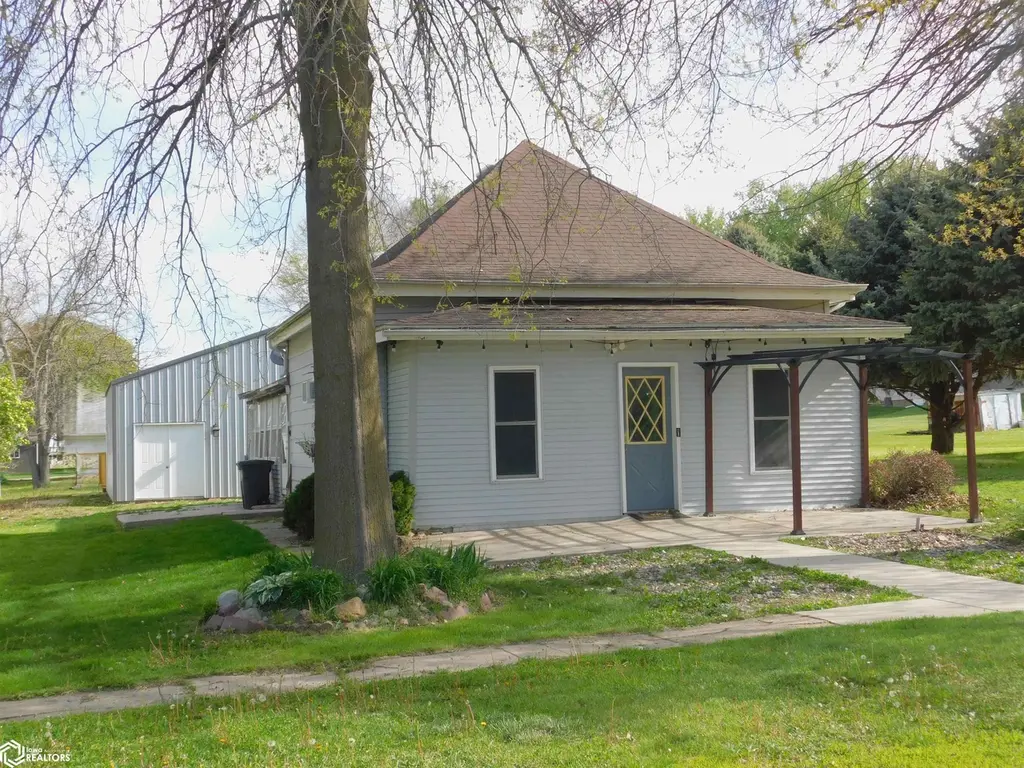
363 6th Ave · Manilla, IA
Flood risk No data
- FEMA flood zone
- —
- Chance of flooding over 30 yrs
- —
- Est. flood insurance / yr
- —
Fire risk No data
- Est. fire insurance / yr
- —
Heat risk No data
- Hot days now (above threshold)
- —
- Hot days in 30 yrs
- —
Wind risk No data
- Chance of severe wind over 30 yrs
- —
Air-quality risk No data
- Unhealthy air days now
- —
- Unhealthy air days in 30 yrs
- —
Risk factors via First Street. Map © Google.
Why this score? — see what drove the B+ grade
The composite is a weighted blend of 9 inputs, each scored 0–100. Each bar is that input's sub-score; the figure is the points it added to the 100-point composite (weight × sub-score).
- Cash flow +27.4/30.0
- ARV discount +11.5/15.0
- DSCR +9.6/10.0
- Appreciation +8.4/10.0
- 1% rule +7.2/10.0
- Schools +6.5/10.0
- Livability +3.2/5.0
- Rent growth +2.5/5.0
- Condition / age +2.5/5.0
$74,900
🖨 Deal sheet 📄 Offer letter ✓ Due diligence
Listing remarks
Located in Manilla — this unique property offers both a 3-bedroom home and an incredible 32' x 32' building full of possibilities! The home features a very large living room, eat-in kitchen, main-floor laundry, and a bath with shower. With a few updates, this property could become a wonderful place to call home. The impressive detached building (2017) includes a concrete floor, multiple overhead/access doors, and endless potential for storage, workshop space, hobbies, business use, or future finishing opportunities. So much potential in one property — call today to schedule your personal tour!
Key facts
- Large living room
- Detached building
- Eat-in kitchen
Tags
Property features AI
Finance
- Financial info: Annual taxes listed (amount available)
Exterior
- Parking: Detached 2-car garage
- Utilities: Public water; Public sewer; Electric with circuit breakers
- Home design: Single-family residential property
- Construction: Vinyl siding construction; Shingle roof
- Exterior features: Shingle roof; Vinyl siding; Lot approx. 0.33 acres (100 x 142)
Interior
- Bathrooms: 1 full bathroom
- Heating & cooling: Baseboard heating; Window air conditioning units
- Interior features: Basement present
Neighborhood map
What this means for you Summary
Snapshot
- This is a 3-bed/1.0-bath single-family listed at $75k.
Deal economics
- At list price, monthly cash flow is $218 ($3k/yr) — positive.
- The deal already cash-flows at list — no discount required.
- Meets the 1% rule at list price ($917 rent vs $75k).
- Recommended offer: $74k (1.5% below list) — sets the bar for market timing.
Location & tenants
- Location reads 63/100 on livability (#680 in IA) — a middle-class / working-renter tenant base. Strengths: cost of living A+, housing A+; Watch: schools F, amenities F, commute F.
- Ikm-Manning Community School District (rural): math 75% / reading 78% proficiency, ranked #58 of 289 in IA (top 20%) — strong family-tenant draw, lease renewals of 3-5y typical.
- Market conditions: 7 active listings in the ZIP; 18 units permitted in Crawford County in 2024 (0 in 5+ unit buildings).
Forward outlook
- In year one you build about $6k of equity ($518 loan paydown + $5k appreciation (6.7% local appreciation)).
- Crawford County population projected at +10% by 2050 — modest demand growth; plan on rents tracking national, not racing it.
- At projected returns (6.7% appreciation + 3.0% rent growth), your $21k cash investment doubles in ~3 years — after that, you're playing with house money.
- By year 6, paydown + projected appreciation supports a ~$31k cash-out refi (75% LTV) — recoverable capital for the next deal without selling this one.
Negotiation context
- It's been on market 18 days — a 2% lower offer ($74k) is reasonable based on typical stale-listing flexibility.
- Current owner paid $30k; list at $75k implies a 150% gain — meaningful room to come down on a strong offer.
Risks & watch-outs
- Watch-outs: built in 1910 — expect roof / HVAC / electrical / plumbing capex.
Questions for the listing agent
- Built in 1910 — when were the roof, HVAC, electrical panel, plumbing, and water heater last replaced?
- Is there a deadline driving the sale (1031 exchange, divorce, estate, relocation)? That informs how much negotiation room exists.
- Schools are F-rated, which usually means shorter tenancies and higher turnover. Who's the typical renter profile here, and what's been the actual vacancy rate?
- What's the average days-on-market for RENTAL listings here right now (not sales)? A rising rental-DOM trend means longer vacancies and softer asking-rent achievability than the comps imply.
- What's the recent tenant-quality profile in this submarket — average credit score on applications, eviction rate, late-payment / NSF rate, and stable-employment percentage? A property-management company in the area should have these aggregated.
- How much new for-sale + rental construction is in the pipeline within 1–3 miles? Heavy new supply typically softens prices + rents 12–24 months out; constrained supply supports both.
Investment metrics
- 1% rule
- 1.22% ✓
- Cap rate
- 9.79%
- Cash-on-cash
- 12.48%
- DSCR
- 1.56
- GRM
- 6.8
CMA / ARV
- ARV (median comp)
- $82,111
- List price
- $74,900
- Delta
- -8.78%
- Verdict
- FAIR
- Comps
- 20 within 1.0 mi
Show comp detail 5 sales within ~0.75 mi
| Address | Dist | Beds/Ba | Sqft | Sold | Price | $/sf | Match |
|---|---|---|---|---|---|---|---|
| 272 6th Ave | 0.04mi | 2/1.0 (-1) | 1,231 (+3%) | 6mo | $32,500 | $26 | 84 |
| 462 6th Ave | 0.07mi | 3/1.0 | 1,128 (-6%) | 18mo | $81,000 | $72 | 72 |
| 436 3rd Ave | 0.20mi | 3/1.0 | 1,317 (+10%) | 9mo | $87,000 | $66 | 66 |
| 533 2nd Ave | 0.34mi | 2/1.5 (-1) | 1,198 (-0%) | 13mo | $119,900 | $100 | 66 |
| 632 2nd Ave | 0.35mi | 4/1.0 (+1) | 1,294 (+8%) | 14mo | $125,000 | $97 | 54 |
Match score weights: distance 35% · size 25% · config 20% · recency 20%. Top-matched comps best support the ARV.
Projected returns pro-forma
6.73% appreciation · 3.0% rent growth · sell at horizon
- IRR
- 27.2%
- Equity multiple
- 2.85×
- Total profit
- $38,817
- Equity at exit
- $50,590
- IRR
- 25.0%
- Equity multiple
- 5.89×
- Total profit
- $102,593
- Equity at exit
- $94,931
Cash invested: $20,972 (down + closing). Projections, not guarantees.
Landlord ↔ Tenant lean methodology
- Overall (STATE)
- 83 Strongly Landlord-Friendly
- State Iowa
- 83 Strongly Landlord-Friendly · R+6
- County
- — inherits STATE
- City
- — inherits STATE
ZIP-level market 51454
- Home prices YoY
- 3.5%
- Active inventory
- 7
- Price-to-rent
- 6.8×
Monthly cashflow live
- Estimated rent
- $917 medium interval (Pro) →
- Mortgage (P&I)
- −$393
- Tax from tax record
- −$82 /mo · $984/yr
- Insurance
- −$31
- HOA
- −$0
- Vacancy / Maint / Mgmt
- −$192
- Net cashflow
- $218
Break-even live
UW: 25.0% down · 7.5% · 30yr · 1.5% tax · 5.0% vac · 8.0% maint · 8.0% mgmt
Financing live
Cash to close
- Down payment
- $18,725
- Closing costs
- $2,247
- Reserves months
- —
- Total cash needed
- —
Loan-product check · same deal, 3 products live
Conventional
25% down · 7.5% · 30yr
- Down + closing
- —
- Monthly P&I
- —
- Monthly cashflow
- —
- DSCR
- —
- Eligible?
- —
Personal DTI + credit; lowest rate.
DSCR
20% down · 8.5% · 30yr
- Down + closing
- —
- Monthly P&I
- —
- Monthly cashflow
- —
- DSCR
- —
- Eligible?
- —
No personal income docs; deal must DSCR.
Hard money
10% down · 12.0% · 12mo
- Down + closing
- —
- Monthly P&I
- —
- Monthly cashflow
- —
- DSCR
- —
- Eligible?
- —
Short-term bridge; refi at stabilization.
Listing history 3 events
-
2026-05-11$74,900 Active 613-char remark
-
2021-06-11soldstatus $30,000
-
2007-08-10soldstatus $27,450
ⓘ Source: listings_history table (triggers on properties + properties_extension) + one-shot
backfill from property_details.listing_events for pre-trigger history.
Tax reassessment forecast IA · Partial reset (capped growth)
- Current annual tax
- $984 · $82/mo
- Projected year-2 tax
- $1,080 · $90/mo
- Expected delta
- +$96/yr (+$8/mo · 9.8%)
ⓘ Screening estimate from a state-policy table — verify with the county assessor before closing.
Nearby sold comps map
Loading sold comps map…
Walkable amenities ~0.75 mi
Loading nearby amenities…
Taxation est. · year 1
- Rental income
- $10,999
- − Mortgage interest
- −$4,196
- − Property taxes
- −$984
- − Insurance
- −$374
- − Repairs & maintenance
- −$880
- − Management
- −$880
- − Depreciation
- −$2,179
- Taxable income
- $1,506
- Est. tax owed @ 24.0%
- −$361
- After-tax cash flow
- $2,256/yr
For passive investors: Depreciation is non-cash, so a rental often shows a tax loss while cash-flowing — sheltering income. Rental losses are passive: they offset passive income freely, and up to $25,000/yr can offset ordinary (W-2) income if you actively participate and your MAGI is under $100k (phasing out to $0 by $150k); unused losses carry forward. On sale, claimed depreciation is recaptured at up to 25%, and gains may owe capital-gains tax (a 1031 exchange can defer both). Figures are a year-1 estimate at your 24.0% rate — not tax advice; consult a CPA.
Schools (NCES district)
- District
- Ikm-Manning Community School District
- NCES district ID
- 1914880
- Math proficiency
- 75% ▼ -1.00%
- Reading proficiency
- 78% ▬ 0.00%
- Median HH income
- $49,285
- Composite
- 64.68/100
- National rank
- #524
- State rank
- #58 of 289 in IA
Livability — Manilla
- Score
- 63/100
- State rank
- #680
- US rank
- #15748
Category grades
Schools grade is shown separately in the Schools card above.
Census & demographics
- Census place
- Manilla, IA
- Population (ZIP)
- 1,399
Population outlook (Crawford County) Hauer SSP2
- Today (2025)
- 17,186 people
- By 2030
- 17,322 · +0.8%
- By 2040
- 17,948 · +4.4%
- By 2050
- 18,955 · +10.3%
- By 2075
- 22,130 · +28.8%
- By 2100
- 25,483 · +48.3%
Race, ethnicity, and origin ACS 2023
- Neighborhood character
- Predominantly White (96%)
- Race & ethnicity
- White 96% Hispanic / Latino 3% Two or more races 2%
- Common ancestry
- Iranian 5% Portuguese 5% Italian 2%
- Foreign-born
- 1% · Canada
- Languages at home
- 99% English-only · Spanish 1%
Political lean MEDSL · Crawford
- 2024 margin
- Solid R (+43.5) · D 27.8% · R 71.3%
- 2008→2024 swing
- -48.6pp toward R · 2008: 5.1pp · 2024: -43.5pp
- All cycles
- 2024: R+43.5 2020: R+36.8 2016: R+38.2 2012: R+8.2 2008: D+5.1
Not yet ingested
- Civics
- —
Market trends
- HPI YoY
- ▲ 6.73%
- Current HPI
- 199.6247
- Rent YoY
- —
- Metro
- —
- State GDP YoY
- ▲ 2.48%
- F500 in state
- 4
Industry mix (Fortune 500 HQ in IA)
| Industry | F500 HQs | Revenue |
|---|---|---|
| Financial Services | 1 | $16B |
|
||
| Retail / Convenience | 1 | $15B |
|
||
Price history
+172.9% since first listed4 events — show timeline
- 2026-05-29 Pending — IAR
- 2026-05-11 Listed $74,900 IAR
- 2021-06-11 Sold (Public Records) $30,000 Public Records
- 2007-08-10 Sold (Public Records) $27,450 Public Records
Property tax history
+23.2%/yrLatest (2025): $984 · +19.7% YoY. Source: county tax records.
Cash-flow waterfall
monthlySold comps — $/sqft
last 12 mo · ≤1 miLoading sold comps…