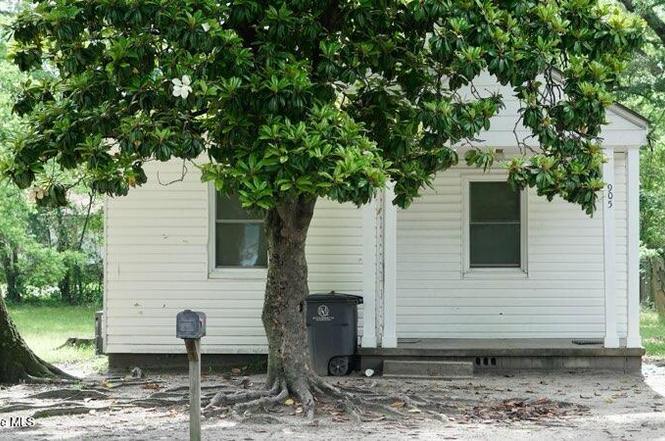
905 Pender St · Rocky Mount, NC
Flood risk 1/10 · Minimal
- FEMA flood zone
- X (unshaded)
- Chance of flooding over 30 yrs
- 0.0%
- Est. flood insurance / yr
- $507 – $1,088
Fire risk 2/10 · Minimal
- Est. fire insurance / yr
- $906 – $1,684
Heat risk 7/10 · Major
- Hot days now (above 107°F)
- 7 days/yr
- Hot days in 30 yrs
- 16 days/yr
Wind risk 6/10 · Moderate
- Chance of severe wind over 30 yrs
- 73.0%
Air-quality risk 2/10 · Minimal
- Unhealthy air days now
- 1 days/yr
- Unhealthy air days in 30 yrs
- 2 days/yr
Risk factors via First Street. Map © Google.
Why this score? — see what drove the B grade
The composite is a weighted blend of 9 inputs, each scored 0–100. Each bar is that input's sub-score; the figure is the points it added to the 100-point composite (weight × sub-score).
- Cash flow +30.0/30.0
- ARV discount +15.0/15.0
- DSCR +10.0/10.0
- 1% rule +8.4/10.0
- Livability +3.5/5.0
- Rent growth +2.5/5.0
- Condition / age +2.5/5.0
- Schools +2.0/10.0
- Appreciation +0.0/10.0
$89,500
🖨 Deal sheet (PDF) 📄 Offer letter ✓ Due diligence
Listing remarks MLS
Great starter home or investment property! This cute house has 2 bedrooms and 1 bathroom, fresh paint, and new flooring throughout. There is a tenant in place paying $800/month.
Key facts
- 7,700 sq ft lot
- Built 1947
- Listed 5 days
Property features AI
Exterior
- Parking: On-site gravel parking
- Utilities: Connected to public water; Connected to public sewer
- Home design: Single-family residence; One-story home; Entry level is 1
- Construction: Vinyl siding and frame construction
- Exterior features: Front porch; Shingle roof; No fencing; City street and state road frontage
Interior
- Bedrooms: 5 total rooms (includes living spaces and bedrooms)
- Bathrooms: 1 full bathroom
- Heating & cooling: Central air conditioning; Electric forced-air heating
- Interior features: Crawl space basement; no finished basement; Has a view
Neighborhood map
What this means for you Summary
Snapshot
- This is a 2-bed/1.0-bath single-family listed at $90k.
Deal economics
- At list price, monthly cash flow is $401 ($5k/yr) — positive.
- The deal already cash-flows at list — no discount required.
- Meets the 1% rule at list price ($1k rent vs $90k).
- Cap rate 11.7% vs local median 4.5% in Rocky Mount — top-decile yield for the area; either an underpriced asset or a hidden risk that comps aren't pricing in. Stress-test before assuming the spread holds.
Location & tenants
- Location reads 70/100 on livability (#134 in NC) — a middle-class / working-renter tenant base. Strengths: cost of living A+, housing A+, health & safety A+; Watch: crime F, amenities F, employment F.
- Edgecombe County Public Schools (rural): math 21% / reading 27% proficiency, ranked #163 of 178 in NC (top 92%) — low school quality limits family demand, transient renter base, plan for 1-2y turnover; 74% free/reduced lunch — lower-income household profile, screen leases tightly.
- Zoned schools: D S Johnson Elementary (math 3% / reading 13%, grade F, #1,396 of 1,410 statewide, top 99%, 362 students, 95% FRL); Rocky Mount Middle (math 7% / reading 26%, grade F, #449 of 475 statewide, top 96%, 407 students, 97% FRL); North Edgecombe High (math 15% / reading 24%, grade F, #492 of 535 statewide, top 93%, 229 students, 99% FRL) — zoned schools average 97% FRL vs 74% district-wide (23 pts higher); higher-poverty schools than district average — tighter screening recommended.
- Market conditions: 134 active listings in the ZIP; lower-income renter base — watch delinquency; 50 units permitted in Edgecombe County in 2024 (5 in 5+ unit buildings).
- This rent runs 32% of the median local income ($45k/yr) — at the standard rent-burdened threshold; future hikes will face affordability resistance.
Forward outlook
- Local home prices are declining (-3.0%/yr); year-one equity from $619 of loan paydown is wiped out by about $3k of value loss. Plan a longer hold.
- Edgecombe County population projected at -34% by 2050 — secular population decline; favor cash flow + early exit over multi-decade hold.
- At projected returns (-3.0% appreciation + 3.0% rent growth), your $25k cash investment doubles in ~7 years — after that, you're playing with house money.
Negotiation context
- Only 5 days on market — expect competitive offers; lowballing is unlikely to land.
- 7 sale attempts since 4y ago; this cycle's ask is 8895% above the opening price — seller raised mid-cycle; expect resistance to lowballs.
- Current owner paid $55k; list at $90k implies a 63% gain — meaningful room to come down on a strong offer.
Risks & watch-outs
- Watch-outs: built in 1947 — expect roof / HVAC / electrical / plumbing capex.
- Climate carrying-cost: major wind risk, 73% chance of damaging wind over 30y; extreme-heat days projected 7→16/yr by 2055 (HVAC capex compounding) — expect insurance premiums to compound above CPI over the hold.
Questions for the listing agent
- Built in 1947 — when were the roof, HVAC, electrical panel, plumbing, and water heater last replaced?
- Is there a deadline driving the sale (1031 exchange, divorce, estate, relocation)? That informs how much negotiation room exists.
- Schools are F-rated, which usually means shorter tenancies and higher turnover. Who's the typical renter profile here, and what's been the actual vacancy rate?
- Crime grade is F in this area — have there been break-ins, vandalism, or insurance claims at this property in the last 3 years? What carrier currently insures it and at what premium?
- What's the average days-on-market for RENTAL listings here right now (not sales)? A rising rental-DOM trend means longer vacancies and softer asking-rent achievability than the comps imply.
- What's the recent tenant-quality profile in this submarket — average credit score on applications, eviction rate, late-payment / NSF rate, and stable-employment percentage? A property-management company in the area should have these aggregated.
- How much new for-sale + rental construction is in the pipeline within 1–3 miles? Heavy new supply typically softens prices + rents 12–24 months out; constrained supply supports both.
Investment metrics
- 1% rule
- 1.34% ✓
- Cap rate
- 11.67%
- Cash-on-cash
- 19.21%
- DSCR
- 1.85
- GRM
- 6.2
CMA / ARV
- ARV (on-the-fly)
- $109,500
- Comps found
- 10
Show comp detail 10 sales within ~0.75 mi
| Address | Dist | Beds/Ba | Sqft | Sold | Price | $/sf | Match |
|---|---|---|---|---|---|---|---|
| 1000 S Washington St | 0.22mi | 3/1.5 (+1) | 850 (-3%) | 2mo | $140,000 | $165 | 76 |
| 906 Clark St | 0.04mi | 2/1.0 | 916 (+5%) | 19mo | $18,000 | $20 | 75 |
| 611 Arlington St | 0.31mi | 2/2.0 | 840 (-4%) | 1mo | $134,900 | $161 | 74 |
| 417 Dexter St | 0.64mi | 2/1.0 | 896 (+2%) | 4mo | $133,900 | $149 | 63 |
| 1406 Hargrove St | 0.43mi | 1/1.0 (-1) | 758 (-14%) | 1mo | $95,000 | $125 | 51 |
| 1028 Hill St | 0.63mi | 2/1.0 | 835 (-5%) | 15mo | $110,000 | $132 | 50 |
| 1410 Branch St | 0.40mi | 2/1.0 | 990 (+13%) | 13mo | $28,000 | $28 | 49 |
| 1101 Long Ave | 0.59mi | 2/1.0 | 778 (-11%) | 14mo | $50,000 | $64 | 42 |
| 1104 Long Ave | 0.62mi | 3/1.0 (+1) | 983 (+12%) | 13mo | $55,000 | $56 | 35 |
| 905 Tyan St | 0.66mi | 2/1.0 | 953 (+9%) | 23mo | $20,000 | $21 | 35 |
Match score weights: distance 35% · size 25% · config 20% · recency 20%. Top-matched comps best support the ARV.
Projected returns pro-forma
-3.0% appreciation · 3.0% rent growth · sell at horizon
- IRR
- 11.1%
- Equity multiple
- 1.44×
- Total profit
- $11,017
- Equity at exit
- $13,345
- IRR
- 20.1%
- Equity multiple
- 2.69×
- Total profit
- $42,382
- Equity at exit
- $7,738
Cash invested: $25,060 (down + closing). Projections, not guarantees.
Landlord ↔ Tenant lean methodology
- Overall (STATE)
- 85 Strongly Landlord-Friendly
- State North Carolina
- 85 Strongly Landlord-Friendly · R+3
- County
- — inherits STATE
- City
- — inherits STATE
ZIP-level market 27801
- Home prices YoY
- -5.6%
- Active inventory
- 134
- Price-to-rent
- 6.2×
Monthly cashflow live
- Estimated rent
- $1,200 medium interval (Pro) →
- Mortgage (P&I)
- −$469
- Tax from tax record
- −$41 /mo · $488/yr
- Insurance
- −$37
- HOA
- −$0
- Vacancy / Maint / Mgmt
- −$252
- Net cashflow
- $401
Break-even live
Sensitivity live
| Price | -10% $452 | -5% $426 | +0% $401 | +5% $376 | +10% $350 |
|---|---|---|---|---|---|
| Rent | -10% $306 | -5% $354 | +0% $401 | +5% $449 | +10% $496 |
| Rate | -1.0pp $446 | -0.5pp $424 | base $401 | +0.5pp $378 | +1.0pp $354 |
UW: 25.0% down · 7.5% · 30yr · 1.5% tax · 5.0% vac · 8.0% maint · 8.0% mgmt
Financing live
Cash to close
- Down payment
- $22,375
- Closing costs
- $2,685
- Reserves months
- —
- Total cash needed
- —
Loan-product check · same deal, 3 products live
Conventional
25% down · 7.5% · 30yr
- Down + closing
- —
- Monthly P&I
- —
- Monthly cashflow
- —
- DSCR
- —
- Eligible?
- —
Personal DTI + credit; lowest rate.
DSCR
20% down · 8.5% · 30yr
- Down + closing
- —
- Monthly P&I
- —
- Monthly cashflow
- —
- DSCR
- —
- Eligible?
- —
No personal income docs; deal must DSCR.
Hard money
10% down · 12.0% · 12mo
- Down + closing
- —
- Monthly P&I
- —
- Monthly cashflow
- —
- DSCR
- —
- Eligible?
- —
Short-term bridge; refi at stabilization.
Listing history 25 events
-
2026-06-21days on market $89,500 Active 5 DOM
-
2026-06-19days on market $89,500 Active 3 DOM
-
2026-06-18days on market $89,500 Active 2 DOM
-
2026-06-17remarks 387-char remark
-
2026-06-17pricedays on market $89,500 Active 1 DOM
-
2026-05-30days on market $96,500 Active 372 DOM
-
2026-05-15status Active
-
2026-04-25historical $995
-
2026-04-18historical Active Under Contract
-
2026-04-16$995
-
2026-03-26status Active
-
2026-03-26historical
-
2026-03-04price $96,500
-
2026-02-21status Active
-
2026-02-20historical
-
2025-12-08status Active
-
2025-11-30historical
-
2025-08-11price $99,500
-
2025-06-16price $107,500
-
2025-05-15$110,000 Active
-
2023-01-12soldstatus $55,000 Closed 177-char remark
Show marketing remark (177 chars)
Great starter home or investment property! This cute house has 2 bedrooms and 1 bathroom, fresh paint, and new flooring throughout. There is a tenant in place paying $800/month.
-
2023-01-06soldstatus $55,000
-
2022-11-26status Pending 177-char remark
Show marketing remark (177 chars)
Great starter home or investment property! This cute house has 2 bedrooms and 1 bathroom, fresh paint, and new flooring throughout. There is a tenant in place paying $800/month.
-
2022-10-17$59,905 Active 177-char remark
Show marketing remark (177 chars)
Great starter home or investment property! This cute house has 2 bedrooms and 1 bathroom, fresh paint, and new flooring throughout. There is a tenant in place paying $800/month.
-
1999-05-28soldstatus $45,000
ⓘ Source: listings_history table (triggers on properties + properties_extension) + one-shot
backfill from property_details.listing_events for pre-trigger history.
Tax reassessment forecast NC · Resets to sale price
- Current annual tax
- $488 · $41/mo
- Projected year-2 tax
- $734 · $61/mo
- Expected delta
- +$246/yr (+$20/mo · 50.4%)
ⓘ Screening estimate from a state-policy table — verify with the county assessor before closing.
Climate risk First Street
- Flood 1/10 Low FEMA zone X (unshaded) · 0% chance over 30 yrs
- Wildfire 2/10 Low
- Heat 7/10 Severe 7 d/yr ≥107°F today · 16 d/yr by 30 yrs out
- Wind 6/10 Major 73% chance of damaging wind over 30 yrs
- Air quality 2/10 Low 1 unhealthy d/yr today · 2 by 30 yrs out
Nearby sold comps map
Loading sold comps map…
Walkable amenities ~0.75 mi
Loading nearby amenities…
Taxation est. · year 1
- Rental income
- $14,406
- − Mortgage interest
- −$5,013
- − Property taxes
- −$488
- − Insurance
- −$448
- − Repairs & maintenance
- −$1,152
- − Management
- −$1,152
- − Depreciation
- −$2,604
- Taxable income
- $3,548
- Est. tax owed @ 24.0%
- −$852
- After-tax cash flow
- $3,961/yr
For passive investors: Depreciation is non-cash, so a rental often shows a tax loss while cash-flowing — sheltering income. Rental losses are passive: they offset passive income freely, and up to $25,000/yr can offset ordinary (W-2) income if you actively participate and your MAGI is under $100k (phasing out to $0 by $150k); unused losses carry forward. On sale, claimed depreciation is recaptured at up to 25%, and gains may owe capital-gains tax (a 1031 exchange can defer both). Figures are a year-1 estimate at your 24.0% rate — not tax advice; consult a CPA.
Schools (NCES district)
- District
- Edgecombe County Public Schools
- NCES district ID
- 3701320
- Math proficiency
- 21% ▼ -2.00%
- Reading proficiency
- 27% ▲ 2.00%
- Median HH income
- $35,711
- Composite
- 19.85/100
- National rank
- #8696
- State rank
- #163 of 178 in NC
Livability — Rocky Mount
- Score
- 70/100
- State rank
- #134
- US rank
- #7692
Category grades
Schools grade is shown separately in the Schools card above.
Census & demographics
- Census place
- Rocky Mount, NC
- County
- Edgecombe County · 37,913 people
- City population
- 70,300
- Metro
- Rocky Mount, NC
- Population (ZIP)
- 19,532
- Household income
- $44,884
- Rent vs Own
- Severe rent burden
- 900.0
Population outlook (Edgecombe County) Hauer SSP2
- Today (2025)
- 47,800 people
- By 2030
- 44,396 · -7.1%
- By 2040
- 37,562 · -21.4%
- By 2050
- 31,495 · -34.1%
- By 2075
- 20,943 · -56.2%
- By 2100
- 13,674 · -71.4%
Race, ethnicity, and origin ACS 2023
- Neighborhood character
- Predominantly Black (70%)
- Race & ethnicity
- Black 70% White 24% Two or more races 3% Hispanic / Latino 1%
- Common ancestry
- Romanian 1%
- Foreign-born
- 1% · Canada
- Languages at home
- 97% English-only · Spanish 2%
Political lean MEDSL · Edgecombe
- 2024 margin
- Strong D (+22.7) · D 61.0% · R 38.3%
- 2008→2024 swing
- -11.8pp toward R · 2008: 34.5pp · 2024: 22.7pp
- All cycles
- 2024: D+22.7 2020: D+27.0 2016: D+32.2 2012: D+36.4 2008: D+34.5
Not yet ingested
- Civics
- —
Market trends
- HPI YoY
- ▼ -17.65%
- Current HPI
- 296.3428
- Rent YoY
- —
- Metro
- Rocky Mount, NC
- State GDP YoY
- ▲ 3.28%
- F500 in state
- 26
Industry mix (Fortune 500 HQ in NC)
| Industry | F500 HQs | Revenue |
|---|---|---|
| Financial Services | 2 | $213B |
|
||
| Retail | 2 | $95B |
|
||
| Industrial Conglomerate | 1 | $38B |
|
||
| Metals / Steel | 1 | $35B |
|
||
| Utilities | 1 | $30B |
|
||
| Industrial Machinery | 1 | $19B |
|
||
Price history
+114.4% since first listed19 events — show timeline
- 2026-05-15 Relisted — Hive MLS
- 2026-04-25 Rental Removed $995 RentEngineListings
- 2026-04-18 Contingent — Hive MLS
- 2026-04-16 Listed for Rent $995 RentEngineListings
- 2026-03-26 Relisted — Hive MLS
- 2026-03-26 Listing Removed — Hive MLS
- 2026-03-04 Price Changed $96,500 Hive MLS
- 2026-02-21 Relisted — Hive MLS
- 2026-02-20 Listing Removed — Hive MLS
- 2025-12-08 Relisted — Hive MLS
- 2025-11-30 Listing Removed — Hive MLS
- 2025-08-11 Price Changed $99,500 Hive MLS
- 2025-06-16 Price Changed $107,500 Hive MLS
- 2025-05-15 Listed $110,000 Hive MLS
- 2023-01-12 Sold (MLS) $55,000 Hive MLS
- 2023-01-06 Sold (Public Records) $55,000 Public Records
- 2022-11-26 Pending — Hive MLS
- 2022-10-17 Listed $59,905 Hive MLS
- 1999-05-28 Sold (Public Records) $45,000 Public Records
Property tax history
+6.2%/yrLatest (2025): $488 · +0.0% YoY. Source: county tax records.
Cash-flow waterfall
monthlySold comps — $/sqft
last 12 mo · ≤1 miLoading sold comps…