15020 Hackney Dr · St. Robert, MO
Flood risk No data
- FEMA flood zone
- —
- Chance of flooding over 30 yrs
- —
- Est. flood insurance / yr
- —
Fire risk No data
- Est. fire insurance / yr
- —
Heat risk No data
- Hot days now (above threshold)
- —
- Hot days in 30 yrs
- —
Wind risk No data
- Chance of severe wind over 30 yrs
- —
Air-quality risk No data
- Unhealthy air days now
- —
- Unhealthy air days in 30 yrs
- —
Risk factors via First Street. Map © Google.
Why this score? — see what drove the C grade
The composite is a weighted blend of 9 inputs, each scored 0–100. Each bar is that input's sub-score; the figure is the points it added to the 100-point composite (weight × sub-score).
- Cash flow +22.3/30.0
- ARV discount +7.5/15.0
- DSCR +7.1/10.0
- Rent growth +5.0/5.0
- 1% rule +4.6/10.0
- Schools +4.2/10.0
- Livability +2.5/5.0
- Condition / age +2.5/5.0
- Appreciation +0.0/10.0
$150,000
🖨 Deal sheet 📄 Offer letter ✓ Due diligence
Listing remarks
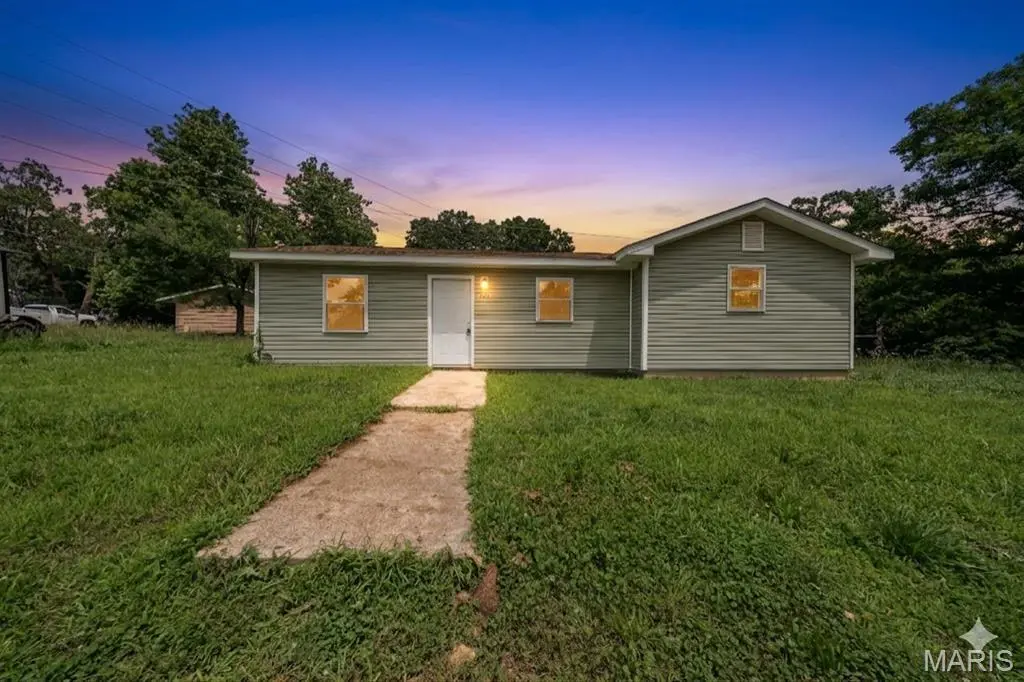
Beautifully updated 3 bedroom, 2 bathroom home on a 0.13-acre lot m/l in St. Robert! Just minutes from Ft. Leonard Wood, this property features luxury vinyl plank flooring, a charming eat-in kitchen with durable wood cabinetry and sleek stainless steel appliances, and a centrally located hall laundry for convenience. The primary suite includes a full en-suite bathroom, while a large back deck provides a perfect spot to enjoy the level backyard. Previously generating $1,300 per month in rental income—this is an excellent investment opportunity! You don't want to miss this! Schedule your private showing soon!
Key facts
- Large back deck
- Level backyard
- Updated home
Tags
Property features AI
Finance
- Other: Living area approximately 1,516 (assessor); Above-grade finished area reported as 1,120 (assessor)
Exterior
- Parking: Off-street parking
- Utilities: Public water; Public sewer; Electricity connected (220 volts available); Water connected; Sewer connected
- Home design: Single family residence; One story; Updated/remodeled; Private ownership; House structure type
- Construction: Frame construction; Architectural shingle roof
- Exterior features: Deck; Rain gutters; Level lot; County road frontage; Gravel road surface
Interior
- Kitchen: Stainless steel appliances; Dishwasher; Microwave; Electric range; Refrigerator
- Bedrooms: Three bedrooms (all on the main level)
- Flooring: Laminate counters mentioned (flooring type not specified)
- Bathrooms: Two full bathrooms (both on the main level)
- Heating & cooling: Baseboard heating; Central air conditioning (electric)
- Interior features: Open floorplan; Eat-in kitchen; Laminate counters; Lighting; Bathrooms and kitchen facilities included in building features
- Laundry & utility: Washer hookup; Electric dryer hookup; Laundry located in hall
Neighborhood map
What this means for you Summary
Snapshot
- This is a 3-bed/2.0-bath other listed at $150k.
Deal economics
- At list price, monthly cash flow is $247 ($3k/yr) — positive.
- The deal already cash-flows at list — no discount required.
- To meet the 1% rule (rent ≥ 1% of price), the offer needs to be $144k (3.9% below list).
- Recommended offer: $144k (3.9% below list) — sets the bar for 1% rule.
- Cap rate 8.3% vs local median 4.4% in St. Robert — top-decile yield for the area; either an underpriced asset or a hidden risk that comps aren't pricing in. Stress-test before assuming the spread holds.
Location & tenants
- Location reads: area grade C — affects rentability + tenant quality, not the cash-flow math above.
- Waynesville R-VI (town): math 46% / reading 53% proficiency, ranked #41 of 324 in MO (top 13%) — families likely to look elsewhere, expect single-tenant / working-renter base with shorter leases.
- Zoned schools: Waynesville East Elem. (math 51% / reading 53%, grade C-, #231 of 1,115 statewide, top 24%, 929 students, 44% FRL); Waynesville Sr. High (math 37% / reading 53%, grade D-, #176 of 521 statewide, top 34%, 1,704 students, 39% FRL).
- Market conditions: Rents rising fast (+10.2%/yr); 130 active listings in the ZIP; 1 comparable units currently listed for rent nearby; 62 units permitted in Pulaski County in 2024 (0 in 5+ unit buildings).
Forward outlook
- Local home prices are declining (-3.0%/yr); year-one equity from $1k of loan paydown is wiped out by about $4k of value loss. Plan a longer hold.
- At projected returns (-3.0% appreciation + 8.0% rent growth), your $42k cash investment doubles in ~9 years — after that, you're playing with house money.
Negotiation context
- Only 9 days on market — expect competitive offers; lowballing is unlikely to land.
- 2 sale attempts with the ask held roughly flat each time — persistent listings suggest the price (not the market) is what's stuck; bring a comps-based counter.
Questions for the listing agent
- Built in 1972 — when were the roof, HVAC, electrical panel, plumbing, and water heater last replaced?
- Is there a deadline driving the sale (1031 exchange, divorce, estate, relocation)? That informs how much negotiation room exists.
- What's the average days-on-market for RENTAL listings here right now (not sales)? A rising rental-DOM trend means longer vacancies and softer asking-rent achievability than the comps imply.
- What's the recent tenant-quality profile in this submarket — average credit score on applications, eviction rate, late-payment / NSF rate, and stable-employment percentage? A property-management company in the area should have these aggregated.
- How much new for-sale + rental construction is in the pipeline within 1–3 miles? Heavy new supply typically softens prices + rents 12–24 months out; constrained supply supports both.
Investment metrics
- 1% rule
- 0.96% ✗
- Cap rate
- 8.27%
- Cash-on-cash
- 7.05%
- DSCR
- 1.31
- GRM
- 8.7
CMA / ARV
No comps found within radius.
Projected returns pro-forma
-3.0% appreciation · 8.0% rent growth · sell at horizon
- IRR
- -0.6%
- Equity multiple
- 0.98×
- Total profit
- $-1,038
- Equity at exit
- $22,365
- IRR
- 13.3%
- Equity multiple
- 2.28×
- Total profit
- $53,735
- Equity at exit
- $12,969
Cash invested: $42,000 (down + closing). Projections, not guarantees.
Landlord ↔ Tenant lean methodology
- Overall (STATE)
- 81 Strongly Landlord-Friendly
- State Missouri
- 81 Strongly Landlord-Friendly · R+10
- County
- — inherits STATE
- City
- — inherits STATE
ZIP-level market 65584
- Home prices YoY
- -18.8%
- Rents YoY
- 10.2%
- Active inventory
- 130
- Price-to-rent
- 8.7×
Monthly cashflow live
- Estimated rent
- $1,442 medium interval (Pro) →
- Mortgage (P&I)
- −$787
- Tax from tax record
- −$43 /mo · $515/yr
- Insurance
- −$62
- HOA
- −$0
- Vacancy / Maint / Mgmt
- −$303
- Net cashflow
- $247
Break-even live
UW: 25.0% down · 7.5% · 30yr · 1.5% tax · 5.0% vac · 8.0% maint · 8.0% mgmt
Financing live
Cash to close
- Down payment
- $37,500
- Closing costs
- $4,500
- Reserves months
- —
- Total cash needed
- —
Loan-product check · same deal, 3 products live
Conventional
25% down · 7.5% · 30yr
- Down + closing
- —
- Monthly P&I
- —
- Monthly cashflow
- —
- DSCR
- —
- Eligible?
- —
Personal DTI + credit; lowest rate.
DSCR
20% down · 8.5% · 30yr
- Down + closing
- —
- Monthly P&I
- —
- Monthly cashflow
- —
- DSCR
- —
- Eligible?
- —
No personal income docs; deal must DSCR.
Hard money
10% down · 12.0% · 12mo
- Down + closing
- —
- Monthly P&I
- —
- Monthly cashflow
- —
- DSCR
- —
- Eligible?
- —
Short-term bridge; refi at stabilization.
Rent comps 1 comps
| Address | Beds | Baths | Sqft | Rent | $/sqft | DOM | Units | Dist |
|---|---|---|---|---|---|---|---|---|
| 24344 Tanglewood Rd Saint Robert, MO | 3.0 | 2.0 | 1450 | $1,425 | $0.98 | 43d | 1 | 1.46mi |
Listing history 8 events
-
2026-06-19days on market $150,000 Active 9 DOM
-
2026-06-18days on market $150,000 Active 8 DOM
-
2026-06-17days on market $150,000 Active 7 DOM
-
2026-06-16days on market $150,000 Active 6 DOM
-
2026-06-15days on market $150,000 Active 5 DOM
-
2026-06-14days on market $150,000 Active 3 DOM
-
2026-06-12remarks 615-char remark
-
2026-06-12$150,000 Active 2 DOM
ⓘ Source: listings_history table (triggers on properties + properties_extension) + one-shot
backfill from property_details.listing_events for pre-trigger history.
Tax reassessment forecast MO · Resets to sale price
- Current annual tax
- $515 · $43/mo
- Projected year-2 tax
- $1,455 · $121/mo
- Expected delta
- +$940/yr (+$78/mo · 182.4%)
ⓘ Screening estimate from a state-policy table — verify with the county assessor before closing.
Nearby sold comps map
Loading sold comps map…
Walkable amenities ~0.75 mi
Loading nearby amenities…
Taxation est. · year 1
- Rental income
- $17,299
- − Mortgage interest
- −$8,402
- − Property taxes
- −$515
- − Insurance
- −$750
- − Repairs & maintenance
- −$1,384
- − Management
- −$1,384
- − Depreciation
- −$4,364
- Taxable income
- $500
- Est. tax owed @ 24.0%
- −$120
- After-tax cash flow
- $2,841/yr
For passive investors: Depreciation is non-cash, so a rental often shows a tax loss while cash-flowing — sheltering income. Rental losses are passive: they offset passive income freely, and up to $25,000/yr can offset ordinary (W-2) income if you actively participate and your MAGI is under $100k (phasing out to $0 by $150k); unused losses carry forward. On sale, claimed depreciation is recaptured at up to 25%, and gains may owe capital-gains tax (a 1031 exchange can defer both). Figures are a year-1 estimate at your 24.0% rate — not tax advice; consult a CPA.
Schools (NCES district)
- District
- Waynesville R-VI
- NCES district ID
- 2931440
- Math proficiency
- 46% ▼ -1.00%
- Reading proficiency
- 53% ▼ -1.00%
- Median HH income
- $50,147
- Composite
- 42.36/100
- National rank
- #3246
- State rank
- #41 of 324 in MO
Livability — St. Robert
No livability data for this city. (Only ~50 U.S. cities are tracked.)
Census & demographics
- County
- Pulaski County · 25,264 people
- Metro
- Fort Leonard Wood, MO
- Population (ZIP)
- 10,553
- Household income
- $63,328
- Rent vs Own
- Severe rent burden
- 368.0
Population outlook (Pulaski County) Hauer SSP2
- Today (2025)
- 54,214 people
- By 2030
- 54,723 · +0.9%
- By 2040
- 54,885 · +1.2%
- By 2050
- 55,467 · +2.3%
- By 2075
- 58,576 · +8.0%
- By 2100
- 61,179 · +12.8%
Race, ethnicity, and origin ACS 2023
- Neighborhood character
- Diverse neighborhood (Simpson 0.56)
- Race & ethnicity
- White 65% Two or more races 15% Hispanic / Latino 11% Black 10% Asian 4%
- Hispanic origin (detail)
- Mexican 2% Puerto Rican 4%
- Common ancestry
- Slovak 3% Lithuanian 2% Italian 2%
- Foreign-born
- 6% · South Korea, Canada, China
- Languages at home
- 85% English-only · Spanish 5% German/W. Germanic 4% Korean 4%
Political lean MEDSL · Pulaski
- 2024 margin
- Solid R (+50.3) · D 24.2% · R 74.5% · Other 1.3%
- 2008→2024 swing
- -21.6pp toward R · 2008: -28.7pp · 2024: -50.3pp
- All cycles
- 2024: R+50.3 2020: R+45.7 2016: R+51.7 2012: R+36.1 2008: R+28.7
Not yet ingested
- Civics
- —
Market trends
- HPI YoY
- ▼ -30.16%
- Current HPI
- 130.0726
- Rent YoY
- ▲ 10.20%
- Metro
- Fort Leonard Wood, MO
- State GDP YoY
- ▲ 1.84%
- F500 in state
- 20
Industry mix (Fortune 500 HQ in MO)
| Industry | F500 HQs | Revenue |
|---|---|---|
| Healthcare | 1 | $163B |
|
||
| Insurance | 1 | $21B |
|
||
| Industrial Technology | 1 | $17B |
|
||
| Retail | 1 | $16B |
|
||
| Industrial Distribution | 1 | $10B |
|
||
| Utilities | 1 | $9B |
|
||
Price history
+0.0% since first listed3 events — show timeline
- 2026-06-10 Listed $150,000 MARIS as Distributed by MLS Grid
- 2026-03-31 Sold (Public Records) — Public Records
- 2025-09-24 Listed $150,000 MARIS as Distributed by MLS Grid
Property tax history
-15.1%/yrLatest (2025): $515 · -15.1% YoY. Source: county tax records.
Cash-flow waterfall
monthlySold comps — $/sqft
last 12 mo · ≤1 miLoading sold comps…