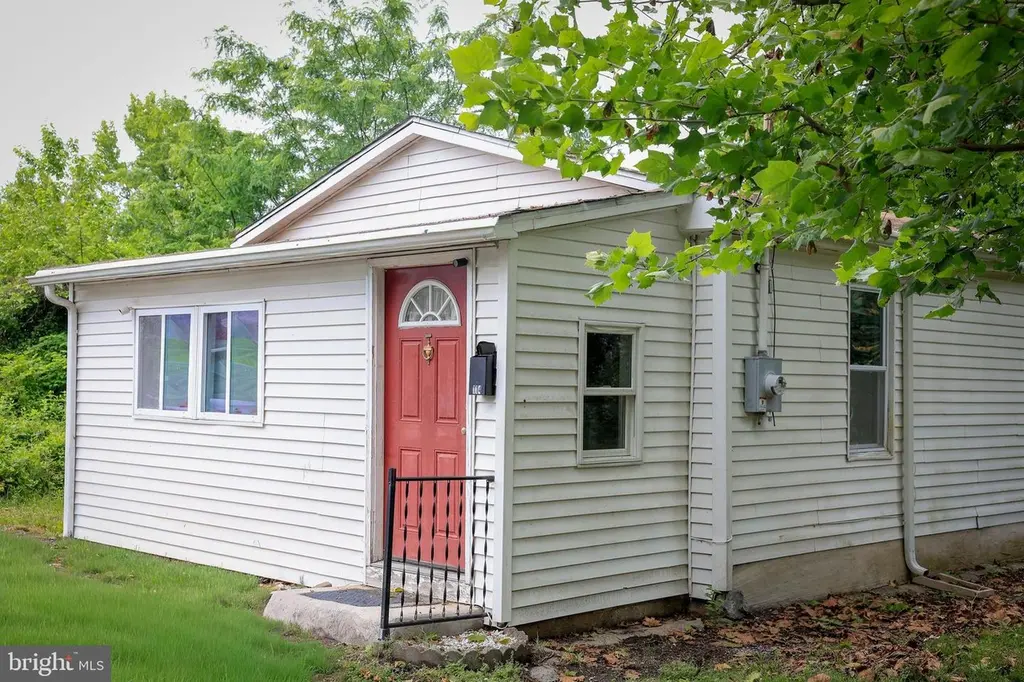
114 Deming Ave · Penns Grove, NJ
Flood risk 6/10 · Moderate
- FEMA flood zone
- X (shaded)
- Chance of flooding over 30 yrs
- 0.71%
- Est. flood insurance / yr
- $507 – $1,088
Fire risk 1/10 · Minimal
- Est. fire insurance / yr
- $526 – $976
Heat risk 7/10 · Major
- Hot days now (above 104°F)
- 7 days/yr
- Hot days in 30 yrs
- 15 days/yr
Wind risk 6/10 · Moderate
- Chance of severe wind over 30 yrs
- 27.0%
Air-quality risk 3/10 · Minor
- Unhealthy air days now
- 3 days/yr
- Unhealthy air days in 30 yrs
- 5 days/yr
Risk factors via First Street. Map © Google.
Why this score? — see what drove the C grade
The composite is a weighted blend of 9 inputs, each scored 0–100. Each bar is that input's sub-score; the figure is the points it added to the 100-point composite (weight × sub-score).
- Cash flow +26.6/30.0
- DSCR +9.1/10.0
- 1% rule +7.2/10.0
- ARV discount +3.4/15.0
- Livability +2.9/5.0
- Rent growth +2.5/5.0
- Condition / age +2.5/5.0
- Schools +1.2/10.0
- Appreciation +0.0/10.0
$149,900
🖨 Deal sheet 📄 Offer letter ✓ Due diligence
Listing remarks
Investor Special / Great Starter Home Opportunity! 114 Deming Avenue offers 2 bedrooms, 1 full bath, and convenient one-floor living with plenty of potential for the next owner. Ideal for investors, downsizers, or buyers looking to build equity with updates and personal touches. Seller is motivated and welcomes serious offers. Property is currently tenant occupied on a month-to-month lease; tenant may vacate prior to closing unless purchaser chooses to continue tenancy. Conveniently located near major highways, bridges, shopping, and local amenities. Property being sold strictly as-is. Buyer responsible for any and all inspections, certifications, and repairs required for closing.
Key facts
- One-floor living
- Local amenities
- Conveniently located
Tags
Property features AI
Exterior
- Parking: On-street parking
- Utilities: 200+ amp electric service; Public water; Public sewer
- Home design: Detached property; Effective year of remodel 2015
- Construction: Asphalt roof; Slab foundation; Built/record year per assessor
- Exterior features: Lot dimensions approximately 24.9 x 110; Not in a federal flood zone; Ground rent paid annually
Interior
- Kitchen: Refrigerator; Stove
- Bedrooms: Two bedrooms on the main level
- Bathrooms: One full bathroom (main level)
- Heating & cooling: Electric baseboard heating; Electric hot water
- Interior features: Refrigerator and stove included; No basement
- Laundry & utility: Main-floor laundry
Neighborhood map
What this means for you Summary
Snapshot
- This is a 2-bed/1.0-bath single-family listed at $150k.
Deal economics
- At list price, monthly cash flow is $399 ($5k/yr) — positive.
- The deal already cash-flows at list — no discount required.
- Meets the 1% rule at list price ($2k rent vs $150k).
- Recommended offer: $148k (1.5% below list) — sets the bar for market timing.
- Cap rate 9.5% vs local median 6.0% in Penns Grove — top-decile yield for the area; either an underpriced asset or a hidden risk that comps aren't pricing in. Stress-test before assuming the spread holds.
Location & tenants
- Location reads 57/100 on livability (#519 in NJ) — a working-class tenant base; expect higher turnover. Strengths: cost of living A, housing A-; Watch: schools F, crime F, amenities F.
- Penns Grove-Carneys Point Regional School District (suburban): math 6% / reading 21% proficiency, ranked #462 of 472 in NJ (top 98%) — low school quality limits family demand, transient renter base, plan for 1-2y turnover; 65% free/reduced lunch — lower-income household profile, screen leases tightly.
- Market conditions: 101 active listings in the ZIP; 95 units permitted in Salem County in 2024 (0 in 5+ unit buildings).
- This rent runs 31% of the median local income ($72k/yr) — at the standard rent-burdened threshold; future hikes will face affordability resistance.
Forward outlook
- Local home prices are declining (-3.0%/yr); year-one equity from $1k of loan paydown is wiped out by about $4k of value loss. Plan a longer hold.
- Salem County population projected at -23% by 2050 — secular population decline; favor cash flow + early exit over multi-decade hold.
- At projected returns (-3.0% appreciation + 3.0% rent growth), your $42k cash investment doubles in ~10 years — after that, you're playing with house money.
Negotiation context
- It's been on market 22 days — a 2% lower offer ($148k) is reasonable based on typical stale-listing flexibility.
- 5 sale attempts since 11y ago with the ask held roughly flat each time — persistent listings suggest the price (not the market) is what's stuck; bring a comps-based counter.
Risks & watch-outs
- Watch-outs: built in 1940 — expect roof / HVAC / electrical / plumbing capex.
- Climate carrying-cost: major flood risk; major wind risk, 27% chance of damaging wind over 30y; extreme-heat days projected 7→15/yr by 2055 (HVAC capex compounding) — expect insurance premiums to compound above CPI over the hold.
Questions for the listing agent
- Built in 1940 — when were the roof, HVAC, electrical panel, plumbing, and water heater last replaced?
- Is there a deadline driving the sale (1031 exchange, divorce, estate, relocation)? That informs how much negotiation room exists.
- Schools are F-rated, which usually means shorter tenancies and higher turnover. Who's the typical renter profile here, and what's been the actual vacancy rate?
- Crime grade is F in this area — have there been break-ins, vandalism, or insurance claims at this property in the last 3 years? What carrier currently insures it and at what premium?
- What's the average days-on-market for RENTAL listings here right now (not sales)? A rising rental-DOM trend means longer vacancies and softer asking-rent achievability than the comps imply.
- What's the recent tenant-quality profile in this submarket — average credit score on applications, eviction rate, late-payment / NSF rate, and stable-employment percentage? A property-management company in the area should have these aggregated.
- How much new for-sale + rental construction is in the pipeline within 1–3 miles? Heavy new supply typically softens prices + rents 12–24 months out; constrained supply supports both.
Investment metrics
- 1% rule
- 1.22% ✓
- Cap rate
- 9.49%
- Cash-on-cash
- 11.40%
- DSCR
- 1.51
- GRM
- 6.8
CMA / ARV
- ARV (on-the-fly)
- $137,280
- Comps found
- 9
Show comp detail 9 sales within ~0.75 mi
| Address | Dist | Beds/Ba | Sqft | Sold | Price | $/sf | Match |
|---|---|---|---|---|---|---|---|
| 83 Willis Ave | 0.05mi | 2/1.0 | 736 (+12%) | 5mo | $140,000 | $190 | 75 |
| 57 Cumberland Ave | 0.08mi | 2/1.0 | 640 (-3%) | 21mo | $160,000 | $250 | 74 |
| 303 Gillette Ave | 0.19mi | 2/1.0 | 660 (0%) | 23mo | $100,000 | $152 | 72 |
| 21 N Smith Ave | 0.23mi | 2/1.0 | 672 (+2%) | 23mo | $60,000 | $89 | 67 |
| 51 E Griffith St | 0.43mi | 1/1.0 (-1) | 574 (-13%) | 1mo | $90,000 | $157 | 53 |
| 142 N Dolbow Ave | 0.67mi | 2/1.0 | 714 (+8%) | 4mo | $213,000 | $298 | 52 |
| 113 N Broad St | 0.63mi | 2/1.0 | 750 (+14%) | 4mo | $161,000 | $215 | 44 |
| 281 S Riverwalk | 0.52mi | 2/1.0 | 720 (+9%) | 21mo | $150,000 | $208 | 43 |
| 55 Airy Ave | 0.60mi | 1/1.0 (-1) | 600 (-9%) | 11mo | $130,000 | $217 | 42 |
Match score weights: distance 35% · size 25% · config 20% · recency 20%. Top-matched comps best support the ARV.
Projected returns pro-forma
-3.0% appreciation · 3.0% rent growth · sell at horizon
- IRR
- 0.7%
- Equity multiple
- 1.03×
- Total profit
- $1,149
- Equity at exit
- $22,351
- IRR
- 10.4%
- Equity multiple
- 1.81×
- Total profit
- $33,850
- Equity at exit
- $12,961
Cash invested: $41,972 (down + closing). Projections, not guarantees.
Landlord ↔ Tenant lean methodology
- Overall (STATE)
- 21 Tenant-Leaning
- State New Jersey
- 21 Tenant-Leaning · D+6
- County
- — inherits STATE
- City
- — inherits STATE
ZIP-level market 08069
- Home prices YoY
- -18.8%
- Active inventory
- 101
- Price-to-rent
- 6.8×
Monthly cashflow live
- Estimated rent
- $1,829 medium interval (Pro) →
- Mortgage (P&I)
- −$786
- Tax from tax record
- −$197 /mo · $2,367/yr
- Insurance
- −$62
- HOA
- −$0
- Vacancy / Maint / Mgmt
- −$384
- Net cashflow
- $399
Break-even live
UW: 25.0% down · 7.5% · 30yr · 1.5% tax · 5.0% vac · 8.0% maint · 8.0% mgmt
Financing live
Cash to close
- Down payment
- $37,475
- Closing costs
- $4,497
- Reserves months
- —
- Total cash needed
- —
Loan-product check · same deal, 3 products live
Conventional
25% down · 7.5% · 30yr
- Down + closing
- —
- Monthly P&I
- —
- Monthly cashflow
- —
- DSCR
- —
- Eligible?
- —
Personal DTI + credit; lowest rate.
DSCR
20% down · 8.5% · 30yr
- Down + closing
- —
- Monthly P&I
- —
- Monthly cashflow
- —
- DSCR
- —
- Eligible?
- —
No personal income docs; deal must DSCR.
Hard money
10% down · 12.0% · 12mo
- Down + closing
- —
- Monthly P&I
- —
- Monthly cashflow
- —
- DSCR
- —
- Eligible?
- —
Short-term bridge; refi at stabilization.
Listing history 25 events
-
2026-06-18days on market $149,900 Active 22 DOM
-
2026-06-17days on market $149,900 Active 21 DOM
-
2026-06-16days on market $149,900 Active 20 DOM
-
2026-06-15days on market $149,900 Active 19 DOM
-
2026-06-13days on market $149,900 Active 17 DOM
-
2026-06-09days on market $149,900 Active 13 DOM
-
2026-06-08days on market $149,900 Active 12 DOM
-
2026-06-07days on market $149,900 Active 11 DOM
-
2026-06-04days on market $149,900 Active 8 DOM
-
2026-06-03days on market $149,900 Active 7 DOM
-
2026-06-02days on market $149,900 Active 6 DOM
-
2026-06-01days on market $149,900 Active 5 DOM
-
2026-05-31days on market $149,900 Active 4 DOM
-
2026-05-27$149,900 Active
-
2025-10-07status Pending
-
2025-10-07historical
-
2025-09-02$159,000 Active
-
2020-02-05historical
-
2019-09-24historical
-
2019-09-24$50,000
-
2019-08-31historical
-
2019-04-30price $50,000
-
2019-04-03$54,000 Active
-
2015-11-01historical
-
2015-03-12$79,500
ⓘ Source: listings_history table (triggers on properties + properties_extension) + one-shot
backfill from property_details.listing_events for pre-trigger history.
Tax reassessment forecast NJ · Partial reset (capped growth)
- Current annual tax
- $2,367 · $197/mo
- Projected year-2 tax
- $3,050 · $254/mo
- Expected delta
- +$683/yr (+$57/mo · 28.8%)
ⓘ Screening estimate from a state-policy table — verify with the county assessor before closing.
Climate risk First Street
- Flood 6/10 Major FEMA zone X (shaded) · 71% chance over 30 yrs
- Wildfire 1/10 Low
- Heat 7/10 Severe 7 d/yr ≥104°F today · 15 d/yr by 30 yrs out
- Wind 6/10 Major 27% chance of damaging wind over 30 yrs
- Air quality 3/10 Moderate 3 unhealthy d/yr today · 5 by 30 yrs out
Nearby sold comps map
Loading sold comps map…
Walkable amenities ~0.75 mi
Loading nearby amenities…
Taxation est. · year 1
- Rental income
- $21,945
- − Mortgage interest
- −$8,397
- − Property taxes
- −$2,367
- − Insurance
- −$750
- − Repairs & maintenance
- −$1,756
- − Management
- −$1,756
- − Depreciation
- −$4,361
- Taxable income
- $2,560
- Est. tax owed @ 24.0%
- −$614
- After-tax cash flow
- $4,172/yr
For passive investors: Depreciation is non-cash, so a rental often shows a tax loss while cash-flowing — sheltering income. Rental losses are passive: they offset passive income freely, and up to $25,000/yr can offset ordinary (W-2) income if you actively participate and your MAGI is under $100k (phasing out to $0 by $150k); unused losses carry forward. On sale, claimed depreciation is recaptured at up to 25%, and gains may owe capital-gains tax (a 1031 exchange can defer both). Figures are a year-1 estimate at your 24.0% rate — not tax advice; consult a CPA.
Schools (NCES district)
- District
- Penns Grove-Carneys Point Regional School District
- NCES district ID
- 3412840
- Math proficiency
- 6% ▼ -16.00%
- Reading proficiency
- 21% ▼ -7.00%
- Median HH income
- $44,930
- Composite
- 11.98/100
- National rank
- #9665
- State rank
- #462 of 472 in NJ
Livability — Penns Grove
- Score
- 57/100
- State rank
- #519
- US rank
- #22190
Category grades
Schools grade is shown separately in the Schools card above.
Census & demographics
- Census place
- Penns Grove, NJ
- County
- Salem County · 24,175 people
- Metro
- Philadelphia-Camden-Wilmington, PA-NJ-DE-MD
- Population (ZIP)
- 13,413
- Household income
- $71,942
- Rent vs Own
- Severe rent burden
- 696.0
Population outlook (Salem County) Hauer SSP2
- Today (2025)
- 59,905 people
- By 2030
- 57,351 · -4.3%
- By 2040
- 51,837 · -13.5%
- By 2050
- 46,356 · -22.6%
- By 2075
- 36,452 · -39.2%
- By 2100
- 28,907 · -51.7%
Race, ethnicity, and origin ACS 2023
- Neighborhood character
- Diverse neighborhood (Simpson 0.65)
- Race & ethnicity
- White 50% Hispanic / Latino 22% Black 22% Two or more races 8% Asian 2%
- Hispanic origin (detail)
- Mexican 5% Puerto Rican 14%
- Common ancestry
- Romanian 3% Slovak 2% Lithuanian 1%
- Foreign-born
- 5% · Canada
- Languages at home
- 85% English-only · Spanish 13% Tagalog/Filipino 1%
Political lean MEDSL · Salem
- 2024 margin
- R (+19.2) · D 39.6% · R 58.8% · Other 1.6%
- 2008→2024 swing
- -23.1pp toward R · 2008: 3.9pp · 2024: -19.2pp
- All cycles
- 2024: R+19.2 2020: R+12.8 2016: R+15.4 2012: D+0.8 2008: D+3.9
Not yet ingested
- Civics
- —
Market trends
- HPI YoY
- ▼ -67.07%
- Current HPI
- 290.3853
- Rent YoY
- —
- Metro
- Philadelphia-Camden-Wilmington, PA-NJ-DE-MD
- State GDP YoY
- ▲ 2.05%
- F500 in state
- 34
Industry mix (Fortune 500 HQ in NJ)
| Industry | F500 HQs | Revenue |
|---|---|---|
| Consumer Goods | 3 | $31B |
|
||
| Pharmaceuticals | 2 | $153B |
|
||
| Technology | 2 | $21B |
|
||
| Insurance | 2 | $20B |
|
||
| Healthcare | 2 | $19B |
|
||
| Financial Services | 1 | $70B |
|
||
Price history
+88.6% since first listed12 events — show timeline
- 2026-05-27 Listed $149,900 BRIGHT MLS
- 2025-10-07 Pending — BRIGHT MLS
- 2025-10-07 Listing Removed — BRIGHT MLS
- 2025-09-02 Listed $159,000 BRIGHT MLS
- 2020-02-05 Listing Removed — BRIGHT MLS
- 2019-09-24 Listed $50,000 BRIGHT MLS
- 2019-09-24 Listing Removed — BRIGHT MLS
- 2019-08-31 Listing Removed — BRIGHT MLS
- 2019-04-30 Price Changed $50,000 BRIGHT MLS
- 2019-04-03 Listed $54,000 BRIGHT MLS
- 2015-11-01 Listing Removed — BRIGHT MLS
- 2015-03-12 Listed $79,500 BRIGHT MLS
Property tax history
+3.0%/yrLatest (2025): $2,367 · +1.9% YoY. Source: county tax records.
Cash-flow waterfall
monthlySold comps — $/sqft
last 12 mo · ≤1 miLoading sold comps…