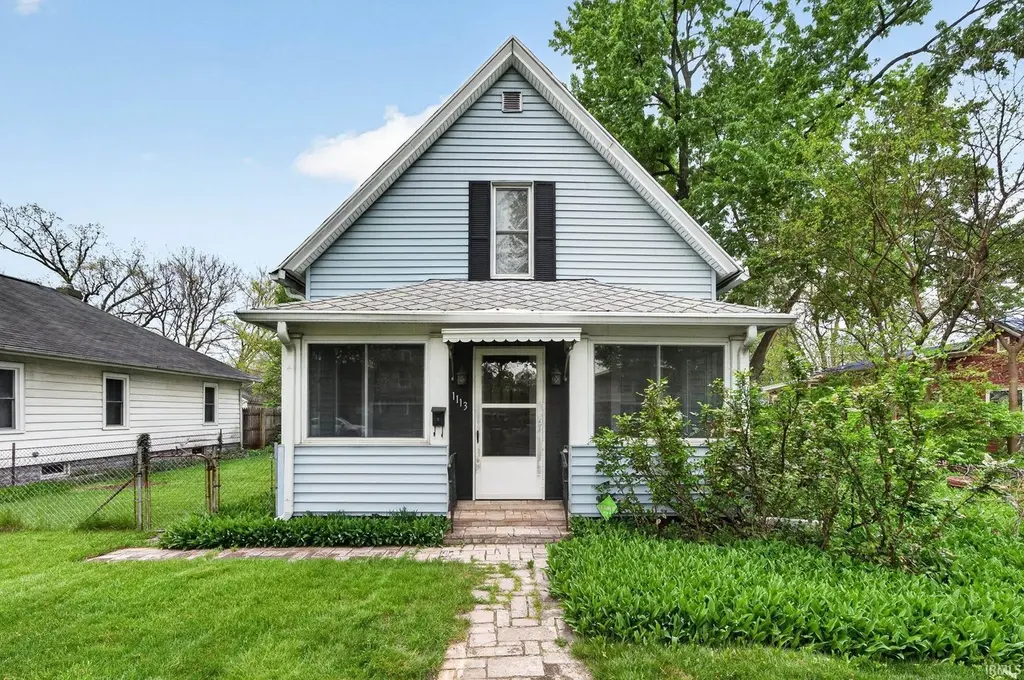
1113 S 23rd St · South Bend, IN
Flood risk 1/10 · Minimal
- FEMA flood zone
- X (unshaded)
- Chance of flooding over 30 yrs
- 0.0%
- Est. flood insurance / yr
- $473 – $860
Fire risk 1/10 · Minimal
- Est. fire insurance / yr
- $717 – $1,331
Heat risk 3/10 · Minor
- Hot days now (above 99°F)
- 7 days/yr
- Hot days in 30 yrs
- 16 days/yr
Wind risk 2/10 · Minimal
- Chance of severe wind over 30 yrs
- —
Air-quality risk 3/10 · Minor
- Unhealthy air days now
- 2 days/yr
- Unhealthy air days in 30 yrs
- 3 days/yr
Risk factors via First Street. Map © Google.
Why this score? — see what drove the D grade
The composite is a weighted blend of 9 inputs, each scored 0–100. Each bar is that input's sub-score; the figure is the points it added to the 100-point composite (weight × sub-score).
- Cash flow +15.9/30.0
- ARV discount +7.0/15.0
- DSCR +4.9/10.0
- Rent growth +4.1/5.0
- 1% rule +3.5/10.0
- Livability +3.2/5.0
- Condition / age +2.5/5.0
- Schools +1.4/10.0
- Appreciation +0.0/10.0
$187,000
🖨 Deal sheet 📄 Offer letter ✓ Due diligence
Listing remarks
Conveniently located near popular restaurants, the library, and Indiana University South Bend (IUSB), this well-maintained home offers the perfect blend of comfort and location. Step inside to find a thoughtfully designed layout featuring first-floor laundry for everyday convenience. The highlight of the home is the beautiful kitchen addition with striking wood beams across the ceiling, creating a warm and inviting space perfect for cooking and gathering. A brand-new furnace provides peace of mind and energy efficiency for years to come. Pride of ownership is evident throughout this well-cared-for home. Whether you're looking for easy access to dining, education, and everyday amenities, or
Key facts
- Kitchen addition
- Wood beams
- Brand-new furnace
Tags
Property features AI
Exterior
- Parking: Detached garage; Off-street parking; 2-car garage
- Utilities: Public water; Public sewer
- Home design: Single-family residence, site-built; Two-story
- Construction: Aluminum siding
- Exterior features: Level lot; Lot dimensions approximately 51 x 165; Lot size about 0.19 acres
Interior
- Bedrooms: Bedrooms on main level
- Bathrooms: One full bathroom on the main level
- Heating & cooling: Central air conditioning; Natural gas heating
- Interior features: Partial basement; 7 total rooms
- Laundry & utility: Laundry on the main level
Neighborhood map
What this means for you Summary
Snapshot
- This is a 3-bed/1.0-bath single-family listed at $187k.
Deal economics
- At list price, monthly cash flow is $90 ($1k/yr) — positive.
- The deal already cash-flows at list — no discount required.
- To meet the 1% rule (rent ≥ 1% of price), the offer needs to be $159k (15.0% below list).
- Recommended offer: $159k (15.0% below list) — sets the bar for 1% rule.
- Cap rate 6.9% vs local median 4.4% in South Bend — top-decile yield for the area; either an underpriced asset or a hidden risk that comps aren't pricing in. Stress-test before assuming the spread holds.
Location & tenants
- Location reads 64/100 on livability (#365 in IN) — a middle-class / working-renter tenant base. Strengths: cost of living A+, housing A+, health & safety A+; Watch: amenities D, employment D, crime F.
- South Bend Community School Corporation (urban): math 12% / reading 21% proficiency, ranked #284 of 301 in IN (top 94%) — low school quality limits family demand, transient renter base, plan for 1-2y turnover; 66% free/reduced lunch — lower-income household profile, screen leases tightly.
- Zoned schools: Nuner Fine Arts Academy (math 8% / reading 12%, grade F, #921 of 994 statewide, top 94%, 479 students, 90% FRL); Jefferson Traditional School (math 12% / reading 22%, grade F, #284 of 330 statewide, top 87%, 516 students, 64% FRL); Adams High School (math 28% / reading 57%, grade F, #195 of 369 statewide, top 53%, 1,976 students, 56% FRL) — zoned schools at 70% FRL track the district average.
- Market conditions: Rents rising fast (+6.3%/yr); 73 active listings in the ZIP; 8 comparable units currently listed for rent nearby; rentals at typical pace (median 21d on market — plan ~3-4 weeks tenant-placement turnaround); 754 units permitted in St. Joseph County in 2024 (460 in 5+ unit buildings).
- This rent runs 30% of the median local income ($63k/yr) — at the standard rent-burdened threshold; future hikes will face affordability resistance.
Forward outlook
- Local home prices are declining (-3.0%/yr); year-one equity from $1k of loan paydown is wiped out by about $6k of value loss. Plan a longer hold.
Negotiation context
- Only 3 days on market — expect competitive offers; lowballing is unlikely to land.
Risks & watch-outs
- Watch-outs: built in 1900 — expect roof / HVAC / electrical / plumbing capex.
Questions for the listing agent
- Built in 1900 — when were the roof, HVAC, electrical panel, plumbing, and water heater last replaced?
- Is there a deadline driving the sale (1031 exchange, divorce, estate, relocation)? That informs how much negotiation room exists.
- Schools are F-rated, which usually means shorter tenancies and higher turnover. Who's the typical renter profile here, and what's been the actual vacancy rate?
- Crime grade is F in this area — have there been break-ins, vandalism, or insurance claims at this property in the last 3 years? What carrier currently insures it and at what premium?
- The area grade is low — what's the realistic commute time and amenity access for the typical tenant pool here? Any planned neighborhood developments (good or bad) we should know about?
- What's the average days-on-market for RENTAL listings here right now (not sales)? A rising rental-DOM trend means longer vacancies and softer asking-rent achievability than the comps imply.
- What's the recent tenant-quality profile in this submarket — average credit score on applications, eviction rate, late-payment / NSF rate, and stable-employment percentage? A property-management company in the area should have these aggregated.
- How much new for-sale + rental construction is in the pipeline within 1–3 miles? Heavy new supply typically softens prices + rents 12–24 months out; constrained supply supports both.
Investment metrics
- 1% rule
- 0.85% ✗
- Cap rate
- 6.87%
- Cash-on-cash
- 2.05%
- DSCR
- 1.09
- GRM
- 9.8
CMA / ARV
- ARV (on-the-fly)
- $184,800
- Comps found
- 12
Show comp detail 12 sales within ~0.75 mi
| Address | Dist | Beds/Ba | Sqft | Sold | Price | $/sf | Match |
|---|---|---|---|---|---|---|---|
| 1113 S 23rd St | 0.00mi | 3/1.0 | 1,680 (0%) | 0mo | $185,000 | $110 | 100 |
| 205 N Middleboro Ave | 0.26mi | 3/1.0 | 1,588 (-6%) | 4mo | $165,000 | $104 | 75 |
| 742 S 26th St | 0.40mi | 3/1.0 | 1,744 (+4%) | 1mo | $185,000 | $106 | 74 |
| 946 S 28th St | 0.36mi | 4/2.0 (+1) | 1,680 (0%) | 1mo | $220,000 | $131 | 73 |
| 2605 Mishawaka St | 0.29mi | 3/1.0 | 1,785 (+6%) | 4mo | $175,000 | $98 | 73 |
| 1225 S 27th St | 0.26mi | 3/2.0 | 1,536 (-9%) | 0mo | $149,500 | $97 | 69 |
| 2806 Milburn Blvd | 0.52mi | 3/1.0 | 1,585 (-6%) | 1mo | $172,400 | $109 | 65 |
| 1111 S 27th St | 0.24mi | 3/1.5 | 1,464 (-13%) | 2mo | $155,000 | $106 | 64 |
| 114 River Ave | 0.39mi | 4/1.0 (+1) | 1,500 (-11%) | 0mo | $200,000 | $133 | 59 |
| 2204 Milburn Blvd | 0.61mi | 4/1.0 (+1) | 1,764 (+5%) | 4mo | $205,000 | $116 | 55 |
| 1201 S Twyckenham Dr | 0.62mi | 3/2.0 | 1,530 (-9%) | 4mo | $228,900 | $150 | 49 |
| 1734 Southwood Ave | 0.57mi | 3/2.0 | 1,464 (-13%) | 2mo | $240,000 | $164 | 46 |
Match score weights: distance 35% · size 25% · config 20% · recency 20%. Top-matched comps best support the ARV.
Projected returns pro-forma
-3.0% appreciation · 6.27% rent growth · sell at horizon
- IRR
- -9.8%
- Equity multiple
- 0.63×
- Total profit
- $-19,247
- Equity at exit
- $27,882
- IRR
- 3.3%
- Equity multiple
- 1.27×
- Total profit
- $14,073
- Equity at exit
- $16,168
Cash invested: $52,360 (down + closing). Projections, not guarantees.
Landlord ↔ Tenant lean methodology
- Overall (STATE)
- 90 Strongly Landlord-Friendly
- State Indiana
- 90 Strongly Landlord-Friendly · R+11
- County
- — inherits STATE
- City
- — inherits STATE
ZIP-level market 46615
- Home prices YoY
- -34.0%
- Rents YoY
- 6.3%
- Active inventory
- 73
- Price-to-rent
- 9.8×
Monthly cashflow live
- Estimated rent
- $1,589 high interval (Pro) →
- Mortgage (P&I)
- −$981
- Tax from tax record
- −$107 /mo · $1,287/yr
- Insurance
- −$78
- HOA
- −$0
- Vacancy / Maint / Mgmt
- −$334
- Net cashflow
- $90
Break-even live
UW: 25.0% down · 7.5% · 30yr · 1.5% tax · 5.0% vac · 8.0% maint · 8.0% mgmt
Financing live
Cash to close
- Down payment
- $46,750
- Closing costs
- $5,610
- Reserves months
- —
- Total cash needed
- —
Loan-product check · same deal, 3 products live
Conventional
25% down · 7.5% · 30yr
- Down + closing
- —
- Monthly P&I
- —
- Monthly cashflow
- —
- DSCR
- —
- Eligible?
- —
Personal DTI + credit; lowest rate.
DSCR
20% down · 8.5% · 30yr
- Down + closing
- —
- Monthly P&I
- —
- Monthly cashflow
- —
- DSCR
- —
- Eligible?
- —
No personal income docs; deal must DSCR.
Hard money
10% down · 12.0% · 12mo
- Down + closing
- —
- Monthly P&I
- —
- Monthly cashflow
- —
- DSCR
- —
- Eligible?
- —
Short-term bridge; refi at stabilization.
Rent comps 8 comps
| Address | Beds | Baths | Sqft | Rent | $/sqft | DOM | Units | Dist |
|---|---|---|---|---|---|---|---|---|
| 1106 S 20th St South Bend, IN | 1.0–3.0 | 1.0–2.0 | 885 | $1,200 | $1.36 | 13d | 1 | 0.17mi |
| 819 S 24th St South Bend, IN | 3.0 | 2.0 | 1480 | $1,795 | $1.21 | 43d | 1 | 0.28mi |
| 931 S 34th St South Bend, IN | 3.0 | 1.5 | 1656 | $1,550 | $0.94 | 43d | 1 | 0.71mi |
| 211 Columbia St Mishawaka, IN | 4.0 | 2.5 | 1500 | $1,795 | $1.20 | 21d | 1 | 0.98mi |
| 3001 E Jefferson Blvd South Bend, IN | 1.0–2.0 | 1.0–2.0 | 848 | $1,329 | $1.57 | 13d | 21 | 1.01mi |
| 1149 E Indiana Ave South Bend, IN | 4.0 | 2.0 | 1344 | $1,200 | $0.89 | 13d | 1 | 1.03mi |
| 1126 E Broadway St South Bend, IN | 4.0 | 2.0 | 1492 | $1,365 | $0.91 | 21d | 1 | 1.05mi |
| 1912 Miami St Unit 1912 South Bend, IN | 3.0 | 1.5 | 1300 | $1,400 | $1.08 | 43d | 1 | 1.23mi |
Listing history 2 events
-
2026-05-01status Pending
-
2026-04-28$187,000 Active
ⓘ Source: listings_history table (triggers on properties + properties_extension) + one-shot
backfill from property_details.listing_events for pre-trigger history.
Tax reassessment forecast IN · Partial reset (capped growth)
- Current annual tax
- $1,287 · $107/mo
- Projected year-2 tax
- $1,438 · $120/mo
- Expected delta
- +$151/yr (+$13/mo · 11.7%)
ⓘ Screening estimate from a state-policy table — verify with the county assessor before closing.
Climate risk First Street
- Flood 1/10 Low FEMA zone X (unshaded) · 0% chance over 30 yrs
- Wildfire 1/10 Low
- Heat 3/10 Moderate 7 d/yr ≥99°F today · 16 d/yr by 30 yrs out
- Wind 2/10 Low
- Air quality 3/10 Moderate 2 unhealthy d/yr today · 3 by 30 yrs out
Nearby sold comps map
Loading sold comps map…
Walkable amenities ~0.75 mi
Loading nearby amenities…
Taxation est. · year 1
- Rental income
- $19,070
- − Mortgage interest
- −$10,475
- − Property taxes
- −$1,287
- − Insurance
- −$935
- − Repairs & maintenance
- −$1,526
- − Management
- −$1,526
- − Depreciation
- −$5,440
- Taxable loss
- −$2,118
- Est. tax savings @ 24.0%
- +$508
- After-tax cash flow
- $1,584/yr
For passive investors: Depreciation is non-cash, so a rental often shows a tax loss while cash-flowing — sheltering income. Rental losses are passive: they offset passive income freely, and up to $25,000/yr can offset ordinary (W-2) income if you actively participate and your MAGI is under $100k (phasing out to $0 by $150k); unused losses carry forward. On sale, claimed depreciation is recaptured at up to 25%, and gains may owe capital-gains tax (a 1031 exchange can defer both). Figures are a year-1 estimate at your 24.0% rate — not tax advice; consult a CPA.
Schools (NCES district)
- District
- South Bend Community School Corporation
- NCES district ID
- 1810290
- Math proficiency
- 12% ▼ -10.00%
- Reading proficiency
- 21% ▼ -6.00%
- Median HH income
- $41,935
- Composite
- 14.21/100
- National rank
- #9452
- State rank
- #284 of 301 in IN
Livability — South Bend
- Score
- 64/100
- State rank
- #365
- US rank
- #13730
Category grades
Schools grade is shown separately in the Schools card above.
Census & demographics
- Census place
- South Bend, IN
- County
- Saint Joseph County · 189,048 people
- City population
- 99,767
- Metro
- South Bend-Mishawaka, IN-MI
- Population (ZIP)
- 14,190
- Household income
- $62,964
- Rent vs Own
- Severe rent burden
- 420.0
Population outlook (St. Joseph County) Hauer SSP2
- Today (2025)
- 273,186 people
- By 2030
- 273,594 · +0.1%
- By 2040
- 271,641 · -0.6%
- By 2050
- 269,187 · -1.5%
- By 2075
- 263,136 · -3.7%
- By 2100
- 245,659 · -10.1%
Race, ethnicity, and origin ACS 2023
- Neighborhood character
- Predominantly White (65%)
- Race & ethnicity
- White 65% Black 14% Two or more races 11% Hispanic / Latino 10% Asian 3%
- Hispanic origin (detail)
- Mexican 8%
- Common ancestry
- Romanian 6% Italian 2% Serbian 2%
- Foreign-born
- 8% · Canada, Vietnam
- Languages at home
- 87% English-only · Spanish 7% Tagalog/Filipino 1% Other Indo-European 1%
Political lean MEDSL · St. Joseph
- 2024 margin
- Toss-up / Even · D 50.0% · R 48.5% · Other 1.5%
- 2008→2024 swing
- -15.6pp toward R · 2008: 17.1pp · 2024: 1.5pp
- All cycles
- 2024: D+1.5 2020: D+5.8 2016: D+0.2 2012: D+3.5 2008: D+17.1
Not yet ingested
- Civics
- —
Market trends
- HPI YoY
- ▼ -124.82%
- Current HPI
- 242.1938
- Rent YoY
- ▲ 6.27%
- Metro
- South Bend-Mishawaka, IN-MI
- State GDP YoY
- ▲ 2.90%
- F500 in state
- 18
Industry mix (Fortune 500 HQ in IN)
| Industry | F500 HQs | Revenue |
|---|---|---|
| Industrial Machinery | 2 | $37B |
|
||
| Healthcare | 1 | $177B |
|
||
| Pharmaceuticals | 1 | $45B |
|
||
| Metals / Steel | 1 | $18B |
|
||
| Agriculture | 1 | $17B |
|
||
| Packaging | 1 | $12B |
|
||
Price history
2 events — show timeline
- 2026-05-01 Pending — IRMLS
- 2026-04-28 Listed $187,000 IRMLS
Property tax history
+5.5%/yrLatest (2023): $1,287 · +20.2% YoY. Source: county tax records.
Cash-flow waterfall
monthlySold comps — $/sqft
last 12 mo · ≤1 miLoading sold comps…