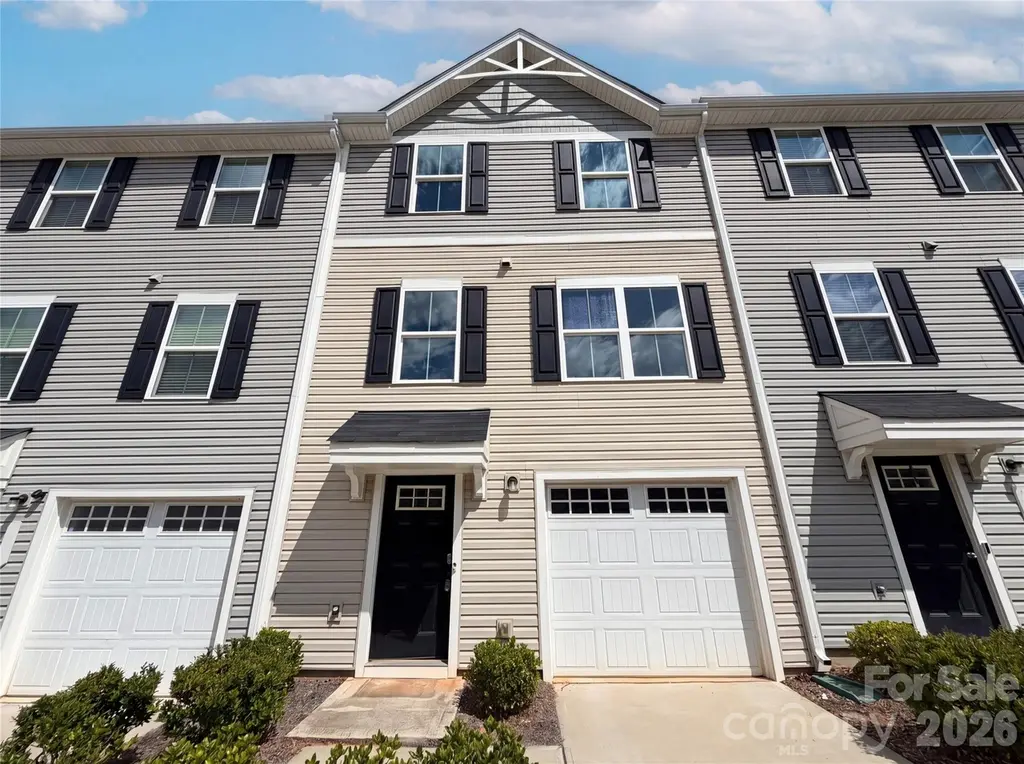
7033 Brightwork Ln · Charlotte, NC
Flood risk 1/10 · Minimal
- FEMA flood zone
- X (unshaded)
- Chance of flooding over 30 yrs
- 0.0%
- Est. flood insurance / yr
- $507 – $1,088
Fire risk 1/10 · Minimal
- Est. fire insurance / yr
- $906 – $1,684
Heat risk 6/10 · Moderate
- Hot days now (above 104°F)
- 7 days/yr
- Hot days in 30 yrs
- 16 days/yr
Wind risk 5/10 · Moderate
- Chance of severe wind over 30 yrs
- 23.0%
Air-quality risk 4/10 · Minor
- Unhealthy air days now
- 4 days/yr
- Unhealthy air days in 30 yrs
- 5 days/yr
Risk factors via First Street. Map © Google.
Why this score? — see what drove the D+ grade
The composite is a weighted blend of 9 inputs, each scored 0–100. Each bar is that input's sub-score; the figure is the points it added to the 100-point composite (weight × sub-score).
- ARV discount +15.0/15.0
- Cash flow +11.2/30.0
- Livability +3.9/5.0
- Schools +3.8/10.0
- 1% rule +3.3/10.0
- DSCR +3.3/10.0
- Rent growth +2.6/5.0
- Condition / age +2.5/5.0
- Appreciation +0.0/10.0
$243,000
🖨 Deal sheet 📄 Offer letter ✓ Due diligence
Listing remarks
Don't miss 7033 Brightwork Ln. , a residence with a straightforward, functional layout designed for ease of use. The residence includes a kitchen island, which provides additional surface area and serves as a central point for meal preparation and various activities within the culinary area. This focal point enhances the utility of the space without compromising accessibility. This home is a testament to functional design and practical living. Included 100-Day Home Warranty with buyer activation
Key facts
- Kitchen island
- $143 HOA
- Garage
Tags
Property features AI
Finance
- HOA & community: Mandatory HOA managed by Superior Management; Monthly association fee of $143
Exterior
- Parking: Attached garage with one garage space; One open parking space; Driveway parking
- Utilities: Public water; Public sewer
- Home design: Residential townhouse; Site-built construction; Three levels
- Construction: Vinyl exterior; Composition roof; Slab foundation
- Exterior features: Concrete and other road surfaces; Publicly maintained road
Interior
- Kitchen: Dishwasher; Electric range; Microwave
- Bedrooms: Three bedrooms (all on upper level)
- Flooring: Carpet; Vinyl
- Bathrooms: Two full bathrooms
- Heating & cooling: Central heating (electric); Central air conditioning
- Interior features: 10 total rooms; Entry level is the 3rd floor
- Laundry & utility: Laundry on upper level
Neighborhood map
What this means for you Summary
Snapshot
- This is a 3-bed/2.5-bath townhouse listed at $243k.
Deal economics
- At list price, monthly cash flow is $-94 ($-1k/yr) — negative.
- To cash-flow at today's rent, offer at most $226k (6.9% below list).
- To meet the 1% rule (rent ≥ 1% of price), the offer needs to be $202k (16.7% below list).
- Recommended offer: $202k (16.7% below list) — sets the bar for 1% rule.
- Cap rate 5.8% vs local median 3.1% in Charlotte — top-decile yield for the area; either an underpriced asset or a hidden risk that comps aren't pricing in. Stress-test before assuming the spread holds.
Location & tenants
- Location reads 78/100 on livability (#26 in NC, #2,502 nationally) — a middle-class / working-renter tenant base. Strengths: amenities A+, commute A+, housing A+; Watch: crime F.
- Charlotte-Mecklenburg Schools (urban): math 42% / reading 46% proficiency, ranked #85 of 178 in NC (top 48%) — families likely to look elsewhere, expect single-tenant / working-renter base with shorter leases.
- Zoned schools: Statesville Road Elementary (math 12% / reading 21%, grade F, #1,307 of 1,410 statewide, top 93%, 456 students, 99% FRL); West Charlotte High School (math 33% / reading 34%, grade F, #436 of 535 statewide, top 82%, 1,538 students, 100% FRL) — zoned schools average 100% FRL vs 49% district-wide (51 pts higher); higher-poverty schools than district average — tighter screening recommended.
- Zoned-school proficiency averages 25% at this address vs 44% district-wide (-19 pts) — the specific schools serving this property underperform the Charlotte-Mecklenburg Schools average; the district grade overstates school quality for this exact location.
- Market conditions: Rents flat; 569 active listings in the ZIP; 23 comparable units currently listed for rent nearby; rentals at typical pace (median 16d on market — plan ~3-4 weeks tenant-placement turnaround); solid renter incomes; 11,969 units permitted in Mecklenburg County in 2024 (5,377 in 5+ unit buildings).
Forward outlook
- Local home prices are declining (-3.0%/yr); year-one equity from $2k of loan paydown is wiped out by about $7k of value loss. Plan a longer hold.
- Mecklenburg County population projected at +53% by 2050 — long-run rental-demand tailwind backs the buy-and-hold thesis.
Negotiation context
- It's been on market 61 days — a 6% lower offer ($228k) is reasonable based on typical stale-listing flexibility.
- 2 sale attempts; this cycle's ask has dropped $42k (15%) from the opening price — seller is motivated, your offer sets the floor, not the list.
Risks & watch-outs
- Climate carrying-cost: moderate wind risk, 23% chance of damaging wind over 30y; extreme-heat days projected 7→16/yr by 2055 (HVAC capex compounding) — expect insurance premiums to compound above CPI over the hold.
Questions for the listing agent
- What do current leases actually rent for vs. the listed asking? Can we see a recent rent roll and the last 12 months of T-12 income?
- It's been on market 61 days. Have you received any prior offers? Is the seller open to a 17% concession, seller financing, or rate buy-down credit?
- What does the HOA fee cover, when was the last increase, and are there any pending special assessments or reserve-fund shortfalls?
- Why hasn't it sold? Are there any deal-killer items the seller is aware of (foundation, flood, title, zoning, code violations)?
- Is there a deadline driving the sale (1031 exchange, divorce, estate, relocation)? That informs how much negotiation room exists.
- Schools are D-rated, which usually means shorter tenancies and higher turnover. Who's the typical renter profile here, and what's been the actual vacancy rate?
- Crime grade is F in this area — have there been break-ins, vandalism, or insurance claims at this property in the last 3 years? What carrier currently insures it and at what premium?
- The area grade is low — what's the realistic commute time and amenity access for the typical tenant pool here? Any planned neighborhood developments (good or bad) we should know about?
- What's the average days-on-market for RENTAL listings here right now (not sales)? A rising rental-DOM trend means longer vacancies and softer asking-rent achievability than the comps imply.
- What's the recent tenant-quality profile in this submarket — average credit score on applications, eviction rate, late-payment / NSF rate, and stable-employment percentage? A property-management company in the area should have these aggregated.
- How much new for-sale + rental construction is in the pipeline within 1–3 miles? Heavy new supply typically softens prices + rents 12–24 months out; constrained supply supports both.
Investment metrics
- 1% rule
- 0.83% ✗
- Cap rate
- 5.83%
- Cash-on-cash
- -1.66%
- DSCR
- 0.93
- GRM
- 10.0
CMA / ARV
- ARV (on-the-fly)
- $301,056
- Comps found
- 12
Show comp detail 12 sales within ~0.75 mi
| Address | Dist | Beds/Ba | Sqft | Sold | Price | $/sf | Match |
|---|---|---|---|---|---|---|---|
| 6109 Carrick Bend Ct | 0.24mi | 3/2.5 | 1,576 (+0%) | 1mo | $291,000 | $185 | 88 |
| 7012 Capstan Ter | 0.20mi | 3/2.5 | 1,576 (+0%) | 5mo | $288,000 | $183 | 85 |
| 8013 Sinnet Pl | 0.25mi | 3/2.5 | 1,576 (+0%) | 4mo | $285,000 | $181 | 84 |
| 7118 Capstan Ter | 0.24mi | 3/2.5 | 1,567 (-0%) | 6mo | $302,045 | $193 | 84 |
| 8021 Sinnet Pl | 0.24mi | 3/2.5 | 1,567 (-0%) | 7mo | $302,000 | $193 | 83 |
| 8027 Sinnet Pl | 0.23mi | 3/2.5 | 1,567 (-0%) | 8mo | $301,500 | $192 | 82 |
| 8009 Sinnet Pl | 0.25mi | 3/2.5 | 1,576 (+0%) | 7mo | $295,765 | $188 | 82 |
| 8035 Sinnet Pl | 0.23mi | 3/2.5 | 1,576 (+0%) | 9mo | $295,070 | $187 | 81 |
| 7133 Capstan Ter | 0.26mi | 3/2.5 | 1,576 (+0%) | 7mo | $276,000 | $175 | 81 |
| 2046 Mcdonald Dr | 0.56mi | 3/2.5 | 1,540 (-2%) | 1mo | $325,000 | $211 | 70 |
| 2013 Mcdonald Dr | 0.55mi | 3/2.5 | 1,551 (-1%) | 8mo | $299,500 | $193 | 66 |
| 2017 Mcdonald Dr | 0.56mi | 3/2.5 | 1,551 (-1%) | 8mo | $299,700 | $193 | 65 |
Match score weights: distance 35% · size 25% · config 20% · recency 20%. Top-matched comps best support the ARV.
Projected returns pro-forma
-3.0% appreciation · 0.43% rent growth · sell at horizon
- IRR
- -22.0%
- Equity multiple
- 0.26×
- Total profit
- $-50,447
- Equity at exit
- $36,232
- IRR
- -23.8%
- Equity multiple
- -0.05×
- Total profit
- $-71,390
- Equity at exit
- $21,010
Cash invested: $68,040 (down + closing). Projections, not guarantees.
Landlord ↔ Tenant lean methodology
- Overall (STATE)
- 85 Strongly Landlord-Friendly
- State North Carolina
- 85 Strongly Landlord-Friendly · R+3
- County
- — inherits STATE
- City
- — inherits STATE
ZIP-level market 28269
- Home prices YoY
- -19.9%
- Rents YoY
- 0.4%
- Active inventory
- 569
- Price-to-rent
- 10.0×
Monthly cashflow live
- Estimated rent
- $2,023 high interval (Pro) →
- Mortgage (P&I)
- −$1,274
- Tax from tax record
- −$174 /mo · $2,091/yr
- Insurance
- −$101
- HOA
- −$143
- Vacancy / Maint / Mgmt
- −$425
- Net cashflow
- $-94
Break-even live
UW: 25.0% down · 7.5% · 30yr · 1.5% tax · 5.0% vac · 8.0% maint · 8.0% mgmt
Financing live
Cash to close
- Down payment
- $60,750
- Closing costs
- $7,290
- Reserves months
- —
- Total cash needed
- —
Loan-product check · same deal, 3 products live
Conventional
25% down · 7.5% · 30yr
- Down + closing
- —
- Monthly P&I
- —
- Monthly cashflow
- —
- DSCR
- —
- Eligible?
- —
Personal DTI + credit; lowest rate.
DSCR
20% down · 8.5% · 30yr
- Down + closing
- —
- Monthly P&I
- —
- Monthly cashflow
- —
- DSCR
- —
- Eligible?
- —
No personal income docs; deal must DSCR.
Hard money
10% down · 12.0% · 12mo
- Down + closing
- —
- Monthly P&I
- —
- Monthly cashflow
- —
- DSCR
- —
- Eligible?
- —
Short-term bridge; refi at stabilization.
Rent comps 23 comps
| Address | Beds | Baths | Sqft | Rent | $/sqft | DOM | Units | Dist |
|---|---|---|---|---|---|---|---|---|
| 8036 Lanyard Ter Charlotte, NC | 3.0 | 2.5 | 1591 | $1,900 | $1.19 | 11d | 1 | 0.03mi |
| 8036 Lanyard Ter Unit 1 Charlotte, NC | 3.0 | 2.0 | 1568 | $1,900 | $1.21 | 10d | 1 | 0.03mi |
| 5044 Downhaul Dr Charlotte, NC | 4.0 | 2.5 | 2128 | $2,500 | $1.17 | 16d | 1 | 0.10mi |
| 2409 Fathom Way Charlotte, NC | 3.0 | 2.5 | 1565 | $1,699 | $1.09 | 23d | 1 | 0.10mi |
| 7024 Capstan Ter Charlotte, NC | 3.0 | 2.5 | 1567 | $2,150 | $1.37 | 16d | 1 | 0.21mi |
| 6126 Carrick Bend Ct Unit 1 Charlotte, NC | 3.0 | 2.5 | 1576 | $1,989 | $1.26 | 23d | 1 | 0.25mi |
| 6126 Carrick Bend Ct Charlotte, NC | 3.0 | 2.5 | 1576 | $1,989 | $1.26 | 7d | 1 | 0.25mi |
| 6126 Carrick Bend Ct Unit 1 Charlotte, NC | 3.0 | 2.5 | 1576 | $1,985 | $1.26 | 7d | 1 | 0.25mi |
| 7132 Capstan Ter Charlotte, NC | 3.0 | 2.0 | 1700 | $1,995 | $1.17 | 23d | 1 | 0.26mi |
| 6145 Carrick Bend Ct Charlotte, NC | 3.0 | 2.5 | 1520 | $2,200 | $1.45 | 23d | 1 | 0.27mi |
| 1917 Butterfly Ln Charlotte, NC | 3.0 | 2.0 | 1579 | $1,750 | $1.11 | 23d | 1 | 0.31mi |
| 1840 Juniper Dr Charlotte, NC | 4.0 | 2.5 | 1930 | $2,150 | $1.11 | 16d | 1 | 0.33mi |
| 2315 Portola Ct Charlotte, NC | 4.0 | 2.5 | 1759 | $2,100 | $1.19 | 21d | 1 | 0.41mi |
| 5313 Abbywood Ln Charlotte, NC | 3.0 | 2.0 | 1120 | $1,650 | $1.47 | 16d | 1 | 0.49mi |
| 3107 Meadow Knoll Dr Charlotte, NC | 3.0 | 2.5 | 1577 | $2,100 | $1.33 | 23d | 1 | 0.50mi |
| 2308 Juniper Dr Charlotte, NC | 4.0 | 2.5 | 1305 | $1,799 | $1.38 | 16d | 1 | 0.59mi |
| 6202 Suntrace Way Charlotte, NC | 3.0 | 2.0 | 1185 | $1,965 | $1.66 | 4d | 1 | 0.66mi |
| 5823 Hamilton Oaks Dr Charlotte, NC | 3.0 | 2.0 | 1074 | $1,640 | $1.53 | 4d | 1 | 1.03mi |
| 3801 Davis Ln Charlotte, NC | 3.0 | 2.0 | 1160 | $1,815 | $1.56 | 2d | 1 | 1.05mi |
| 3510 Cypress Pond Dr Charlotte, NC | 3.0 | 1.0 | 1098 | $1,700 | $1.55 | 23d | 1 | 1.19mi |
| 4920 Tanager Park Dr Charlotte, NC | 3.0 | 1.0–2.0 | 844 | $1,674 | $1.98 | 1d | 80 | 1.38mi |
| 412 Bent Leaf Ct Charlotte, NC | 3.0 | 2.5 | 1300 | $1,789 | $1.38 | 7d | 1 | 1.42mi |
| 3310 Bell Glen Ct Charlotte, NC | 3.0 | 2.0 | 1294 | $1,845 | $1.43 | 13d | 1 | 1.45mi |
HOA detail
- Monthly dues
- $143 · $1,716/yr
Listing history 18 events
-
2026-06-15status $243,000 Pending 61 DOM
-
2026-06-15days on market $243,000 Active 61 DOM
-
2026-06-13pricedays on market $243,000 Active 59 DOM
-
2026-06-10days on market $255,000 Active 55 DOM
-
2026-06-08days on market $255,000 Active 54 DOM
-
2026-06-07days on market $255,000 Active 53 DOM
-
2026-06-04days on market $255,000 Active 50 DOM
-
2026-06-03days on market $255,000 Active 49 DOM
-
2026-06-02days on market $255,000 Active 48 DOM
-
2026-06-02days on market $255,000 Active 47 DOM
-
2026-05-31days on market $255,000 Active 46 DOM
-
2026-05-14price $270,000
-
2026-04-30price $280,000
-
2026-04-15$285,000 Active
-
2026-04-02soldstatus $285,000
-
2025-10-07price $275,000
-
2025-09-15$280,000 Active
-
2020-10-19soldstatus $245,000
ⓘ Source: listings_history table (triggers on properties + properties_extension) + one-shot
backfill from property_details.listing_events for pre-trigger history.
Tax reassessment forecast NC · Resets to sale price
- Current annual tax
- $2,091 · $174/mo
- Projected year-2 tax
- $2,091 · $174/mo
- Expected delta
- $0/yr ($0/mo · 0.0%)
ⓘ Screening estimate from a state-policy table — verify with the county assessor before closing.
Climate risk First Street
- Flood 1/10 Low FEMA zone X (unshaded) · 0% chance over 30 yrs
- Wildfire 1/10 Low
- Heat 6/10 Major 7 d/yr ≥104°F today · 16 d/yr by 30 yrs out
- Wind 5/10 Major 23% chance of damaging wind over 30 yrs
- Air quality 4/10 Moderate 4 unhealthy d/yr today · 5 by 30 yrs out
Nearby sold comps map
Loading sold comps map…
Walkable amenities ~0.75 mi
Loading nearby amenities…
Taxation est. · year 1
- Rental income
- $24,281
- − Mortgage interest
- −$13,612
- − Property taxes
- −$2,091
- − Insurance
- −$1,215
- − Repairs & maintenance
- −$1,942
- − Management
- −$1,942
- − HOA
- −$1,716
- − Depreciation
- −$7,069
- Taxable loss
- −$5,307
- Est. tax savings @ 24.0%
- +$1,274
- After-tax cash flow
- $142/yr
For passive investors: Depreciation is non-cash, so a rental often shows a tax loss while cash-flowing — sheltering income. Rental losses are passive: they offset passive income freely, and up to $25,000/yr can offset ordinary (W-2) income if you actively participate and your MAGI is under $100k (phasing out to $0 by $150k); unused losses carry forward. On sale, claimed depreciation is recaptured at up to 25%, and gains may owe capital-gains tax (a 1031 exchange can defer both). Figures are a year-1 estimate at your 24.0% rate — not tax advice; consult a CPA.
Schools (NCES district)
- District
- Charlotte-Mecklenburg Schools
- NCES district ID
- 3702970
- Math proficiency
- 42% ▼ -6.00%
- Reading proficiency
- 46% ▲ 1.00%
- Median HH income
- $57,175
- Composite
- 38.49/100
- National rank
- #4183
- State rank
- #85 of 178 in NC
Livability — Charlotte
- Score
- 78/100
- State rank
- #26
- US rank
- #2502
Category grades
Schools grade is shown separately in the Schools card above.
Census & demographics
- Census place
- Charlotte, NC
- County
- Mecklenburg County · 1,167,319 people
- City population
- 920,422
- Metro
- Charlotte-Concord-Gastonia, NC-SC
- Population (ZIP)
- 79,586
- Household income
- $81,517
- Rent vs Own
- Severe rent burden
- 2818.0
Population outlook (Mecklenburg County) Hauer SSP2
- Today (2025)
- 1,305,740 people
- By 2030
- 1,442,752 · +10.5%
- By 2040
- 1,722,441 · +31.9%
- By 2050
- 1,999,450 · +53.1%
- By 2075
- 2,642,495 · +102.4%
- By 2100
- 3,106,755 · +137.9%
Race, ethnicity, and origin ACS 2023
- Neighborhood character
- Diverse neighborhood (Simpson 0.66)
- Race & ethnicity
- Black 50% White 27% Hispanic / Latino 15% Two or more races 5% Asian 5%
- Hispanic origin (detail)
- Mexican 6% Puerto Rican 1%
- Common ancestry
- Slovak 1% Serbian 1% Romanian 1%
- Foreign-born
- 15% · Canada, Jamaica, Vietnam
- Languages at home
- 79% English-only · Spanish 13% French/Haitian/Cajun 2% Other Asian/Pacific 2%
Political lean MEDSL · Mecklenburg
- 2024 margin
- Solid D (+32.9) · D 65.6% · R 32.7% · Other 1.6%
- 2008→2024 swing
- +8.5pp toward D · 2008: 24.4pp · 2024: 32.9pp
- All cycles
- 2024: D+32.9 2020: D+35.1 2016: D+29.9 2012: D+22.5 2008: D+24.4
Not yet ingested
- Civics
- —
Market trends
- HPI YoY
- ▼ -62.04%
- Current HPI
- 249.6732
- Rent YoY
- ▲ 0.43%
- Metro
- Charlotte-Concord-Gastonia, NC-SC
- State GDP YoY
- ▲ 3.28%
- F500 in state
- 26
Industry mix (Fortune 500 HQ in NC)
| Industry | F500 HQs | Revenue |
|---|---|---|
| Financial Services | 2 | $213B |
|
||
| Retail | 2 | $95B |
|
||
| Industrial Conglomerate | 1 | $38B |
|
||
| Metals / Steel | 1 | $35B |
|
||
| Utilities | 1 | $30B |
|
||
| Industrial Machinery | 1 | $19B |
|
||
Price history
+10.2% since first listed7 events — show timeline
- 2026-05-14 Price Changed $270,000 CANOPYMLS as Distributed by MLS Grid
- 2026-04-30 Price Changed $280,000 CANOPYMLS as Distributed by MLS Grid
- 2026-04-15 Listed $285,000 CANOPYMLS as Distributed by MLS Grid
- 2026-04-02 Sold (Public Records) $285,000 Public Records
- 2025-10-07 Price Changed $275,000 CANOPYMLS as Distributed by MLS Grid
- 2025-09-15 Listed $280,000 CANOPYMLS as Distributed by MLS Grid
- 2020-10-19 Sold (Public Records) $245,000 Public Records
Property tax history
+32.3%/yrLatest (2025): $2,091 · +1.5% YoY. Source: county tax records.
Cash-flow waterfall
monthlySold comps — $/sqft
last 12 mo · ≤1 miLoading sold comps…