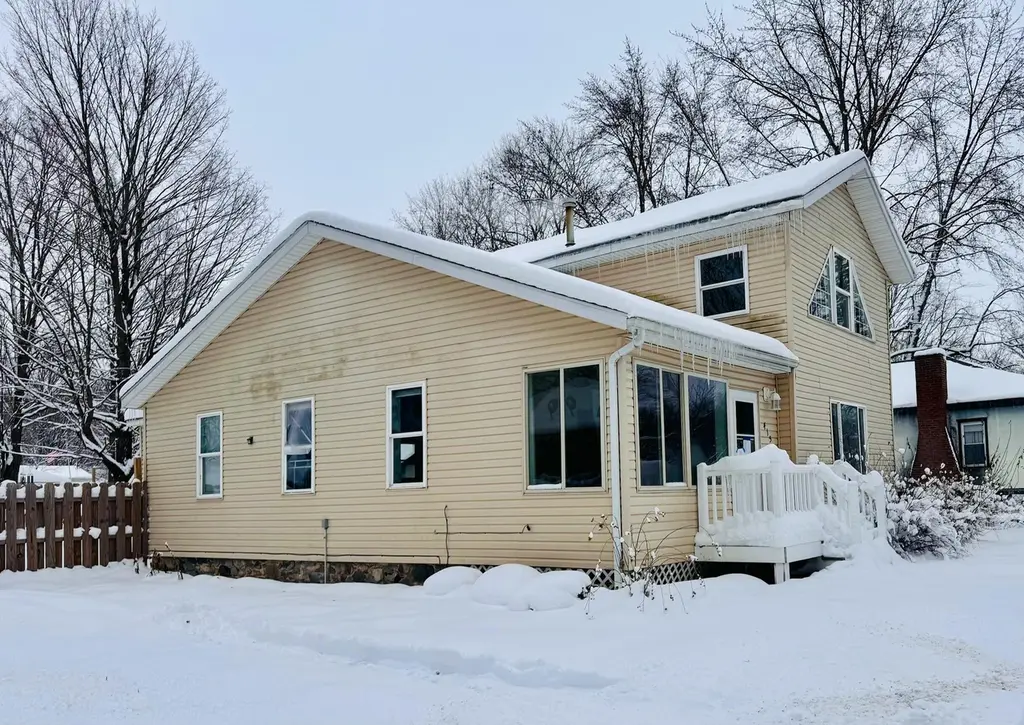
415 S Main St · Antwerp, MI
Flood risk 1/10 · Minimal
- FEMA flood zone
- X (unshaded)
- Chance of flooding over 30 yrs
- 0.0%
- Est. flood insurance / yr
- $473 – $860
Fire risk 2/10 · Minimal
- Est. fire insurance / yr
- $784 – $1,456
Heat risk 2/10 · Minimal
- Hot days now (above 99°F)
- 7 days/yr
- Hot days in 30 yrs
- 16 days/yr
Wind risk 2/10 · Minimal
- Chance of severe wind over 30 yrs
- —
Air-quality risk 3/10 · Minor
- Unhealthy air days now
- 2 days/yr
- Unhealthy air days in 30 yrs
- 4 days/yr
Risk factors via First Street. Map © Google.
Why this score? — see what drove the B- grade
The composite is a weighted blend of 9 inputs, each scored 0–100. Each bar is that input's sub-score; the figure is the points it added to the 100-point composite (weight × sub-score).
- Cash flow +27.5/30.0
- ARV discount +11.5/15.0
- DSCR +9.6/10.0
- 1% rule +7.0/10.0
- Schools +3.1/10.0
- Rent growth +2.5/5.0
- Livability +2.5/5.0
- Condition / age +2.5/5.0
- Appreciation +0.0/10.0
$190,000
🖨 Deal sheet 📄 Offer letter ✓ Due diligence
Listing remarks MLS
Updated 2 bed / 1 bath home in historic downtown Lawton close to restaurants & shopping. Fenced in backyard with storage shed. Newer water heater & appliances. SHORT SALE POSSIBLE.
Key facts
- Fenced in backyard
- Storage shed
- 0.33 acre lot
Tags
Neighborhood map
What this means for you Summary
Snapshot
- This is a 3-bed/2.0-bath single-family listed at $190k.
Deal economics
- At list price, monthly cash flow is $560 ($7k/yr) — positive.
- The deal already cash-flows at list — no discount required.
- Meets the 1% rule at list price ($2k rent vs $190k).
- Recommended offer: $167k (12.0% below list) — sets the bar for market timing.
Location & tenants
- Location reads: area grade B — affects rentability + tenant quality, not the cash-flow math above.
- Lawton Community School District (rural): math 27% / reading 45% proficiency, ranked #263 of 540 in MI (top 49%) — families likely to look elsewhere, expect single-tenant / working-renter base with shorter leases.
- Market conditions: 32 active listings in the ZIP; 165 units permitted in Van Buren County in 2024 (0 in 5+ unit buildings).
Forward outlook
- Local home prices are declining (-3.0%/yr); year-one equity from $1k of loan paydown is wiped out by about $6k of value loss. Plan a longer hold.
- Van Buren County population projected at -23% by 2050 — secular population decline; favor cash flow + early exit over multi-decade hold.
- At projected returns (-3.0% appreciation + 3.0% rent growth), your $53k cash investment doubles in ~9 years — after that, you're playing with house money.
Negotiation context
- It's been on market 190 days — a 12% lower offer ($167k) is reasonable based on typical stale-listing flexibility.
- 18 sale attempts since 19y ago with the ask held roughly flat each time — persistent listings suggest the price (not the market) is what's stuck; bring a comps-based counter.
Risks & watch-outs
- Watch-outs: built in 1920 — expect roof / HVAC / electrical / plumbing capex.
Questions for the listing agent
- It's been on market 190 days. Have you received any prior offers? Is the seller open to a 12% concession, seller financing, or rate buy-down credit?
- Built in 1920 — when were the roof, HVAC, electrical panel, plumbing, and water heater last replaced?
- Why hasn't it sold? Are there any deal-killer items the seller is aware of (foundation, flood, title, zoning, code violations)?
- Is there a deadline driving the sale (1031 exchange, divorce, estate, relocation)? That informs how much negotiation room exists.
- What's the average days-on-market for RENTAL listings here right now (not sales)? A rising rental-DOM trend means longer vacancies and softer asking-rent achievability than the comps imply.
- What's the recent tenant-quality profile in this submarket — average credit score on applications, eviction rate, late-payment / NSF rate, and stable-employment percentage? A property-management company in the area should have these aggregated.
- How much new for-sale + rental construction is in the pipeline within 1–3 miles? Heavy new supply typically softens prices + rents 12–24 months out; constrained supply supports both.
Investment metrics
- 1% rule
- 1.20% ✓
- Cap rate
- 9.83%
- Cash-on-cash
- 12.64%
- DSCR
- 1.56
- GRM
- 7.0
CMA / ARV
- ARV (median comp)
- $208,589
- List price
- $190,000
- Delta
- -8.91%
- Verdict
- FAIR
- Comps
- 20 within 1.0 mi
Show comp detail 12 sales within ~0.75 mi
| Address | Dist | Beds/Ba | Sqft | Sold | Price | $/sf | Match |
|---|---|---|---|---|---|---|---|
| 402 Durkee St | 0.15mi | 3/1.0 | 1,404 (+3%) | 7mo | $261,000 | $186 | 78 |
| 238 Harvey St | 0.29mi | 4/3.0 (+1) | 1,384 (+2%) | 1mo | $260,000 | $188 | 74 |
| 604 E 2nd St | 0.44mi | 3/1.0 | 1,350 (-1%) | 4mo | $162,000 | $120 | 71 |
| 601 S Nursery St | 0.36mi | 3/1.5 | 1,373 (+1%) | 13mo | $250,000 | $182 | 69 |
| 432 S Main St | 0.04mi | 3/1.0 | 1,560 (+15%) | 9mo | $200,000 | $128 | 62 |
| 806 E 3rd St | 0.51mi | 3/2.0 | 1,440 (+6%) | 6mo | $238,000 | $165 | 61 |
| 606 E 2nd St | 0.45mi | 4/1.0 (+1) | 1,392 (+2%) | 9mo | $230,000 | $165 | 58 |
| 405 E Bitely St | 0.17mi | 2/1.0 (-1) | 1,205 (-11%) | 8mo | $226,000 | $188 | 58 |
| 117 S Adams St | 0.29mi | 3/1.5 | 1,156 (-15%) | 5mo | $195,000 | $169 | 55 |
| 727 E 2nd St | 0.54mi | 2/2.0 (-1) | 1,333 (-2%) | 14mo | $250,000 | $188 | 55 |
| 106 N Quincy St | 0.58mi | 3/1.0 | 1,208 (-11%) | 2mo | $165,013 | $137 | 48 |
| 319 Union St | 0.35mi | 4/1.0 (+1) | 1,456 (+7%) | 23mo | $200,000 | $137 | 44 |
Match score weights: distance 35% · size 25% · config 20% · recency 20%. Top-matched comps best support the ARV.
Projected returns pro-forma
-3.0% appreciation · 3.0% rent growth · sell at horizon
- IRR
- 2.4%
- Equity multiple
- 1.09×
- Total profit
- $4,884
- Equity at exit
- $28,330
- IRR
- 12.0%
- Equity multiple
- 1.94×
- Total profit
- $50,152
- Equity at exit
- $16,428
Cash invested: $53,200 (down + closing). Projections, not guarantees.
Landlord ↔ Tenant lean methodology
- Overall (STATE)
- 62 Landlord-Friendly
- State Michigan
- 62 Landlord-Friendly · EVEN
- County
- — inherits STATE
- City
- — inherits STATE
ZIP-level market 49065
- Active inventory
- 32
- Price-to-rent
- 7.0×
Monthly cashflow live
- Estimated rent
- $2,275 medium interval (Pro) →
- Mortgage (P&I)
- −$996
- Tax from tax record
- −$161 /mo · $1,937/yr
- Insurance
- −$79
- HOA
- −$0
- Vacancy / Maint / Mgmt
- −$478
- Net cashflow
- $560
Break-even live
UW: 25.0% down · 7.5% · 30yr · 1.5% tax · 5.0% vac · 8.0% maint · 8.0% mgmt
Financing live
Cash to close
- Down payment
- $47,500
- Closing costs
- $5,700
- Reserves months
- —
- Total cash needed
- —
Loan-product check · same deal, 3 products live
Conventional
25% down · 7.5% · 30yr
- Down + closing
- —
- Monthly P&I
- —
- Monthly cashflow
- —
- DSCR
- —
- Eligible?
- —
Personal DTI + credit; lowest rate.
DSCR
20% down · 8.5% · 30yr
- Down + closing
- —
- Monthly P&I
- —
- Monthly cashflow
- —
- DSCR
- —
- Eligible?
- —
No personal income docs; deal must DSCR.
Hard money
10% down · 12.0% · 12mo
- Down + closing
- —
- Monthly P&I
- —
- Monthly cashflow
- —
- DSCR
- —
- Eligible?
- —
Short-term bridge; refi at stabilization.
Listing history 50 events
-
2026-06-18days on market $190,000 Active 190 DOM
-
2026-06-17days on market $190,000 Active 189 DOM
-
2026-06-16days on market $190,000 Active 188 DOM
-
2026-06-15days on market $190,000 Active 187 DOM
-
2026-06-13days on market $190,000 Active 185 DOM
-
2026-06-12days on market $190,000 Active 184 DOM
-
2026-06-09days on market $190,000 Active 181 DOM
-
2026-06-08days on market $190,000 Active 180 DOM
-
2026-06-07days on market $190,000 Active 179 DOM
-
2026-06-05days on market $190,000 Active 177 DOM
-
2026-06-04days on market $190,000 Active 175 DOM
-
2026-06-02days on market $190,000 Active 174 DOM
-
2026-06-01days on market $190,000 Active 173 DOM
-
2026-05-31days on market $190,000 Active 172 DOM
-
2026-05-31days on market $190,000 Active 171 DOM
-
2025-12-24price $190,000 192-char remark
Show marketing remark (192 chars)
Updated 2 bed / 1 bath home in historic downtown Lawton close to restaurants & shopping. Fenced in backyard with storage shed. Newer water heater & appliances. SHORT SALE POSSIBLE.
-
2025-12-23price $190,000 192-char remark
Show marketing remark (192 chars)
Updated 2 bed / 1 bath home in historic downtown Lawton close to restaurants & shopping. Fenced in backyard with storage shed. Newer water heater & appliances. SHORT SALE POSSIBLE.
-
2025-12-23price $190,000
Show marketing remark (192 chars)
Updated 2 bed / 1 bath home in historic downtown Lawton close to restaurants & shopping. Fenced in backyard with storage shed. Newer water heater & appliances. SHORT SALE POSSIBLE.
-
2025-12-10$198,000 Active 192-char remark
Show marketing remark (192 chars)
Updated 2 bed / 1 bath home in historic downtown Lawton close to restaurants & shopping. Fenced in backyard with storage shed. Newer water heater & appliances. SHORT SALE POSSIBLE.
-
2025-12-10$198,000 Active 192-char remark
Show marketing remark (192 chars)
Updated 2 bed / 1 bath home in historic downtown Lawton close to restaurants & shopping. Fenced in backyard with storage shed. Newer water heater & appliances. SHORT SALE POSSIBLE.
-
2025-12-10$198,000 Active
Show marketing remark (192 chars)
Updated 2 bed / 1 bath home in historic downtown Lawton close to restaurants & shopping. Fenced in backyard with storage shed. Newer water heater & appliances. SHORT SALE POSSIBLE.
-
2025-11-21historical
-
2025-11-21historical
-
2025-09-15price $205,000
-
2025-09-15price $205,000
-
2025-09-15price $205,000
-
2025-07-21$215,000 Active
-
2025-07-21$215,000 Active
-
2024-05-28soldstatus $190,000
-
2024-05-17soldstatus $190,000 Sold
-
2024-05-17soldstatus $190,000 Closed
-
2024-05-17soldstatus $190,000 Sold
-
2024-04-09historical Accepting Backup Offers
-
2024-04-09historical Accepting Backup Offers
-
2024-04-09historical Active - Backup Offers Accepted
-
2024-04-06$192,500 Active
-
2024-04-06$192,500 Active
-
2024-04-06$192,500 Active
-
2022-05-25historical
-
2014-09-27historical
-
2014-09-27historical
-
2012-05-21soldstatus $35,500
-
2012-05-21soldstatus $35,500
-
2012-03-21$39,000
-
2012-03-21$39,000
-
2011-03-14historical
-
2010-09-14$95,000
-
2010-09-14$95,000
-
2009-03-24soldstatus $95,000
-
2009-03-20soldstatus $100,000
ⓘ Source: listings_history table (triggers on properties + properties_extension) + one-shot
backfill from property_details.listing_events for pre-trigger history.
Tax reassessment forecast MI · Partial reset (capped growth)
- Current annual tax
- $1,937 · $161/mo
- Projected year-2 tax
- $2,432 · $203/mo
- Expected delta
- +$494/yr (+$41/mo · 25.5%)
ⓘ Screening estimate from a state-policy table — verify with the county assessor before closing.
Climate risk First Street
- Flood 1/10 Low FEMA zone X (unshaded) · 0% chance over 30 yrs
- Wildfire 2/10 Low
- Heat 2/10 Low 7 d/yr ≥99°F today · 16 d/yr by 30 yrs out
- Wind 2/10 Low
- Air quality 3/10 Moderate 2 unhealthy d/yr today · 4 by 30 yrs out
Nearby sold comps map
Loading sold comps map…
Walkable amenities ~0.75 mi
Loading nearby amenities…
Taxation est. · year 1
- Rental income
- $27,300
- − Mortgage interest
- −$10,643
- − Property taxes
- −$1,937
- − Insurance
- −$950
- − Repairs & maintenance
- −$2,184
- − Management
- −$2,184
- − Depreciation
- −$5,527
- Taxable income
- $3,875
- Est. tax owed @ 24.0%
- −$930
- After-tax cash flow
- $5,793/yr
For passive investors: Depreciation is non-cash, so a rental often shows a tax loss while cash-flowing — sheltering income. Rental losses are passive: they offset passive income freely, and up to $25,000/yr can offset ordinary (W-2) income if you actively participate and your MAGI is under $100k (phasing out to $0 by $150k); unused losses carry forward. On sale, claimed depreciation is recaptured at up to 25%, and gains may owe capital-gains tax (a 1031 exchange can defer both). Figures are a year-1 estimate at your 24.0% rate — not tax advice; consult a CPA.
Schools (NCES district)
- District
- Lawton Community School District
- NCES district ID
- 2621240
- Math proficiency
- 27% ▼ -9.00%
- Reading proficiency
- 45% ▼ -3.00%
- Median HH income
- $49,315
- Composite
- 31.04/100
- National rank
- #6084
- State rank
- #263 of 540 in MI
Livability — Antwerp
No livability data for this city. (Only ~50 U.S. cities are tracked.)
Census & demographics
- Census place
- Lawton, MI
- Population (ZIP)
- 7,283
Population outlook (Van Buren County) Hauer SSP2
- Today (2025)
- 71,479 people
- By 2030
- 68,693 · -3.9%
- By 2040
- 62,093 · -13.1%
- By 2050
- 55,232 · -22.7%
- By 2075
- 40,786 · -42.9%
- By 2100
- 27,785 · -61.1%
Race, ethnicity, and origin ACS 2023
- Neighborhood character
- Predominantly White (90%)
- Race & ethnicity
- White 90% Two or more races 6% Hispanic / Latino 4%
- Common ancestry
- Romanian 8% Iranian 6% Lithuanian 2%
- Foreign-born
- 1% · Canada, South Korea
- Languages at home
- 98% English-only · Spanish 2%
Political lean MEDSL · Van Buren
- 2024 margin
- R (+15.1) · D 41.7% · R 56.9% · Other 1.4%
- 2008→2024 swing
- -23.9pp toward R · 2008: 8.8pp · 2024: -15.1pp
- All cycles
- 2024: R+15.1 2020: R+12.3 2016: R+13.9 2012: D+0.5 2008: D+8.8
Not yet ingested
- Civics
- —
Market trends
- HPI YoY
- ▼ -162.97%
- Current HPI
- 165.0761
- Rent YoY
- —
- Metro
- —
- State GDP YoY
- ▲ 1.37%
- F500 in state
- 28
Industry mix (Fortune 500 HQ in MI)
| Industry | F500 HQs | Revenue |
|---|---|---|
| Automotive Parts | 3 | $48B |
|
||
| Automotive | 2 | $372B |
|
||
| Chemicals | 1 | $45B |
|
||
| Automotive Retail | 1 | $29B |
|
||
| Healthcare / Medical Devices | 1 | $23B |
|
||
| Automotive Technology | 1 | $20B |
|
||
Price history
+192.3% since first listed44 events — show timeline
- 2025-12-24 Price Changed $190,000 MiRealSource-MiMLS
- 2025-12-23 Price Changed $190,000 REALCOMP
- 2025-12-23 Price Changed $190,000 SW Michigan MLS
- 2025-12-10 Listed $198,000 REALCOMP
- 2025-12-10 Listed $198,000 SW Michigan MLS
- 2025-12-10 Listed $198,000 MiRealSource-MiMLS
- 2025-11-21 Listing Removed — REALCOMP
- 2025-11-21 Listing Removed — MiRealSource-MiMLS
- 2025-09-15 Price Changed $205,000 MiRealSource-MiMLS
- 2025-09-15 Price Changed $205,000 REALCOMP
- 2025-09-15 Price Changed $205,000 SW Michigan MLS
- 2025-07-21 Listed $215,000 REALCOMP
- 2025-07-21 Listed $215,000 MiRealSource-MiMLS
- 2024-05-28 Sold (Public Records) $190,000 Public Records
- 2024-05-17 Sold (MLS) $190,000 SW Michigan MLS
- 2024-05-17 Sold (MLS) $190,000 MiRealSource-MiMLS
- 2024-05-17 Sold (MLS) $190,000 REALCOMP
- 2024-04-09 Contingent — REALCOMP
- 2024-04-09 Contingent — MiRealSource-MiMLS
- 2024-04-09 Contingent — SW Michigan MLS
- 2024-04-06 Listed $192,500 SW Michigan MLS
- 2024-04-06 Listed $192,500 MiRealSource-MiMLS
- 2024-04-06 Listed $192,500 REALCOMP
- 2022-05-25 Listing Removed — REALCOMP
- 2014-09-27 Listing Removed — SW Michigan MLS
- 2014-09-27 Listing Removed — SW Michigan MLS
- 2012-05-21 Sold (MLS) $35,500 REALCOMP
- 2012-05-21 Sold (MLS) $35,500 SW Michigan MLS
- 2012-03-21 Listed $39,000 REALCOMP
- 2012-03-21 Listed $39,000 SW Michigan MLS
- 2011-03-14 Listing Removed — REALCOMP
- 2010-09-14 Listed $95,000 REALCOMP
- 2010-09-14 Listed $95,000 SW Michigan MLS
- 2009-03-24 Sold (Public Records) $95,000 Public Records
- 2009-03-20 Sold (MLS) $100,000 REALCOMP
- 2009-03-20 Sold (MLS) $100,000 SW Michigan MLS
- 2009-01-21 Listing Removed — REALCOMP
- 2008-11-25 Listed $104,900 REALCOMP
- 2008-11-25 Listed $104,900 SW Michigan MLS
- 2008-07-21 Listed $109,900 REALCOMP
- 2008-07-21 Listed $109,900 SW Michigan MLS
- 2007-08-21 Listing Removed — SW Michigan MLS
- 2007-03-24 Listed $65,000 SW Michigan MLS
- 2007-03-24 Listed $65,000 REALCOMP
Property tax history
+1.0%/yrLatest (2025): $1,937 · +17.4% YoY. Source: county tax records.
Cash-flow waterfall
monthlySold comps — $/sqft
last 12 mo · ≤1 miLoading sold comps…