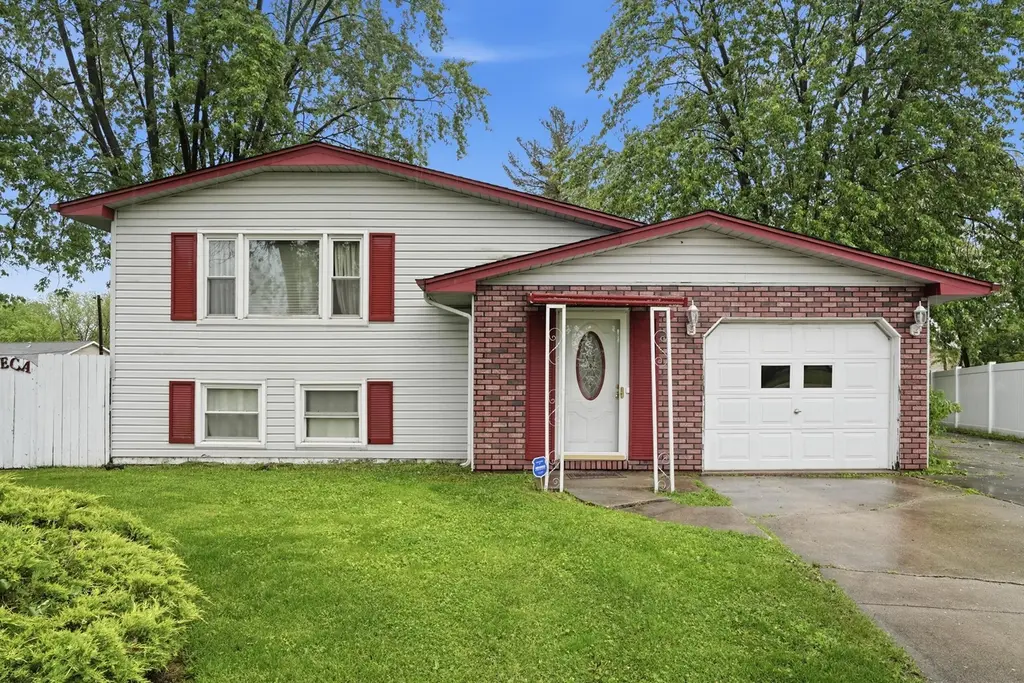
7055 Van Buren St · Merrillville, IN
Flood risk 1/10 · Minimal
- FEMA flood zone
- X (unshaded)
- Chance of flooding over 30 yrs
- 0.0%
- Est. flood insurance / yr
- $507 – $1,088
Fire risk 1/10 · Minimal
- Est. fire insurance / yr
- $717 – $1,331
Heat risk 2/10 · Minimal
- Hot days now (above 101°F)
- 7 days/yr
- Hot days in 30 yrs
- 15 days/yr
Wind risk 2/10 · Minimal
- Chance of severe wind over 30 yrs
- 0.0%
Air-quality risk 3/10 · Minor
- Unhealthy air days now
- 2 days/yr
- Unhealthy air days in 30 yrs
- 3 days/yr
Risk factors via First Street. Map © Google.
Why this score? — see what drove the C+ grade
The composite is a weighted blend of 9 inputs, each scored 0–100. Each bar is that input's sub-score; the figure is the points it added to the 100-point composite (weight × sub-score).
- Cash flow +25.6/30.0
- ARV discount +10.0/15.0
- DSCR +8.5/10.0
- 1% rule +5.7/10.0
- Livability +3.8/5.0
- Rent growth +3.5/5.0
- Schools +2.6/10.0
- Condition / age +2.5/5.0
- Appreciation +0.0/10.0
$259,500
🖨 Deal sheet 📄 Offer letter ✓ Due diligence
Listing remarks
Welcome to this well-maintained 1966 bi-level home offering space, versatility, and timeless character that sits in a cul-de-sac. Lower level recently renovated with a large family room, downstairs kitchen with a brand new refrigerator, laundry room, bedroom, and second living room that leads out to the large backyard. The lower level is perfect for extended family, recreation, a home office, or potential related living arrangements. The main level holds the upstairs kitchen with three bedrooms and a large family room. House is being sold AS IS. Do not miss this great opportunity to own!
Key facts
- Large family room
- Upstairs kitchen
- Large backyard
Tags
Property features AI
Exterior
- Parking: Driveway; 1-car garage
- Utilities: Public water; Public sewer
- Home design: Single-family property; Bi-level / lower-level living areas; Built in 1966
- Construction: Built in 1966
- Exterior features: Neighborhood view; Shed(s) on property
Interior
- Kitchen: Gas range; Microwave; Refrigerator
- Bedrooms: Primary bedroom; Bedroom 2; Bedroom 3; Bedroom 4
- Bathrooms: 2 full bathrooms
- Interior features: Ceiling fans; In-law floorplan; Additional interior features
- Laundry & utility: Laundry room with sink on lower level; Washer and dryer included
Neighborhood map
What this means for you Summary
Snapshot
- This is a 4-bed/2.0-bath single-family listed at $260k.
Deal economics
- At list price, monthly cash flow is $610 ($7k/yr) — positive.
- The deal already cash-flows at list — no discount required.
- Meets the 1% rule at list price ($3k rent vs $260k).
- Recommended offer: $256k (1.5% below list) — sets the bar for market timing.
- Cap rate 9.1% vs local median 4.7% in Merrillville — top-decile yield for the area; either an underpriced asset or a hidden risk that comps aren't pricing in. Stress-test before assuming the spread holds.
Location & tenants
- Location reads 76/100 on livability (#50 in IN, #3,393 nationally) — a middle-class / working-renter tenant base. Strengths: commute A+, cost of living A+, housing A+; Watch: schools D+, amenities F, health & safety D-.
- Merrillville Community School Corporation (suburban): math 22% / reading 36% proficiency, ranked #240 of 301 in IN (top 80%) — low school quality limits family demand, transient renter base, plan for 1-2y turnover.
- Market conditions: Rents rising fast (+4.1%/yr); 264 active listings in the ZIP; 2 comparable units currently listed for rent nearby; 1,642 units permitted in Lake County in 2024 (14 in 5+ unit buildings).
- At $2,778/mo this rent would consume 52% of the median local household income ($64k/yr) (locally 1644% of renters already pay >50% of income on rent) — very limited rent-growth headroom before tenants either downsize or default.
Forward outlook
- Local home prices are declining (-3.0%/yr); year-one equity from $2k of loan paydown is wiped out by about $8k of value loss. Plan a longer hold.
- Lake County population projected to shrink 7% by 2050 — rents likely to lag national; underwrite the cash flow, not the appreciation.
- At projected returns (-3.0% appreciation + 4.1% rent growth), your $73k cash investment doubles in ~10 years — after that, you're playing with house money.
Negotiation context
- It's been on market 27 days — a 2% lower offer ($256k) is reasonable based on typical stale-listing flexibility.
Questions for the listing agent
- Built in 1966 — when were the roof, HVAC, electrical panel, plumbing, and water heater last replaced?
- Is there a deadline driving the sale (1031 exchange, divorce, estate, relocation)? That informs how much negotiation room exists.
- Schools are D-rated, which usually means shorter tenancies and higher turnover. Who's the typical renter profile here, and what's been the actual vacancy rate?
- What's the average days-on-market for RENTAL listings here right now (not sales)? A rising rental-DOM trend means longer vacancies and softer asking-rent achievability than the comps imply.
- What's the recent tenant-quality profile in this submarket — average credit score on applications, eviction rate, late-payment / NSF rate, and stable-employment percentage? A property-management company in the area should have these aggregated.
- How much new for-sale + rental construction is in the pipeline within 1–3 miles? Heavy new supply typically softens prices + rents 12–24 months out; constrained supply supports both.
Investment metrics
- 1% rule
- 1.07% ✓
- Cap rate
- 9.11%
- Cash-on-cash
- 10.08%
- DSCR
- 1.45
- GRM
- 7.8
CMA / ARV
- ARV (on-the-fly)
- $274,548
- Comps found
- 12
Show comp detail 12 sales within ~0.75 mi
| Address | Dist | Beds/Ba | Sqft | Sold | Price | $/sf | Match |
|---|---|---|---|---|---|---|---|
| 815 W 70th Ave | 0.22mi | 4/2.0 | 1,850 (-8%) | 1mo | $337,000 | $182 | 76 |
| 6810 Van Buren St | 0.32mi | 4/2.0 | 2,128 (+6%) | 2mo | $243,000 | $114 | 74 |
| 7216 Pierce St | 0.40mi | 3/2.0 (-1) | 2,060 (+3%) | 1mo | $273,900 | $133 | 71 |
| 1429 W 74th Pl | 0.68mi | 3/2.5 (-1) | 1,945 (-3%) | 2mo | $285,000 | $147 | 55 |
| 1136 W 72nd Cir | 0.47mi | 4/2.0 | 2,216 (+11%) | 7mo | $299,900 | $135 | 55 |
| 1110 W 72nd Cir | 0.43mi | 3/2.0 (-1) | 1,768 (-12%) | 1mo | $295,000 | $167 | 55 |
| 7220 Tyler Ct | 0.33mi | 5/2.0 (+1) | 2,250 (+12%) | 6mo | $274,900 | $122 | 55 |
| 919 W 69th Pl | 0.34mi | 5/2.0 (+1) | 1,728 (-14%) | 2mo | $298,000 | $172 | 54 |
| 1130 W 72nd Ct | 0.44mi | 3/2.5 (-1) | 1,788 (-11%) | 4mo | $245,000 | $137 | 51 |
| 6927 Delaware St | 0.72mi | 3/1.0 (-1) | 1,940 (-3%) | 2mo | $120,000 | $62 | 50 |
| 1525 W 74th Pl | 0.71mi | 4/2.0 | 1,816 (-9%) | 7mo | $295,000 | $162 | 45 |
| 7145 Delaware St | 0.73mi | 3/1.0 (-1) | 1,748 (-13%) | 6mo | $228,000 | $130 | 30 |
Match score weights: distance 35% · size 25% · config 20% · recency 20%. Top-matched comps best support the ARV.
Projected returns pro-forma
-3.0% appreciation · 4.1% rent growth · sell at horizon
- IRR
- -0.1%
- Equity multiple
- 1.00×
- Total profit
- $-174
- Equity at exit
- $38,692
- IRR
- 10.6%
- Equity multiple
- 1.86×
- Total profit
- $62,571
- Equity at exit
- $22,437
Cash invested: $72,660 (down + closing). Projections, not guarantees.
Landlord ↔ Tenant lean methodology
- Overall (STATE)
- 90 Strongly Landlord-Friendly
- State Indiana
- 90 Strongly Landlord-Friendly · R+11
- County
- — inherits STATE
- City
- — inherits STATE
ZIP-level market 46410
- Rents YoY
- 4.1%
- Active inventory
- 264
- Price-to-rent
- 7.8×
Monthly cashflow live
- Estimated rent
- $2,778 medium interval (Pro) →
- Mortgage (P&I)
- −$1,361
- Tax from tax record
- −$115 /mo · $1,385/yr
- Insurance
- −$108
- HOA
- −$0
- Vacancy / Maint / Mgmt
- −$583
- Net cashflow
- $610
Break-even live
UW: 25.0% down · 7.5% · 30yr · 1.5% tax · 5.0% vac · 8.0% maint · 8.0% mgmt
Financing live
Cash to close
- Down payment
- $64,875
- Closing costs
- $7,785
- Reserves months
- —
- Total cash needed
- —
Loan-product check · same deal, 3 products live
Conventional
25% down · 7.5% · 30yr
- Down + closing
- —
- Monthly P&I
- —
- Monthly cashflow
- —
- DSCR
- —
- Eligible?
- —
Personal DTI + credit; lowest rate.
DSCR
20% down · 8.5% · 30yr
- Down + closing
- —
- Monthly P&I
- —
- Monthly cashflow
- —
- DSCR
- —
- Eligible?
- —
No personal income docs; deal must DSCR.
Hard money
10% down · 12.0% · 12mo
- Down + closing
- —
- Monthly P&I
- —
- Monthly cashflow
- —
- DSCR
- —
- Eligible?
- —
Short-term bridge; refi at stabilization.
Rent comps 2 comps
| Address | Beds | Baths | Sqft | Rent | $/sqft | DOM | Units | Dist |
|---|---|---|---|---|---|---|---|---|
| 330 E 69th Pl Merrillville, IN | 3.0 | 1.5 | 1482 | $1,850 | $1.25 | 2d | 1 | 0.66mi |
| 1865 W 64th Pl Merrillville, IN | 4.0 | 2.0 | 2034 | $4,900 | $2.41 | 43d | 1 | 1.08mi |
Listing history 17 events
-
2026-06-18status $259,500 Pending 27 DOM
-
2026-06-18days on market $259,500 Active 27 DOM
-
2026-06-17days on market $259,500 Active 26 DOM
-
2026-06-16days on market $259,500 Active 25 DOM
-
2026-06-15days on market $259,500 Active 24 DOM
-
2026-06-13days on market $259,500 Active 22 DOM
-
2026-06-13days on market $259,500 Active 21 DOM
-
2026-06-09days on market $259,500 Active 18 DOM
-
2026-06-08days on market $259,500 Active 17 DOM
-
2026-06-08price $259,500 Active 16 DOM
-
2026-06-07days on market $264,500 Active 16 DOM
-
2026-06-04days on market $264,500 Active 13 DOM
-
2026-06-03days on market $264,500 Active 12 DOM
-
2026-06-02days on market $264,500 Active 11 DOM
-
2026-06-01days on market $264,500 Active 10 DOM
-
2026-05-31days on market $264,500 Active 9 DOM
-
2026-05-22$264,500 Active
ⓘ Source: listings_history table (triggers on properties + properties_extension) + one-shot
backfill from property_details.listing_events for pre-trigger history.
Tax reassessment forecast IN · Partial reset (capped growth)
- Current annual tax
- $1,385 · $115/mo
- Projected year-2 tax
- $1,795 · $150/mo
- Expected delta
- +$410/yr (+$34/mo · 29.6%)
ⓘ Screening estimate from a state-policy table — verify with the county assessor before closing.
Climate risk First Street
- Flood 1/10 Low FEMA zone X (unshaded) · 0% chance over 30 yrs
- Wildfire 1/10 Low
- Heat 2/10 Low 7 d/yr ≥101°F today · 15 d/yr by 30 yrs out
- Wind 2/10 Low 0% chance of damaging wind over 30 yrs
- Air quality 3/10 Moderate 2 unhealthy d/yr today · 3 by 30 yrs out
Nearby sold comps map
Loading sold comps map…
Walkable amenities ~0.75 mi
Loading nearby amenities…
Taxation est. · year 1
- Rental income
- $33,333
- − Mortgage interest
- −$14,536
- − Property taxes
- −$1,385
- − Insurance
- −$1,298
- − Repairs & maintenance
- −$2,667
- − Management
- −$2,667
- − Depreciation
- −$7,549
- Taxable income
- $3,232
- Est. tax owed @ 24.0%
- −$776
- After-tax cash flow
- $6,545/yr
For passive investors: Depreciation is non-cash, so a rental often shows a tax loss while cash-flowing — sheltering income. Rental losses are passive: they offset passive income freely, and up to $25,000/yr can offset ordinary (W-2) income if you actively participate and your MAGI is under $100k (phasing out to $0 by $150k); unused losses carry forward. On sale, claimed depreciation is recaptured at up to 25%, and gains may owe capital-gains tax (a 1031 exchange can defer both). Figures are a year-1 estimate at your 24.0% rate — not tax advice; consult a CPA.
Schools (NCES district)
- District
- Merrillville Community School Corporation
- NCES district ID
- 1809690
- Math proficiency
- 22% ▼ -17.00%
- Reading proficiency
- 36% ▼ -8.00%
- Median HH income
- $54,401
- Composite
- 25.74/100
- National rank
- #7375
- State rank
- #240 of 301 in IN
Livability — Merrillville
- Score
- 76/100
- State rank
- #50
- US rank
- #3393
Category grades
Schools grade is shown separately in the Schools card above.
Census & demographics
- Census place
- Merrillville, IN
- County
- Lake County · 422,878 people
- City population
- 39,243
- Metro
- Chicago-Naperville-Elgin, IL-IN-WI
- Population (ZIP)
- 39,243
- Household income
- $64,127
- Rent vs Own
- Severe rent burden
- 1644.0
Population outlook (Lake County) Hauer SSP2
- Today (2025)
- 484,026 people
- By 2030
- 478,091 · -1.2%
- By 2040
- 462,974 · -4.3%
- By 2050
- 449,894 · -7.1%
- By 2075
- 436,169 · -9.9%
- By 2100
- 426,607 · -11.9%
Race, ethnicity, and origin ACS 2023
- Neighborhood character
- Diverse neighborhood (Simpson 0.66)
- Race & ethnicity
- Black 46% White 32% Hispanic / Latino 16% Two or more races 9% Asian 2%
- Hispanic origin (detail)
- Mexican 11% Puerto Rican 3%
- Common ancestry
- Romanian 4% Iranian 2% Italian 1%
- Foreign-born
- 7% · Canada
- Languages at home
- 88% English-only · Spanish 7% Other Indo-European 2%
Political lean MEDSL · Lake
- 2024 margin
- Lean D (+5.6) · D 52.1% · R 46.5% · Other 1.5%
- 2008→2024 swing
- -28.6pp toward R · 2008: 34.3pp · 2024: 5.6pp
- All cycles
- 2024: D+5.6 2020: D+15.1 2016: D+20.6 2012: D+31.0 2008: D+34.3
Not yet ingested
- Civics
- —
Market trends
- HPI YoY
- ▼ -180.11%
- Current HPI
- 240.8833
- Rent YoY
- ▲ 4.10%
- Metro
- Chicago-Naperville-Elgin, IL-IN-WI
- State GDP YoY
- ▲ 2.90%
- F500 in state
- 18
Industry mix (Fortune 500 HQ in IN)
| Industry | F500 HQs | Revenue |
|---|---|---|
| Industrial Machinery | 2 | $37B |
|
||
| Healthcare | 1 | $177B |
|
||
| Pharmaceuticals | 1 | $45B |
|
||
| Metals / Steel | 1 | $18B |
|
||
| Agriculture | 1 | $17B |
|
||
| Packaging | 1 | $12B |
|
||
Price history
1 event — show timeline
- 2026-05-22 Listed $264,500 NIRA MLS as Distributed by MLS Grid
Property tax history
+3.6%/yrLatest (2024): $1,385 · +8.8% YoY. Source: county tax records.
Cash-flow waterfall
monthlySold comps — $/sqft
last 12 mo · ≤1 miLoading sold comps…